Molecular Gas Distribution in Barred and Non-barred Galaxies along the Hubble Sequence
Abstract
We present results from a survey of 12CO (J = 1–0) spectra obtained for the central regions of 68 nearby galaxies at an angular resolution of 16′′ using the Nobeyama Radio Observatory 45m telescope, aimed at characterizing the properties of star forming molecular gas. Combined with similar resolution observations in the literature, the compiled sample set of 166 galaxies span a wide range of galactic properties. NGC 4380, which was previously undetected in CO, was detected.
This initial paper of a series will focus on the data and the gaseous properties of the samples, and particularly on the degree of central concentration of molecular gas in a range of morphological types, from early (S0/Sa) to late (Sd/Sm) galaxies with and without bars. The degree of molecular central concentration in the central kiloparsec, compared to the central several kiloparsecs of galaxies, is found to vary smoothly with Hubble type, so that early type galaxies show larger central concentration. The comparison of barred and non-barred galaxies within early and late type galaxies suggest that difference in Hubble type, representing the effect of bulges, is the more important factor in concentrating gas into the central regions than bars.
1 Introduction
Molecular gas is the driving element of star formation in galaxies, and its quantitative relation to the current star formation rate is essential to our understanding of galactic evolution. It has become increasingly clear that the dynamical properties of galaxies are responsible for redistributing molecular gas on large scales, and hence the star formation which follows is also affected by the dynamical properties. These dynamical properties are expressed as large scale features (morphology) of the galaxies, i.e., the presence bars and difference between Hubble type. These two features (presence of bars and Hubble type) are most prominent and characteristic in the central kiloparsecs of galaxies, which is also where most of the molecular gas in galaxies is present. Therefore, the distribution of gas within the central region of various morphologies and its relation with star formation has gained attention in recent years.
Bars on kpc scales at the centers of galaxies are known to redistribute angular momentum and transfer molecular gas to the centers. Sakamoto et al. (1999) showed that molecular gas in barred galaxies has a higher degree of concentration in its central 1 kpc compared to gas inside the optical disk, by using interferometric data from the Nobeyama Millimeter Array (NMA) and Owens Valley Radio Observatory (OVRO) at resolution. Similarly, Sheth et al. (2005) showed by using the Berkeley-Illinois-Maryland-Array (BIMA) at resolution that the central 1 kpc of barred galaxies has four times more molecular gas compared to the global average. Some barred galaxies in their sample were not detected, and they attribute it to the quenching of gas due to efficient star formation in barred galaxies. Single dish observations have also proved effective. By using the Nobeyama Radio Observatory∗ (NRO) 45m telescope, Kuno et al. (2007) mapped out 40 nearby galaxies at resolution. They defined the ”inner” central concentration as the ratio between molecular mass in of the K band radius (defined at 20 in the band) and that within of the K band radius. They similarly defined the ”outer” central concentration as the ratio between molecular mass in of the K band radius and that within the whole of the K band radius. They found that barred galaxies have a significantly higher , whereas the did not show much dependence. Furthermore, they found a correlation between and the bar strength.
It seems that molecular gas concentration due to bars is a well established phenomenon, and this has also been explored in terms of numerical simulations(Combes & Gerin (1985); Pfenniger & Norman (1990); Athanassoula (1992); Wada & Habe (1995)).
Molecular gas is also known to be distributed differently between early and late type galaxies. Molecular gas mass in the centers of galaxies have been found to decrease in later Hubble types (e.g., Young & Knezek (1989), Böker et al. (2003)). This has been attributed to the existence of a stellar bulge in early type galaxies (Young & Knezek (1989)) creating a deep potential well in which gas is accumulated. Even in the absence of stellar bulges, possible correlations with nuclear star clusters and stellar surface brightness have been found (Böker et al. (2003)). Sheth et al. (2005) report a four-fold central molecular mass increase in barred early type galaxies compared to barred late type galaxies. Early type galaxies, however, have been found to host stronger bars than late types, with larger and fourier amplitudes (Laurikainen & Salo (2002), but see also Laurikainen et al. (2004)). This points to the possibility that early type galaxies may show larger central concentration simply because they host stronger bars. It is important, therefore, to quantify which factor (the presence of bars or Hubble type) plays the larger role in ridistributing gas to the central regions of galaxies.
Mapping observations in CO are optimum for the study of molecular gas distribution in nearby galaxies, but available galaxy samples are limited by the vast observing time needed for such projects (e.g., Sakamoto et al. 1999; Helfer et al. 2001; Sofue et al. 2003). In turn, single beam measurements at the centers of a large sample of galaxies lack the precision in terms of spatial distribution of molecular gas, but can compensate for the lack of number of sample galaxies. In this respect, quantifying the CO content of nearby galactic centers for a large sample using single dish telescopes, is still rewarding.
In order to complement existing studies on molecular gas concentration in galaxies of various morphology, we have conducted a large survey of the central region of nearby galaxies using NRO 45m telescope.
Our data provides a unique opportunity to study the gas distribution in the central region, with several advantages: 1) Samples are distributed mostly at the distance of 16Mpc, and therefore the single beam subtends a similar scale of the central 1 kpc of galaxies. 2) Many of our samples are also observed by Young et al. (1995) using the FCRAO 14m dish, with an angular resolution of 45′′ or a linear scale of 3 kpc. Therefore, the ratio of CO intensity measured by the different surveys can be interpreted as a degree of central concentration of molecular gas.
2 Sample Selection
The sample galaxies have been selected from those observed and detected in the FCRAO catalog (Young et al. (1995) and Kenney & Young (1988)) of nearby galaxies. The FCRAO survey is the largest CO survey of nearby galaxies (300 galaxies), spanning a wide range of parameter space for spirals, but with a large beamsize of 45′′. All of our observing samples, mainly spirals, come from galaxies observed in this survey. Since one of the secondary aims of our survey is compare the CO data with star formation (to be presented in forthcoming papers), galaxies in the FCRAO survey were selected on whether they had available data as listed in Young et al. (1996), and also with measured ratio (to be used to correct for internal dust extinction) in Ho et al. (1997). Ninety-one galaxies meet this criteria, of which 14 were already observed at either the NRO 45m or the IRAM 30m telescope which has a similar beamsize as the NRO 45m telescope. Therefore, the final selected sample consisted of 77 galaxies. Galaxies in the FCRAO survey were selected to span a wide variety of galaxies, and were not magnitude or volume limited. Our sample also follows this idea.
In the observation (see following section), 38 of the 77 were actually observed, due mainly to weather conditions. An additional five, with data from Young et al. (1996) but without , and 25 with observations from the FCRAO survey but not , were observed. These galaxies without measurements were simply selected by whether they were observable at that certain perioud. Thus, our observed sample consists of 68 galaxies. Table 1 lists the observed samples.
| Galaxy | R.A. | DEC | Distance |
|---|---|---|---|
| J2000 | J2000 | Mpc | |
| (1) | (2) | (3) | (4) |
| NGC 253 | 00 47 35.2 | -25 17 20 | 2.2 |
| NGC 520 | 01 24 34.7 | +03 47 49.8 | 30.3 |
| NGC 772 | 01 59 20.3 | +19 00 22 | 34.1 |
| NGC 877 | 02 17 58.7 | +14 32 50.3 | 54.9 |
| NGC 908 | 02 23 04.8∗∗ | -21 14 06 | 19.6 |
| NGC 1022 | 02 38 32.9∗∗ | -06 40 29 | 20.1 |
| NGC 1482 | 03 54 39.4∗∗ | -20 30 08.5 | 20.5 |
| NGC 1569 | 04 30 50.3 | +64 50 48 | 3.1 |
| NGC 1961 | 05 42 04.3 | +69 22 46 | 54.1 |
| NGC 2276 | 07 27 14.4∗ | +85 45 16 | 34.4 |
| NGC 2336 | 07 27 04.1∗ | +80 10 41 | 31.9 |
| NGC 2339 | 07 08 20.5∗ | +18 46 49 | 31.1 |
| NGC 2403 | 07 36 54.5 | +65 35 58.4 | 2.2 |
| NGC 2559 | 08 17 07.5∗∗ | -27 27 34 | 17.3 |
| NGC 2683 | 08 52 41.3∗ | +33 25 19 | 3.2 |
| NGC 2976 | 09 47 15.6 | +67 54 49 | 2.3 |
| NGC 3034 | 09 55 54.0 | +69 40 57 | 2.2 |
| NGC 3147 | 10 16 53.6∗ | +73 24 03 | 38.4 |
| NGC 3556 | 11 11 30.9 | +55 40 27 | 10.3 |
| NGC 3593 | 11 14 37.0∗ | +12 49 04 | 7.3 |
| NGC 3623 | 11 18 56.0∗ | +13 05 32.0 | 4.5 |
| NGC 3631 | 11 21 02.9∗ | +53 10 11 | 16.6 |
| NGC 3675 | 11 26 08.6∗ | +43 35 09 | 9.8 |
| NGC 3690 | 11 28 33.6 | +58 33 51.3 | 41.4 |
| NGC 3893 | 11 48 39.1 | +48 42 40 | 13.8 |
| NGC 3938 | 11 52 49.8 | +44 07 26 | 11.2 |
| NGC 4038 | 12 01 53.0∗∗ | -18 51 48 | 19.2 |
| NGC 4039 | 12 01 54.2∗∗ | -18 53 06 | 19.2 |
| NGC 4041 | 12 02 12.2∗ | +62 08 14 | 17.6 |
| NGC 4088 | 12 05 35.3 | +50 32 31 | 16.4 |
| NGC 4096 | 12 06 01.0 | +47 28 31 | 11.2 |
| NGC 4157 | 12 11 04.4∗ | +50 29 05 | 12.1 |
| NGC 4178 | 12 12 46.4∗ | +10 51 57 | 16.1 |
| NGC 4212 | 12 15 39.3∗ | +13 54 06 | 16.1 |
| NGC 4293 | 12 21 12.9∗ | +18 22 57 | 16.1 |
| NGC 4298 | 12 21 32.8∗ | +14 36 22 | 16.1 |
| NGC 4302 | 12 21 42.4 | +14 36 05 | 16.1 |
| NGC 4321 | 12 22 54.9∗ | +15 49 20 | 16.1 |
| NGC 4380 | 12 25 22.2∗ | +10 01 00 | 16.1 |
| NGC 4394 | 12 25 55.6∗ | +18 12 50 | 16.1 |
| NGC 4418 | 12 26 54.2 | -00 52 45 | 25.5 |
| NGC 4419 | 12 26 56.4∗ | +15 02 51 | 16.1 |
| NGC 4424 | 12 27 11.6∗ | +09 25 14 | 16.1 |
| NGC 4527 | 12 34 08.8 | +02 39 13 | 16.1 |
| NGC 4536 | 12 34 27.1∗ | +02 11 16 | 16.1 |
| NGC 4548 | 12 35 55.2∗ | +14 29 47 | 16.1 |
| NGC 4567 | 12 36 32.7∗ | +11 15 29 | 16.1 |
| NGC 4568 | 12 36 34.7 | +11 14 15 | 16.1 |
| NGC 4647 | 12 43 32.3∗ | +11 34 55 | 16.1 |
| NGC 4666 | 12 45 08.9 | -00 27 38 | 18.6 |
| NGC 4689 | 12 47 45.5∗ | +13 45 46 | 16.1 |
| NGC 4691 | 12 48 14.1∗∗ | -03 19 51 | 13.1 |
| NGC 4698 | 12 48 23.5 | +08 29 16 | 16.1 |
| NGC 4710 | 12 49 38.9∗ | +15 09 56 | 16.1 |
| NGC 4818 | 12 56 48.7∗∗ | -08 31 25 | 13.5 |
| NGC 4845 | 12 58 01.4 | +01 34 30 | 16.1 |
| NGC 4984 | 13 08 57.3∗∗ | -15 30 59 | 14.7 |
| NGC 5236 | 13 36 59.4 | -29 52 04 | 5.9 |
| NGC 5247 | 13 38 03.5 | -17 53 02 | 20.1 |
| NGC 5713 | 14 40 11.5 | -00 17 26 | 24.6 |
| NGC 5861 | 15 09 16.5∗∗ | -11 19 24 | 24.1 |
| NGC 6000 | 15 49 49.4 | -29 23 13 | 27.1 |
| NGC 6814 | 19 42 40.1∗∗ | -10 19 27 | 21.1 |
| NGC 6946 | 20 34 51.9 | +60 09 15 | 6.7 |
| NGC 6951 | 20 37 15.2 | +66 06 22 | 21.7 |
| NGC 7479 | 23 04 57.1 | +12 19 18 | 34.7 |
| NGC 7541 | 23 14 43.0 | +04 32 05 | 38.1 |
| IC 342 | 03 46 49.7 | +68 05 45 | 3.0 |
3 Observations
The observations of the 12CO (J = 1–0) line (rest frequency 115.27 GHz) were conducted with the 45m telescope at the Nobeyama Radio Observatory (NRO) of the National Astronomical Observatory of Japan, during three observing runs in May 2005, December 2005, and January 2006, under moderate weather conditions. Two Superconductor-Insulator-Superconductor (SIS) receivers, S100 and/or S80, were used for the observations. The backends were the 1024 channel digital auto-correlator with a frequency coverage of 512 MHz, or the 2048 channel acousto-optical spectrometer with a frequency coverage of 250 MHz. The CO line was observed in the upper sideband. Typical system temperatures ranged from 700 to 2000 K in the May 2005 run, and 450 to 1000 K (all in single-sideband scale) in the December 2005 and January 2006 run. The beamwidth was 16′′. Pointing was checked using SiO masers or continuum sources at 43 GHz every 0.5–1 hour, and found to be accurate within 5′′ unless otherwise noted where wind prevented pointing at such accuracy. Each of the target galaxies was observed with a single beam at the center.
The obtained data were reduced with the NEWSTAR software used commonly at NRO, which is based on the Astronomical Image Processing System (AIPS) package, developed by the National Radio Astronomy Observatory. After flagging bad spectra, first or second order baselines were subtracted, and then the antenna temperature was converted to main beam temperature through where is the main beam efficiency, taken to be 0.38 based on November 2004 observations of the Saturn and 3C279. The typical r.m.s noise ranged from 10 to 20 mK, after reduction. The spectra were then binned into velocities which best showed the emission features (typically 10 km/s or 15 km/s). The integrated intensity is calculated by , were the range of velocity for integration was chosen with reference to spectra from the FCRAO calatog (Young et al. (1995), or Kenney and Young (1988)). The errors for the line intensities were calculated as
| (1) |
where is the r.m.s. noise in , the full line width, and the velocity resolution (5, 10, 15, or 20 ).
For spectra with signal to noise ratio of less than 3, the upper limits were calculated by
| (2) |
For those galaxies which were detected in the FCRAO survey but not ours, the same was assumed. For galaxies which were detected in neither sample, an arbitraray of 100 km/s was assumed.
The observational errors presented in the following section are only for the r.m.s. errors of the baseline. In general, other sources of error (pointing error, baseline subtraction and calibration) which are difficult to quantify, are dominant sources of error for millimeter observations. Three galaxies (NGC 6951, NGC 6946 and IC 342) were observed both in this study and the survey by Nishiyama and Nakai (2001) at the same telescope. The integrated intensities of NGC 6951 and IC 342 are consistent to within 30 %. For NGC 6946, Nishiyama and Nakai (2001) give a value which is % of this study, but may be attributed to the bad observing condition in our study (system temperature 1400 K). For most of the samples, therefore, readers should assume a typical error of % for the obtained integrated intensities.
4 Results
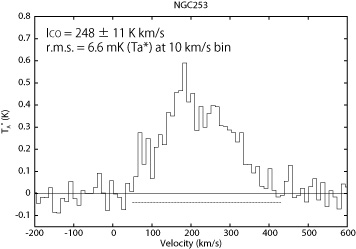
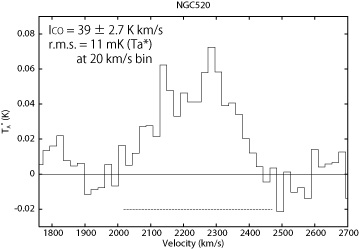
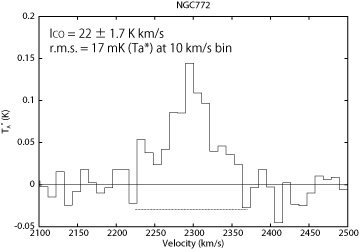
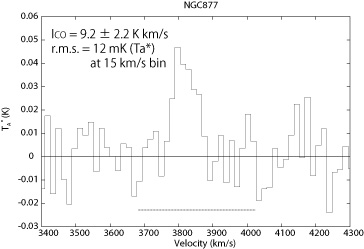
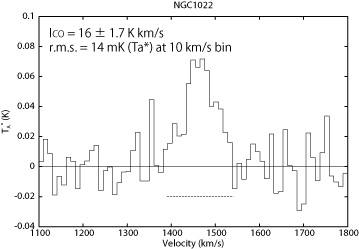
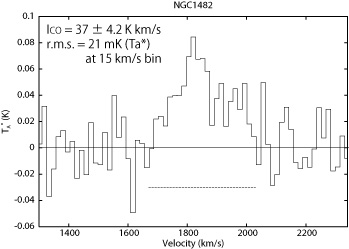
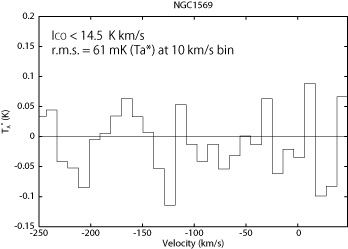
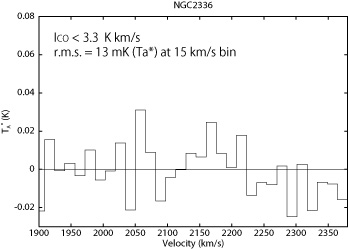
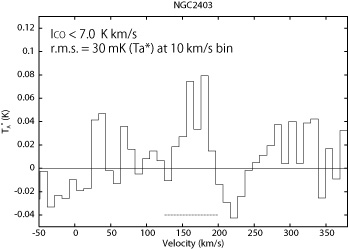
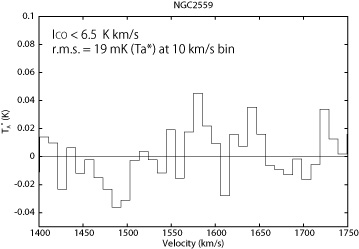
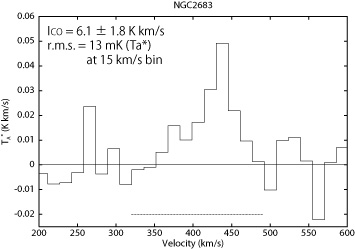
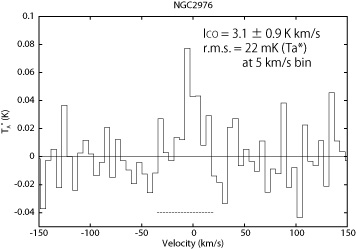
We show the spectra of the observed galaxies in figure 1 (detected galaxies followed by tentative detections and non-detections). Of the 68 galaxies observed, 54 were detected at a signal to noise ratio (S/N) of more than 5, and 60 galaxies with S/N more than 3. All analysis in this paper will be limited towards galaxies with S/N over 5.
|
|
|
![[Uncaptioned image]](/html/0805.4048/assets/f1g.jpg)
![[Uncaptioned image]](/html/0805.4048/assets/f1h.jpg)
|
![[Uncaptioned image]](/html/0805.4048/assets/f1i.jpg)
![[Uncaptioned image]](/html/0805.4048/assets/f1j.jpg)
|
![[Uncaptioned image]](/html/0805.4048/assets/f1k.jpg)
![[Uncaptioned image]](/html/0805.4048/assets/f1l.jpg)
|
![[Uncaptioned image]](/html/0805.4048/assets/f1m.jpg)
![[Uncaptioned image]](/html/0805.4048/assets/f1n.jpg)
|
![[Uncaptioned image]](/html/0805.4048/assets/f1o.jpg)
![[Uncaptioned image]](/html/0805.4048/assets/f1p.jpg)
|
![[Uncaptioned image]](/html/0805.4048/assets/f1q.jpg)
![[Uncaptioned image]](/html/0805.4048/assets/f1r.jpg)
|
![[Uncaptioned image]](/html/0805.4048/assets/f1s.jpg)
![[Uncaptioned image]](/html/0805.4048/assets/f1t.jpg)
|
![[Uncaptioned image]](/html/0805.4048/assets/f1u.jpg)
![[Uncaptioned image]](/html/0805.4048/assets/f1v.jpg)
|
![[Uncaptioned image]](/html/0805.4048/assets/f1w.jpg)
![[Uncaptioned image]](/html/0805.4048/assets/f1x.jpg)
|
![[Uncaptioned image]](/html/0805.4048/assets/f1y.jpg)
![[Uncaptioned image]](/html/0805.4048/assets/f1z.jpg)
|
![[Uncaptioned image]](/html/0805.4048/assets/f1aa.jpg)
![[Uncaptioned image]](/html/0805.4048/assets/f1ab.jpg)
|
![[Uncaptioned image]](/html/0805.4048/assets/f1ac.jpg)
![[Uncaptioned image]](/html/0805.4048/assets/f1ad.jpg)
|
![[Uncaptioned image]](/html/0805.4048/assets/f1ae.jpg)
![[Uncaptioned image]](/html/0805.4048/assets/f1af.jpg)
|
![[Uncaptioned image]](/html/0805.4048/assets/f1ag.jpg)
![[Uncaptioned image]](/html/0805.4048/assets/f1ah.jpg)
|
![[Uncaptioned image]](/html/0805.4048/assets/f1ai.jpg)
![[Uncaptioned image]](/html/0805.4048/assets/f1aj.jpg)
|
![[Uncaptioned image]](/html/0805.4048/assets/f1ak.jpg)
![[Uncaptioned image]](/html/0805.4048/assets/f1al.jpg)
|
![[Uncaptioned image]](/html/0805.4048/assets/f1am.jpg)
![[Uncaptioned image]](/html/0805.4048/assets/f1an.jpg)
|
![[Uncaptioned image]](/html/0805.4048/assets/f1ao.jpg)
![[Uncaptioned image]](/html/0805.4048/assets/f1ap.jpg)
|
![[Uncaptioned image]](/html/0805.4048/assets/f1aq.jpg)
![[Uncaptioned image]](/html/0805.4048/assets/f1ar.jpg)
|
![[Uncaptioned image]](/html/0805.4048/assets/f1as.jpg)
![[Uncaptioned image]](/html/0805.4048/assets/f1at.jpg)
|
![[Uncaptioned image]](/html/0805.4048/assets/f1au.jpg)
![[Uncaptioned image]](/html/0805.4048/assets/f1av.jpg)
|
![[Uncaptioned image]](/html/0805.4048/assets/f1aw.jpg)
![[Uncaptioned image]](/html/0805.4048/assets/f1ax.jpg)
|
![[Uncaptioned image]](/html/0805.4048/assets/f1ay.jpg)
![[Uncaptioned image]](/html/0805.4048/assets/f1az.jpg)
|
![[Uncaptioned image]](/html/0805.4048/assets/f1ba.jpg)
![[Uncaptioned image]](/html/0805.4048/assets/f1bb.jpg)
|
|
|
|
![[Uncaptioned image]](/html/0805.4048/assets/f2g.jpg)
![[Uncaptioned image]](/html/0805.4048/assets/f2h.jpg)
|
![[Uncaptioned image]](/html/0805.4048/assets/f2i.jpg)
![[Uncaptioned image]](/html/0805.4048/assets/f2j.jpg)
|
![[Uncaptioned image]](/html/0805.4048/assets/f2k.jpg)
![[Uncaptioned image]](/html/0805.4048/assets/f2l.jpg)
|
![[Uncaptioned image]](/html/0805.4048/assets/f2m.jpg)
![[Uncaptioned image]](/html/0805.4048/assets/f2n.jpg)
|
5 Other Data and Consistency
In addition to the data gathered in this study at the NRO 45m telescope, other galaxies which were observed in other previous studies either at NRO 45m or the IRAM 30m telescope were compiled. The IRAM 30m telescope has a beamwidth of 22′′, similar to the NRO45m telescope. After compilation, we have a total sample of 166 galaxies observed in CO at the central region. Furthermore, 117 of these were observed by Young et al. (1995) or Kenney & Young (1988) with 45′′ resolution.
Table 2 lists the compiled data, along with the derived integrated intensities from this study.
| Galaxy | Ref. | Distance | Hubble type | Morphology | ||
|---|---|---|---|---|---|---|
| K km/s | Mpc | K km/s | HyperLEDA | NED | ||
| (1) | (2) | (3) | (4) | (5) | (6) | (7) |
| NGC 157 | 230.9 | 2 | 23.3 | 9.02 | 4.0 | SAB(rs)bc |
| NGC 253 | 24811 | 1 | 2.2 | 467 | 5.1 | SAB(s)c |
| NGC 278 | 180.8 | 2,6 | 11.8 | 14.2 | 2.9 | SAB(rs)b |
| NGC 337a | <0.46 | 5 | 13.3* | 35.5 | 7.9 | SAB(s)dm |
| NGC 520 | 392.7 | 1 | 20.2 | 30.2 | 0.8 | Pec |
| NGC 628 | 4.10.3 | 2,6 | 10.6 | 4.15 | 5.2 | SA(s)c |
| NGC 660 | 991.3 | 2 | 13.1 | 38.2 | 1.3 | SB(s)a pec |
| NGC 772 | 221.7 | 1 | 34.1 | 16.1 | 3.0 | SA(s)b |
| NGC 864 | 60.9 | 2 | 21.8 | 1.31 | 5.1 | SAB(rs)c |
| NGC 877 | 101.6 | 1 | 54.9 | 12.9 | 4.8 | SAB(rs)bc |
| NGC 891 | 965 | 2 | 9.4 | 26.2 | 3.0 | SA(s)b sp |
| NGC 908 | 9.21.7 | 1 | 19.6 | 18.9 | 5.1 | SA(s)c |
| NGC 925 | 1.90.5 | 2 | 9.5 | 1.18 | 7.0 | SAB(s)d |
| NGC 1022 | 161.7 | 1 | 20.1 | 9.67 | 1.1 | SB(s)a |
| NGC 1042 | 2.90.3 | 2 | 19.1** | - | 6.0 | SAB(rs)cd |
| NGC 1055 | 461.6 | 2 | 14.3 | 41.1 | 3.2 | SBb sp |
| NGC 1068 | 2187 | 3 | 15.1 | 99.8 | 3.0 | SA(rs)b |
| NGC 1084 | 312.2 | 2 | 18.7 | 11.5 | 4.9 | SA(s)c |
| NGC 1087 | 151 | 2 | 24.6 | 6.86 | 5.2 | SAB(rs)c |
| NGC 1482 | 374.2 | 1 | 20.5 | 20.0 | -0.9 | SA0+ pec sp |
| NGC 1569 | <14.5 | 1 | 3.1 | 1.82 | 9.6 | IBm |
| NGC 1637 | 130.7 | 2 | 9.5** | - | 5.0 | SAB(rs)c |
| NGC 1961 | 332.9 | 1 | 54.1 | 29.5 | 4.2 | SAB(rs)c |
| NGC 2146 | 1181.9 | 2 | 13.7 | 68.4 | 2.3 | SB(s)ab pec |
| NGC 2276 | 442.5 | 1 | 34.4 | 11.4 | 4.0 | SAB(rs)c |
| NGC 2336 | <3.3 | 1 | 31.9 | <1.01 | 5.4 | SAB(r)bc |
| NGC 2339 | 461.8 | 1 | 31.1 | 16.8 | 4.0 | SAB(rs)bc |
| NGC 2403 | <7.0 | 1 | 2.2 | 4.91 | 6.0 | SAB(s)cd |
| NGC 2559 | <6.5 | 1 | 17.3 | 32.1 | 9.0 | SB(s)bc pec |
| NGC 2681 | 300.8 | 2 | 10.1 | 7.6 | 3.1 | SAB(rs)0/a |
| NGC 2683 | 6.11.8 | 1 | 3.2 | 5.07 | 0.4 | SA(rs)b |
| NGC 2715 | 7.61.5 | 2 | 20.3** | - | 5.2 | SAB(rs)c |
| NGC 2805 | 2.30.1 | 5 | 26.2* | - | 6.9 | SAB(rs)d |
| NGC 2820 | 9.81.1 | 2 | 22.9** | - | 5.4 | SB(s)c pec sp |
| NGC 2841 | 60.6 | 2 | 9.3 | 1.46 | 3.0 | SA(r)b |
| NGC 2903 | 1192.3 | 6 | 6.2 | 24 | 4.0 | SB(s)d |
| NGC 2964 | 250.9 | 2 | 16.8 | 11.4 | 4.1 | SAB(r)bc |
| NGC 2976 | 3.10.9*** | 1 | 2.3 | 2.07 | 5.3 | SAc pec |
| NGC 2985 | 122.9 | 2 | 19.1 | 9.55 | 2.3 | SA(rs)ab |
| NGC 3034 | 4176.7 | 1 | 2.2 | 289 | 8.0 | I0 |
| NGC 3079 | 2122.7 | 2 | 16.1 | 69.3 | 6.6 | SB(s)c |
| NGC 3147 | 363.7 | 1 | 38.4 | 10.5 | 3.9 | SA(rs)bc |
| NGC 3184 | 7.81 | 6 | 7.9 | 5.8 | 5.0 | SAB(rs)cd |
| NGC 3187 | 3.50.6 | 2 | 20.0** | - | 5.9 | SB(s)c pec |
| NGC 3198 | 110.5 | 2 | 9.3** | - | 5.2 | SB(rs)c |
| NGC 3227 | 543.7 | 2 | 14.3** | - | 1.4 | SAB(s) pec |
| NGC 3310 | 3.60.9 | 2 | 14.2 | 2.15 | 4.0 | SAB(r)bc pec |
| NGC 3344 | 4.30.4 | 2 | 6.9 | 4.69 | 4.0 | SAB(r)bc |
| NGC 3346 | 3.60.23 | 5 | 17.5* | - | 6.0 | SB(rs)cd |
| NGC 3351 | 171.9 | 2 | 9.0 | 14.6 | 3.0 | SB(r)b |
| NGC 3359 | 31 | 2 | 15.0 | 4.95 | 5.2 | SB(rs)c |
| NGC 3368 | 351 | 2 | 10.3 | 24.4 | 1.8 | SAB(rs)ab |
| NGC 3423 | 2.70.24 | 5 | 13.6* | - | 6.0 | SA(s)cd |
| NGC 3445 | 0.890.1 | 5 | 30.0* | - | 8.9 | SAB(s)m |
| NGC 3486 | 71 | 2 | 9.0 | 0.76 | 5.2 | SAB(r)c |
| NGC 3504 | 1033.1 | 6 | 19.7 | 13.7 | 2.1 | SAB(s)ab |
| NGC 3521 | 171.1 | 6 | 8.5 | 22.7 | 4.0 | SAB(rs)bc |
| NGC 3556 | 161.9 | 1 | 10.3 | 14.4 | 6.0 | SB(s)cd |
| NGC 3593 | 475.1 | 1 | 7.3 | 18.6 | -0.4 | SA(s)0/a |
| NGC 3623 | 251.9 | 1 | 4.5 | <1.90 | 1.0 | SAB(rs)a |
| NGC 3627 | 904 | 2 | 4.5 | 34 | 3.0 | SAB(rs)a |
| NGC 3628 | 1305.7 | 2 | 4.5 | 69.5 | 3.1 | SAb pec sp |
| NGC 3631 | 181.3 | 1 | 16.6 | 7.66 | 5.2 | SA(s)c |
| NGC 3675 | 161.7 | 1 | 9.8 | 12.2 | 3.0 | SA(s)b |
| NGC 3690 | 123.1 | 1 | 41.4 | 19.5 | 8.7 | IBm pec |
| NGC 3782 | 0.680.11 | 5 | 12.6* | - | 6.6 | SAB(s)cd |
| NGC 3810 | 242 | 1,6 | 11.5 | 14.3 | 5.2 | SA(rs)c |
| NGC 3893 | <5.4 | 1 | 13.8 | 9.72 | 5.1 | SAB(rs)c |
| NGC 3906 | 0.370.12 | 5 | 15.6* | - | 6.8 | SB(s)d |
| NGC 3913 | 1.90.22 | 5 | 15.9* | - | 6.6 | SA(rs)d |
| NGC 3938 | 6.81.1 | 1 | 11.2 | 8.86 | 5.1 | SA(s)c |
| NGC 4038 | 282.6 | 1 | 19.3 | 29.3 | 8.9 | SB(s)m pec |
| NGC 4039 | 723.2 | 1 | 19.3 | 29.6 | 8.9 | SA(s)m pec |
| NGC 4041 | 522.8 | 1 | 17.6 | 20.4 | 4.0 | SA(rs)bc |
| NGC 4088 | 202.5 | 1 | 10.9 | 15.6 | 4.8 | SAB(rs)bc |
| NGC 4096 | 181.6 | 1 | 7.5 | 5.07 | 5.3 | SAB(rs)c |
| NGC 4102 | 1159 | 6 | 13.1 | 17.5 | 3.0 | SAB(s)b |
| NGC 4157 | 241.4 | 1 | 12.1 | 21.9 | 3.3 | SAB(s)b sp |
| NGC 4178 | <3.4 | 1 | 16.1 | 1.64 | 7.1 | SB(rs)dm |
| NGC 4204 | 0.500.14 | 5 | 12.9* | - | 7.9 | SB(s)dm |
| NGC 4212 | 232.1 | 1 | 16.1 | 7.46 | 4.9 | SAc |
| NGC 4254 | 477.4 | 6 | 16.1 | 19.3 | 5.2 | SA(s)c |
| NGC 4274 | 100.4 | 2 | 11.9** | - | 1.7 | SB(r)ab |
| NGC 4293 | 671.1 | 1 | 16.1 | 11.5 | 0.3 | SB(s)0/a |
| NGC 4298 | 263.7 | 1 | 16.1 | 10.9 | 5.2 | SA(rs)c |
| NGC 4299 | 0.480.14 | 5 | 16.1 | 1.11 | 8.3 | SAB(s)dm |
| NGC 4302 | 251.9 | 1 | 16.1 | 8.91 | 5.4 | Sc sp |
| NGC 4303 | 692.1 | 6 | 16.1 | 21.6 | 4.0 | SAB(rs)bc |
| NGC 4314 | 240.3 | 2 | 10.9** | - | 1.0 | SB(rs)a |
| NGC 4321 | 635.5 | 1,2 | 16.1 | 27.3 | 4.0 | SAB(s)bc |
| NGC 4380 | 6.30.8 | 1 | 16.1 | <0.1 | 2.3 | SA(rs)b |
| NGC 4394 | 6.91.1 | 1 | 16.1 | 3.27 | 8.8 | SB(r)b |
| NGC 4411 | 0.880.10 | 5 | 17.8* | - | 5.4 | SB(rs)c |
| NGC 4414 | 795.5 | 2,6 | 9.6 | 31.6 | 5.1 | SA(rs)c |
| NGC 4416 | 5.080.19 | 5 | 19.3* | - | 5.9 | SB(rs)cd |
| NGC 4418 | 8.11.4 | 1 | 25.5 | 4.91 | 1.0 | SAB(s)a |
| NGC 4419 | 803.5 | 1 | 16.1 | 18.6 | 1.1 | SB(s)a |
| NGC 4424 | 4.90.7 | 1 | 16.1 | 1.45 | 3.0 | SB(s)a |
| NGC 4438 | 707 | 4 | 16.1 | 5.27 | 0.7 | SA(s)0/a pec |
| NGC 4487 | 3.230.15 | 5 | 13.6* | - | 5.9 | SAB(rs)cd |
| NGC 4496A | 2.170.18 | 5 | 23.6* | - | 7.5 | SB(rs)m |
| NGC 4501 | 512.5 | 6 | 16.1 | 21.8 | 3.4 | SA(rs)b |
| NGC 4527 | 261.8 | 1 | 16.1 | 28.7 | 4.0 | SAB(s)bc |
| NGC 4535 | 421.2 | 6 | 16.1 | 8.55 | 5.0 | SAB(s)c |
| NGC 4536 | 1213.7 | 1 | 16.1 | 18.4 | 4.2 | SAB(rs)bc |
| NGC 4540 | 5.570.19 | 5 | 16.1 | 1.50 | 6.1 | SAB(rs)cd |
| NGC 4548 | 171.9 | 1 | 16.1 | 6.73 | 3.1 | SBb(rs) |
| NGC 4565 | 121.2 | 2 | 15.7** | - | 3.2 | SA(s)b sp |
| NGC 4567 | 152.1 | 1 | 16.1 | 8.55 | 4.0 | SA(rs)bc |
| NGC 4568 | 873.4 | 1 | 16.1 | 19.1 | 4.1 | SA(rs)bc |
| NGC 4569 | 1343.2 | 6 | 16.1 | 26.6 | 2.4 | SAB(rs)ab |
| NGC 4618 | 0.720.17 | 5 | 10.0* | - | 8.6 | SB(rs)m |
| NGC 4625 | 3.780.11 | 5 | 10.9* | - | 8.8 | SAB(rm)m pec |
| NGC 4647 | 262.5 | 1 | 16.1 | 9.09 | 5.2 | SAB(rs)c |
| NGC 4651 | 61 | 2 | 16.1 | 7.64 | 5.2 | SA(rs)c |
| NGC 4654 | 240.9 | 2 | 16.1 | 6.0 | 5.9 | SAB(rs)cd |
| NGC 4666 | 472.5 | 1 | 18.6 | 30.2 | 5.0 | SABc |
| NGC 4688 | 0.440.08 | 5 | 13.9* | - | 6.0 | SB(s)cd |
| NGC 4689 | 201.7 | 1 | 16.1 | 6.55 | 4.7 | SA(rs)bc |
| NGC 4691 | 282.0 | 1 | 13.1 | 4.8 | 0.4 | SB(s)0/a pec |
| NGC 4698 | <3.0 | 1 | 16.1 | <0.73 | 1.4 | SA(s)ab |
| NGC 4701 | 2.90.22 | 5 | 10.3* | - | 5.8 | SA(s)cd |
| NGC 4710 | 341.8 | 1 | 16.1 | 7.82 | -0.8 | SA(r)0 sp |
| NGC 4736 | 613.9 | 6 | 4.0 | 17.5 | 2.4 | SA(r)ab |
| NGC 4775 | 1.630.22 | 5 | 20.9* | - | 6.9 | SA(s)d |
| NGC 4818 | 962.6 | 1 | 13.5 | 16.8 | 2.0 | SAB(rs)ab pec |
| NGC 4826 | 1401.9 | 6 | 5.0 | 44.7 | 2.4 | SA(rs)ab |
| NGC 4845 | <3.1 | 1 | 16.1 | 6.07 | 2.3 | SA(s)ab sp |
| NGC 4984 | 492.8 | 1 | 14.7 | 12.3 | -0.8 | SAB(rs)0 |
| NGC 5005 | 765.4 | 2 | 14.3 | 30.4 | 4.0 | SAB(rs)bc |
| NGC 5033 | 594 | 2,6 | 12.8 | 13.1 | 5.2 | SA(s)c |
| NGC 5112 | 1.70.4 | 2 | 13.4** | - | 5.8 | SB(rs)cd |
| NGC 5236 | 364.9 | 1 | 5.9 | 88.7 | 5.0 | SAB(s)c |
| NGC 5247 | 314 | 1 | 20.1 | 7.67 | 4.0 | SA(s)bc |
| NGC 5248 | 672.3 | 6 | 14.7 | 19.5 | 4.1 | SB(rs)bc |
| NGC 5364 | 51 | 2 | 18.0 | 1.00 | 4.0 | SA(rs)bc pec |
| NGC 5668 | 1.780.26 | 5 | 22.2* | - | 6.0 | SA(s)d |
| NGC 5669 | 2.280.27 | 5 | 19.8* | - | 6.9 | SAB(rs)cd |
| NGC 5713 | 322.5 | 1 | 24.6 | 11.0 | 4.0 | SAB(rs)bc pec |
| NGC 5725 | 1.120.24 | 5 | 22.8* | - | 7.0 | SB(s)d |
| NGC 5861 | <12 | 1 | 24.1 | 10.2 | 5.0 | SAB(rs)c |
| NGC 5907 | 321.6 | 2 | 10.4 | 7.49 | 5.4 | SA(s)c sp |
| NGC 5921 | 61.8 | 2 | 19.0** | - | 4.0 | SB(r)bc |
| NGC 5964 | 0.890.17 | 5 | 20.7* | - | 6.9 | SB(rs)d |
| NGC 6000 | 282.0 | 1 | 27.1 | 39.1 | 3.9 | SB(s)bc |
| NGC 6015 | 5.10.8 | 2 | 13.6** | - | 6.0 | SA(s)cd |
| NGC 6217 | 191.6 | 2 | 21.1 | 10.2 | 4.0 | SB(rs)bc |
| NGC 6384 | 7.60.7 | 2 | 24 | 3.27 | 3.6 | SAB(r)bc |
| NGC 6503 | 111.1 | 6 | 4.2 | 3.78 | 5.9 | SA(s)cd |
| NGC 6509 | 5.970.23 | 5 | 25.7* | - | 6.6 | SBcd |
| NGC 6643 | 141.6 | 6 | 23.1 | 13.8 | 5.2 | SA(rs)c |
| NGC 6814 | 7.51.2 | 1 | 21.1 | 4.71 | 4.0 | SAB(rs)bc |
| NGC 6946 | 3944.7 | 1,6 | 6.7 | 79.8 | 5.9 | SAB(rs)cd |
| NGC 6951 | 782.6 | 1,6 | 21.7 | 15.2 | 3.9 | SAB(rs)bc |
| NGC 7217 | 71.4 | 2,6 | 16.3 | 4.13 | 2.5 | SA(r)ab |
| NGC 7331 | 191.3 | 2,6 | 14.7 | 6.98 | 3.9 | SA(s)b |
| NGC 7479 | 372.5 | 1 | 34.7 | 12.9 | 4.4 | SB(s)c |
| NGC 7541 | 492.2 | 1 | 38.1 | 14.8 | 4.7 | SB(rs)bc pec |
| NGC 7640 | 2.30.3 | 2 | 8.5 | 1.33 | 5.3 | SB(s)c |
| NGC 7741 | 1.10.3 | 2,5 | 11.7* | - | 6.0 | SB(s)cd |
| IC 342 | 1993.9 | 1,6 | 3.0 | 65.5 | 5.9 | SAB(rs)cd |
| UGC 3574 | 1.160.18 | 5 | 21.9* | - | 5.9 | SA(s)cd |
| UGC 8516 | 1.200.19 | 5 | 15.4* | - | 5.9 | Scd |
| MCG1-3-85 | 1.390.18 | 5 | 13.6* | - | 7.0 | SAB(rs)d |
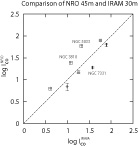
Although the beamwidth of the IRAM 30m telescope at 22′′ is similar to that of the NRO 45m telescope at 16′′, it is important that CO detected at both telescopes can be compared on a same scale. In order to confirm this point, figure 3 plots the derived integrated intensity for galaxies which overlapped between observations at NRO 45m and IRAM 30m telescope. A clear proportionality with a slope of order unity can be seen, despite the small number of samples. The zero point of this relation is effectively 0, despite the difference in beam size, enabling a direct comparison of observed intensity.
Three galaxies deviate from the relation in 3 by more than a factor of two (NGC 3810, NGC 5033, and NGC 7331). All of these galaxies are from Nishiyama and Nakai (2001) and Braine et al. (1993) for the NRO 45m and IRAM 30m measurements, respectively. NGC 3810 has a starbursting nuclei, and its at a single beam away from its nuclei drops to nearly half Nishiyama and Nakai (2001). The observing coordinate in Nishiyama and Nakai (2001) and Braine et al. (1993) are offset by 4′′, possibly explaining the excess of in the NRO 45m measurement. The for NGC 5033 also drops by more than 50% from the center in Nishiyama and Nakai (2001), making the CO intensity consistent with that of Braine et al. (1993). The offset in observing coordinate () coupled with pointing errors may account for the discrepancy. The observing coordinate for NGC 7331 differ by . Since the coordinate in Braine et al. (1993) is offset from the true center, the difference in may reflect the central CO hole which explains the smaller CO intensity in Nishiyama and Nakai (2001). Nevertheless, it is important to bear in mind that when comparing CO intensities from the different telescopes, an error of typically a factor 2 may infact be involved.
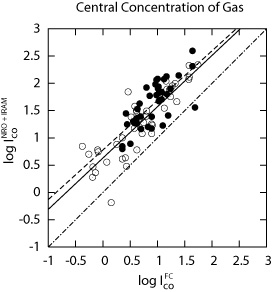
A secondary check can be implemented by using the 45′′ resolution data from the FCRAO data from Young et al. (1995). The ratio of CO intensity at NRO 45m or IRAM 30m telescope to the FCRAO intensity expresses a measure of the central condensation of gas; if the angular resolution difference of the NRO 45m and IRAM 30m telescope has a significant effect on the derived intensity, this ratio should display a systematic difference between the two telescopes. Figure 4 plots the CO intensity observed at the FCRAO versus the intensity observed either at NRO 45m or IRAM 30m telescope, including those only with more than a 3 detection. A clear correlation can be seen, and a least squares fit to the CO intensity from NRO45m telescope gives
| (3) |
where as the same fit to IRAM30m telescope will give
| (4) |
Both fits are consistent within the range of error, and we conclude that the data from these two telescopes with different beamsizes can be compared on a same scale without correction.
6 Sample Properties
Figure 5 shows the distance distribution of our compiled samples from the NRO 45m and IRAM 30m dishes. The samples are strongly peaked at around 16 Mpc, where the Virgo cluster members lie. The distances here are taken from Young et al. (1995) scaled to except for Virgo cluster members, where a more recent measurement (Ferrarese et al. (1996)) gives 16.1 Mpc using Cepheid variables. The observing beam of 16′′ and 22′′ for 16 Mpc correspond to a linear scale of 1.2 kpc and 1.8 kpc, respectively. These both correspond to radii within 1 kpc of the center, and considering that most of our samples lie around this distance, we will simply refer hereafter to these data as gas in the “central kpc” and its corresponding CO intensity or as . CO measured in Young et al. (1995) and Kenney & Young (1988) with the 45′′ beamsize will be referred to as gas in the “central 3 kpc”, denoted . The reader should refer to table 2 for the actual linear scale of the measurement for individual galaxies.
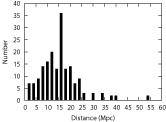
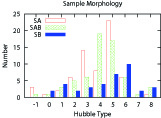
Figure 6 shows the distribution of morphology for all sample galaxies detected in CO at the central kpc. The Hubble types are taken from the HyperLEDA database (Paturel et al. 2003). Most galaxies lie on Hubble type 4 - 5, corresponding to Sbc - Sc on de Vaucouleur’s scale. No apparent biases are seen in regard to the fraction of barred/non-barred galaxies in certain Hubble type, although we have significantly less SB galaxies compared to SA or SAB galaxies in total. A weak bias may exist that more barred galaxies are observed in the latest types, but may also be representative of the general galaxy population (e.g., Abraham & Merrifield (2000)).
The inclination () of the target galaxies result in a variation in the projected area of the observing beam. This is especially important in our case because we observed the galaxies with only one beam. It is common to multiply the observed CO intensity by to correct for this effect.
Figure 7 shows the variation of CO intensity on . The observed CO intensity depends very weakly on . If the true CO distribution within the observing beam is disk-like, requiring a correction for inclination, the observed CO intensity must increase as the inclination becomes edge-on; the effective observing area of the subtended beam becomes larger, scaling as . This will result in a slope of in the vs. figure. A least squares fit to figure 7 results in a slope of . Although a variation of CO intensity on inclination does exist, the intrinsic dispersion in the CO intensities are far larger.
This can be explained if the effect is of geometrical quality, where in the literature is physically not well-defined in the central regions, owing to thickness of the disk. The molecular gas distribution in the 16′′ beam may not be represented well by a disk structure, in which case a correction by factor will be artificial. The view is also supported by the fact that the trend in figure 7 is same at different wavelengths (Komugi et al. (2007)), which cannot be explained if the bias results from issues with optical depth.
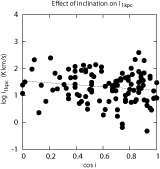
In the succeeding sections, we either use the CO intensity alone (without correcting for inclination), or use intensity ratios in different beamsizes to cancel any effects from inclinations.
7 Central Concentration and Bars
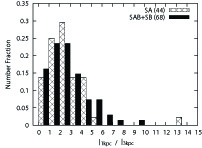
Figure 8 shows the number distribution of the ratio of molecular gas surface mass density in the central 1 kpc to the central 3 kpc, or the central concentration, normalized to sample size. The central concentration of gas in both barred and non-barred galaxies peak at about 1 to 2, but non-barred galaxies quickly drop off above 5. Barred galaxies, however, seem to show a tail of high central molecular concentration up to 9. Above 5, barred galaxies dominate the distribution. Barred galaxies from Kuno et al. (2007) also show a higher central concentration, and figure 8 confirms this using a large number of samples. The probability that the distribution of barred galaxies and that of non-barred galaxies being derived from a same parent population (the Kolmogorov-Smirnov (KS) test) is . This indicates that the barred samples cannot be said to be significantly different from non-barred samples.
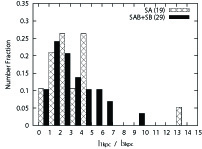
To check for any artificial effects by using samples at different distances (therefore probing different regions), figure 9 shows the same figure but only for samples within the distance range of 13 Mpc to 19 Mpc. The trend of barred galaxies having a high central concentration tail is still seen, but with (see Discussion for why the barred samples may not be observed to have higher central concentration as in previous studies). It is interesting that the central concentration in barred galaxies peak at around the same value as non-barred galaxies, but the median of the central concentration is higher for the barred galaxies. This cannot be explained by the classical picture of bars simply helping the inflow of molecular gas towards the center, because then we should expect barred galaxies to have a peak at a higher degree of central concentration.
8 Central Concentration and Hubble Type
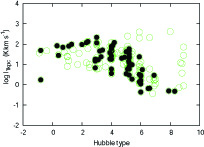
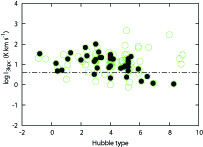
Figure 10 shows the CO intensity along the Hubble types, for different beamsizes. Molecular gas is significantly more massive in the central 1 kpc of early type galaxies (upper figure), where the large stellar bulge can be assumed to create a deep potential well. On the other hand, the lower figure of figure 10 shows CO intensity observed with the 45′′ beam, or the central 3 kpc. It is apparent that molecular gas is not as well correlated with Hubble type than the central 1 kpc. The typical detection threshold in the FCRAO sample is ( on the logscale), shown in figure 10 with the horizontal dashed line. Many of the CO intensities in the late type galaxies are close to this threshold, but a weak correlation with Hubble type is still observed.
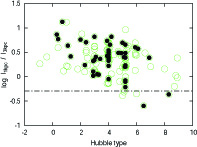
This indicates that the trend in figure 10(top) is not created by the overall low molecular gas mass in the central regions of late type galaxies, but that the gas distribution is more extended in late type galaxies. Figure 11 shows the ratio of CO intensity observed with different beamsizes, and we see that the distribution of molecular gas is a smooth function of Hubble type, in that late type galaxies have more extended gas in the center. For the earliest galaxies (Hubble type , corresponding to S0/S0a), the intensity ratio is close to 1, where virtually all the gas is confined to the central 1 kpc. For the latest types, however, falls to 0 indicating that there is no apparent central concentration of gas comparing the central 1 kpc and 3 kpc, so that the molecular gas disk is likely extended beyond the central 3 kpc. The horizontal dashed line in figure 11 is the threshold below which non-detections in the FCRAO sample increase, assuming a typical for the latest types and for the FCRAO sample. In case a bias exists in the FCRAO sample that weak latest type galaxies are not observed, the corresponding galaxies will be plotted above this line. The absence of early type galaxies with low central concentration, however, still points to the reality of this trend of lower central concetration towards later type galaxies.
9 Role of Bars within Hubble Types
The previous sections have revealed that, Hubble type can play an important role in centrally concentrating molecular gas. Bars are also known to centrally concentrate gas, although not found to be statistically significant based on our current data (see the Discussion section for possible reasons).
The main setbacks of previous studies is that they have not been able to solve the degeneracy between the effect of Hubble type and bars because of small sample size. It is of interest, therefore, which (bars or Hubble type) play the dominant role in concentrating molecular gas.
Our sample enables the categorization and comparison of different Hubble types and presence of bars, simultaneously. Figure 12 shows the CO intensity (molecular gas mass within central 1 kpc) for early and late type galaxies, respectively, each for barred and non-barred galaxies. The bottom figure shows the same figure as the top and the middle, but for barred and non-barred galaxies combined. The samples where categorized into early type (type -1 to 4.5) and late type (4.5 to 9) somewhat arbitrary, so that both samples had significant numbers of galaxies.
If bars concentrate gas into the central region regardless of Hubble type, we can expect to be higher in barred galaxies to non-barred galaxies, both in early and late types. Infact, figure 11 (top) seems to suggest that barred early type galaxies have a top-heavy molecular mass distribution compared to non-barred early types with a slightly higher mean CO intensity. This trend is not statistically siginificant, however, with . For barred and non-barred late type galaxies, is . This is not siginificant either, and it is clear from figure 12 (middle) that the apparent difference in the two distribution, results from a wider distribution of CO intensity in barred late type galaxies. Four barred late type galaxies have high molecular gas mass (). All of these are known starburst galaxies (NGC 253, IC 342, NGC 3079 and NGC 6946). Except for these four, barred galaxies in late types do not show a high gas density distribution; barred galaxies in late types apparently do not have the high gas density expected from gas angular momentum redistribution. In cases where the gas is concentrated, they have extremely concentrated gas and an associated starburst. This leads us to speculate that these high central concentration late type starbursts, may either be on the verge of evolving to early type galaxies if the starburst is strong enough (in the context of secular evolution), or just using up the molecular fuel to move its place in figure 12 (middle) to the most less massive barred late types, which also shows a distinctive tail from non-barred late types.
If the presence of a bulge and its stellar potential drives molecular gas into the central region regardless of whether they have bars, we can expect early type non-barred galaxies to have higher than late type non-barred galaxies. Infact, these two are likely to be significantly different, with . The average CO intensity in early non-barred galaxies () is more than two times larger than late non-barred galaxies (). The bulge potential seems very effective in concentrating molecular gas into the central 1 kpc. Barred early type galaxies also siginificantly differ from barred late types, with . In the same way, with the barred and non-barred galaxies combined, early type galaxies and late type galaxies are, again, significantly different (). From these analysis, it seems that the bulge potential (Hubble type) is the more effective parameter in changing in the central 1 kpc, than bars. The possibility of early type galaxies showing more massive molecular gas in the central 1 kpc only because of stronger bars than late types, is rejected.
It is also important, however, to normalize the CO intensity in the central 1 kpc with CO data in a larger area to more accurately address the central concentration of molecular gas.
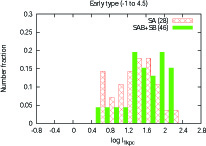
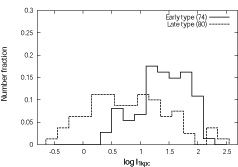
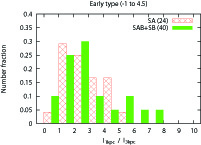
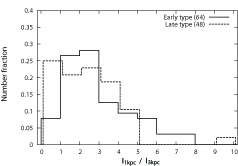
Figure 13 shows the ratio of molecular mass in the central 1 kpc to the central 3 kpc, for early and late type galaxies. The bottom figure is the same as the top and middle, but with barred and non-barred galaxies combined. The high central concentration tail (see section 8) in the distribution can be seen for early type galaxies, but not in late types (meaning, that early type galaxies constitute the high concentration tail in figure 8). The KS test shows that the probability of barred galaxies and non-barred galaxies for the early type group derived from the same parent group is . Molecular gas in barred early galaxies are not significantly more centrally concentrated than non-barred early types, but the tail of higher concentration in barred galaxies can still be seen, the median concentration being 1.6 times higher in barred early types.
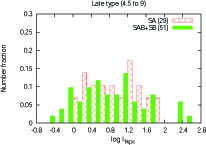
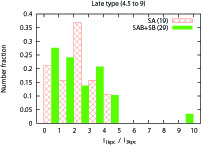
The central concentration in late type galaxies in figure 12 (middle) seem much more insensitive to the presence of bars. The tail of higher concentration that was seen in early types are not seen. The only exception of a highly centrally concentrated barred late type galaxy is NGC 3486, with practically all of the gas within its central 1 kpc. This SABc galaxy is only weakly barred, with a bar strength (ratio of maximum tangential force and average radial force) of 0.2 (Laurikainen & Salo (2002)). The central concentration of molecular gas in this galaxy is extraordinary in terms of bar and Hubble type, within the context of this paper. The KS-test for barred and non-barred galaxies in the late type group show that the two morphologies can be derived from a same distribution by probability.
Comparing non-barred early types and non-barred late types give . Similarly, barred early types and barred late types give .
From the bottom figure of 13, we see that almost all early type galaxies have a ratio of more than 1, indicating that the central 1 kpc is almost always more dense than its surrounding. Late type galaxies, on the other hand, actually peak at less than 1, meaning that many late type galaxies are less dense in the central kpc compared to its surrounding disk. Early type galaxies are more likely to be centrally concentrated than late types ().
10 Discussion
Central concentration of molecular gas from bars in early type (Sbc and earlier) galaxies had already been found by Sheth et al. (2005), where early barred galaxies showed concentration enhancement of a factor 4 compared to early non-barred galaxies. The median central concentration for our sample of early type bars (4.1) is also higher than early type non-bars (2.6), although not by a factor of 2. Our definition of central concentration employs the molecular mass in the central 45′′ for normalization whereas the Sheth et al. (2005) sample uses the global molecular mass. Since the central 45′′ ( kpc) would likely not contain all of the galaxy’s molecular gas, any trends in the central concentration would be mitigated compared with normalizations using the whole molecular content. Kuno et al. (2007), similarly, used CO maps to define the central concentration of molecular gas in a sample of 40 galaxies. They found barred galaxies are significantly () more centrally concentrated than non-barred galaxies. Therefore, our result that barred galaxies are not significantly more concentrated (), is likely to be a result of using the central 45′′ for normalization rather than the central concentration being not as strong. Errors in the measurements, which can change the derived CO intensity by factor two when comparing different telescopes, can also reduce the power of comparison with the FCRAO measurements. These sources of error apply to the whole sample, however, and the observed result that Hubble type affects the central concentration more effectively than bars, will likely not be changed.
11 Summary and Conclusions
This paper outlined a CO survey of nearby galactic centers conducted with the NRO 45m telescope. Combined with published data at similar and lower resolution, we are able to infer on the molecular gas distribution in barred and unbarred galaxies of various Hubble types. The number of galaxies used () is far more than that used in previous interferometric and single dish mapping studies. The main results of this study are;
-
1.
Molecular gas is denser in non-barred early type galaxies compared to non-barred late type galaxies. Therefore, possible stronger bars in early types cannot be the dominant reason for massive molecular gas observed in early types.
-
2.
Central concentration of molecular gas in early type galaxies is confirmed. The ratio of molecular gas in the central kiloparsec to the central 3 kiloparsecs declines smoothly with Hubble type.
-
3.
Barred early type galaxies have a higher median of central concentration than non-barred early type galaxies, suggesting a tail distribution of high central concentration in barred galaxies, although not statistically significant based on the current data. This trend is not observed in late type galaxies.
References
- Abraham & Merrifield (2000) Abraham, R. G., & Merrifield, M. R. 2000, AJ, 120, 2835
- Athanassoula (1992) Athanassoula, E. 1992, MNRAS, 259, 34
- Böker et al. (2003) Böker, T., Lisenfeld, U., & Schinnerer, E. 2003, A&A, 406, 87
- Braine et al. (1993) Braine, J., Combes, F., Casoli, F., Dupraz, C., Gerin, M., Klein, U., Wielebinski, R., & Brouillet, N. 1993, A&AS, 97, 887
- Combes et al. (1988) Combes, F., Dupraz, C., Casoli, F., & Pagani, L. 1988, A&A, 203, L9
- Combes & Gerin (1985) Combes, F., & Gerin, M. 1985, A&A, 150, 327
- Dressel & Condon (1976) Dressel, L. L., & Condon, J. J. 1976, ApJS, 31, 187
- Ferrarese et al. (1996) Ferrarese, L., et al. 1996, ApJ, 464, 568
- Helfer et al. (2003) Helfer, T. T., Thornley, M. D., Regan, M. W., Wong, T., Sheth, K., Vogel, S. N., Blitz, L., & Bock, D. C.-J. 2003, ApJS, 145, 259
- Ho et al. (1997) Ho, L. C., Filippenko, A. V., & Sargent, W. L. W. 1997, ApJS, 112, 315
- Kenney & Young (1988) Kenney, J. D., & Young, J. S. 1988, ApJS, 66, 261
- Komugi et al. (2007) Komugi, S., Kohno, K., Tosaki, T., Nakanishi, H., Onodera, S., Egusa, F., & Sofue, Y. 2007, PASJ, 59, 55
- Kuno et al. (2007) Kuno, N., et al. 2007, PASJ, 59, 117
- Laurikainen & Salo (2002) Laurikainen, E., & Salo, H. 2002, MNRAS, 337, 1118
- Laurikainen et al. (2004) Laurikainen, E., Salo, H., Buta, R., & Vasylyev, S. 2004, MNRAS, 355, 1251
- Liu & Graham (2001) Liu, M. C., & Graham, J. R. 2001, ApJ, 557, L31
- Nishiyama and Nakai (2001) Nishiyama, K., & Nakai, N. 2001, PASJ, 53, 713
- Paturel et al. (2003) Paturel, G., Petit, C., Prugniel, P., Theureau, G., Rousseau, J., Brouty, M., Dubois, P., & Cambrésy, L. 2003, A&A, 412, 45
- Pfenniger & Norman (1990) Pfenniger, D., & Norman, C. 1990, ApJ, 363, 391
- Planesas et al. (1989) Planesas, P., Gomez-Gonzalez, J., & Martin-Pintado, J. 1989, A&A, 216, 1
- Sakamoto et al. (1999) Sakamoto, K., Okumura, S. K., Ishizuki, S., & Scoville, N. Z. 1999, ApJS, 124, 403
- Sakamoto et al. (1999) Sakamoto, K., Okumura, S. K., Ishizuki, S., & Scoville, N. Z. 1999, ApJ, 525, 691
- Sheth et al. (2005) Sheth, K., Vogel, S. N., Regan, M. W., Thornley, M. D., & Teuben, P. J. 2005, ApJ, 632, 217
- Sofue et al. (2003a) Sofue, Y., Koda, J., Nakanishi, H., Onodera, S., Kohno, K., Tomita, A., & Okumura, S. K. 2003a, PASJ, 55, 1189
- Wada & Habe (1995) Wada, K., & Habe, A. 1995, MNRAS, 277, 433
- Young & Knezek (1989) Young, J. S., & Knezek, P. M. 1989, ApJ, 347, L55
- Young et al. (1995) Young, J. S., et al. 1995, ApJS, 98, 219
- Young et al. (1996) Young, J. S., Allen, L., Kenney, J. D. P., Lesser, A., & Rownd, B. 1996, AJ, 112, 1903