A high efficiency, low background detector for measuring pair-decay branches in nuclear decay
Abstract
We describe a high efficiency detector for measuring electron-positron pair transitions in nuclei. The device was built to be insensitive to gamma rays and to accommodate high overall event rates. The design was optimized for total pair kinetic energies up to about 7 MeV.
keywords:
Pair detector, Nuclear pair decaysPACS:
29.40.Mc , 23.20.Ra1 Introduction
During stellar helium burning, the “triple alpha” () reaction involving the excited state at 7.65 MeV (the so-called “Hoyle state”) in 12C converts alpha particles to 12C. Certain stellar processes are sensitive to the reaction; current models of stellar evolution require that its rate must be known to within about 5% to describe these processes accurately [1]. The reaction rate is inversely proportional to the pair branch (), of the Hoyle state, the fraction of the time that, once formed, this state decays to the ground state by the emission of an electron-positron pair. This branch is presently known with an accuracy of 9.2% [2, 3, 4] and is by far the largest uncertainty in determining the rate.
The detector described here was designed to measure to within about 5%, resulting in a determination of the rate to about 6%. The experiment is simple in principle: the 0 excited state in 12C is excited by inelastic proton scattering at a bombarding energy of 10.4 MeV. The population of the state is tagged by the observation of scattered protons detected using two Si PIN diodes placed at in the laboratory with respect to the beam direction. The choice of the scattering angle takes advantage of a resonance in the excitation function of the 12C(p,p)12C(7.65 MeV) reaction to maximize the count rate [5]. Positron-electron pairs from the decay of the 0 state are detected in coincidence with protons using an array of plastic scintillators. The ratio of the proton-pair coincidence rate to the proton singles rate then gives the branching ratio, after correction for detection efficiency, random coincidences and gamma-ray contamination. The principal difficulty of this measurement is that is extremely small, about , and hence sensitive to even small backgrounds for the e+-e- pairs. The dominant physical background is the much more probable cascade gamma decay of the Hoyle state which possesses a branching ratio of . Excitation of the state at 4.44 MeV in 12C and of states in target impurities, e.g. 28Si, are other sources of background. Additional (random) backgrounds can be produced by interactions of the proton beam with collimators, elements of the detector, and the beam stop. Further details on the experiment are given in References [1] and [6].
Section II describes the detector constructed for this purpose with special attention to features important for the reduction of backgrounds. In sections III and IV the results of GEANT4 simulations are discussed and compared with the observed performance of the detector.
2 Detector properties and construction
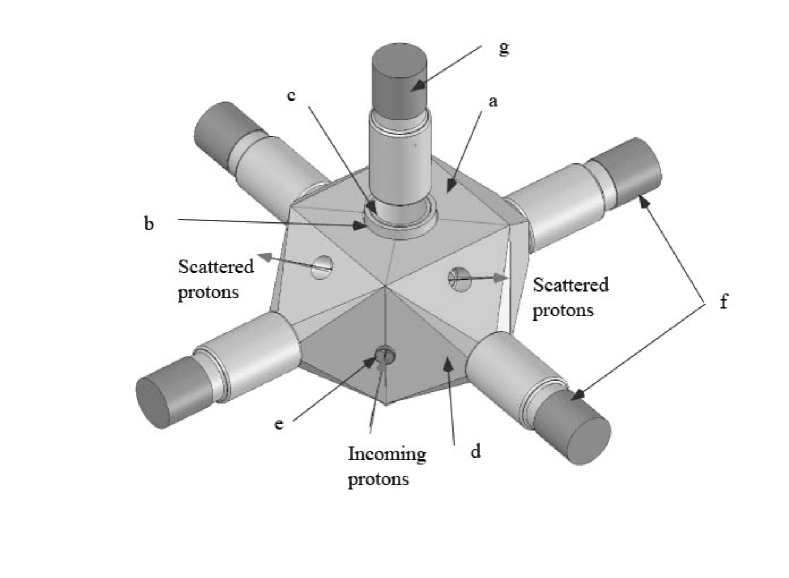
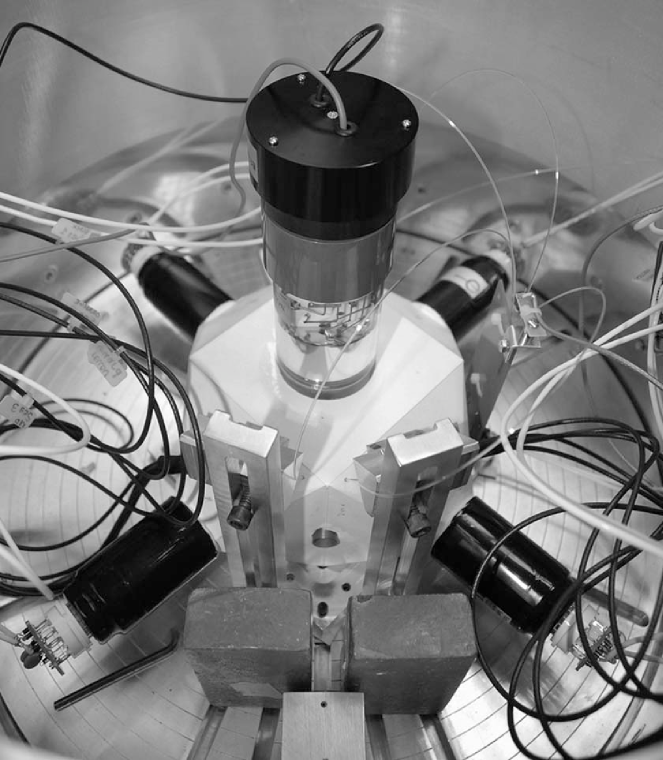
The conceptual design of the detector is shown in Figure 1. Figure 2 shows a photograph of the detector installed inside the scattering chamber. The active elements of the detector, consisting of a thin tube surrounded by a square block segmented into four quadrants, were constructed of Bicron BC404 plastic scintillator. The energies deposited by the electrons and positrons in the quadrants of the scintillator block were read out using photomultiplier tubes (PMTs) attached to each quadrant with a light guide constructed of BC800 plastic. The scintillator tube was coupled to a PMT using a flexible silicone pad. By requiring coincident events in one or more quadrants and the central tube, gamma-ray backgrounds were suppressed by the low sensitivity of the thin scintillator tube to gamma rays. In order to shield the active elements of the scintillator array from protons scattered from the target, a 2 mm thick tube of inert plastic (acrylic) surrounded the target inside of the active tube as shown in Fig. 1. Holes were bored in this central tube to allow protons in the beam, or protons that were to be detected in the silicon detectors to emerge. Table 1 summarizes the materials used in the construction of the detector.
| Object | Material | Dimensions |
|---|---|---|
| Scintillator block (a) | Bicron BC404 | 1010 cm3, |
| central hole 50 mm , | ||
| four quadrants | ||
| Scintillator tube (b) | Bicron BC404 | height 105 mm, |
| 40 mm ID, 46 mm OD, | ||
| all surfaces polished | ||
| Absorber tube (c) | Clear acrylic | height 105 mm, |
| 34 mm ID, 38 mm OD, | ||
| all surfaces polished | ||
| Light guides (d) | Bicron-800 | |
| Beam hole liner (e) | Tantalum | 11 mm ID, 12 mm OD |
| Paint | F113 Epoxy with TiO2 | about 0.25 mm thick |
| Quadrant PMTs (f) | Electron tubes 9845B | 3.2 cm photocathode |
| Tube PMT (g) | Hamamatsu R6231 | 4.6 cm photocathode |
| Si detectors | Si PIN diodes | 1 mm thick, 3 sub-sectors |
The absorber and scintillator tubes, as well as the surrounding scintillator blocks, were mounted on an aluminum base plate. The surfaces of the scintillator quadrants were covered with white epoxy paint so as to provide light insulation between the quadrants, as well as to improve light collection. The segmentation of the square block into quadrants improves the rate capability of the device by limiting pulse pile up.
The beam entrance and exit holes were lined with tantalum tubes which prevent beam particles from entering the scintillators. The beam holes were also painted with white epoxy paint before insertion of the liners so as to prevent the absorption of scintillation light by the dark liner.
The silicon detectors were 1 mm thick PIN diodes segmented into three sectors and are described in Reference [7]. The solid angle for protons is defined by two 4 mm diameter holes in the acrylic tube at in the laboratory with respect to the beam direction. These holes extend through the scintillator tube with a diameter of 12.7 mm; the holes through the adjacent quadrants have a diameter of 12.7 mm, widening to 16 mm at the light guides to prevent the exiting particles from scattering back into the scintillators. The size of the apertures was chosen to keep the kinematic spread in proton energy comparable to the intrinsic Si detector resolution. The acceptance solid angle can be further restricted by tantalum apertures placed in front of the Si detectors, so as to reduce the kinematic spread.
3 GEANT4 simulations
We have carried out Monte Carlo simulations of the scintillator detectors using the code GEANT4 [8]. The aim of the simulations is to guide the design, as well as to understand the response of the scintillators to electrons, positrons, and gamma rays. This understanding is crucial to the determination of important operational characteristics such as pair efficiency, gamma-ray efficiency, and suppression. In practice, these properties are determined from comparisons between data and simulation for isolated, well-identified transitions. For the gamma-ray cascade of the 12C(0) state, the response to the 3.21 MeV gamma ray is determined from the Monte Carlo simulation.
3.1 Elements of the GEANT4 simulation
The GEANT4 simulation includes all the active elements of the plastic scintillator detectors. These elements are modeled with a realistic detector geometry. The central, inactive tube is also included in the simulation as particles and gamma rays deposit energy in this element as well. The simulation provides the energy deposited in each volume included in the experimental geometry. Elements not included are the light guides, aspects of light collection and light attenuation, and the response of the PMTs. Experimental resolution effects are treated later in the simulation process as described below.
Electron-positron pairs from E0 transitions were simulated using the well-known energy and angular correlations given by the Born approximation [9]:
| (1) |
where and are the total energies of the electron and positron. The angular correlation between the electron and positron is given by:
| (2) |
where is the E0 anisotropy factor derived using the Born approximation (see Appendix C of Reference [10]), and is given by:
| (3) |
The response of the detector to pairs from the decay of the 12C(; 7.65 MeV) and 16O(0; 6.05 MeV) states was studied. The 0 state in 16O provides a convenient calibration signal as it has a 100% e+-e- decay branch to the 16O ground state. All particles were followed and their energy losses monitored until they either stopped, annihilated, or left the detector.

The response of the detector to 4.44 and 3.21 MeV gamma rays (the energies produced in the gamma-ray cascade decay of the 12C() level), gamma rays from radioactive 60Co and 137Cs sources, and a variety of other transitions in 28Si and 16O were simulated. In all cases, the photons were emitted from the target center and distributed isotropically throughout the entire solid angle. In the case of two-gamma-ray cascades, the photons were each emitted isotropically and the angular correlation between them was ignored. For positrons, electrons, and gamma rays the low-energy processes of GEANT4 were used to extend the validity range of the coded electro-magnetic interactions and cover the full range of experimental energies (see Chapter 12 of Reference [8]). These processes include annihilation in flight for positrons.
3.2 e+-e- response and efficiency

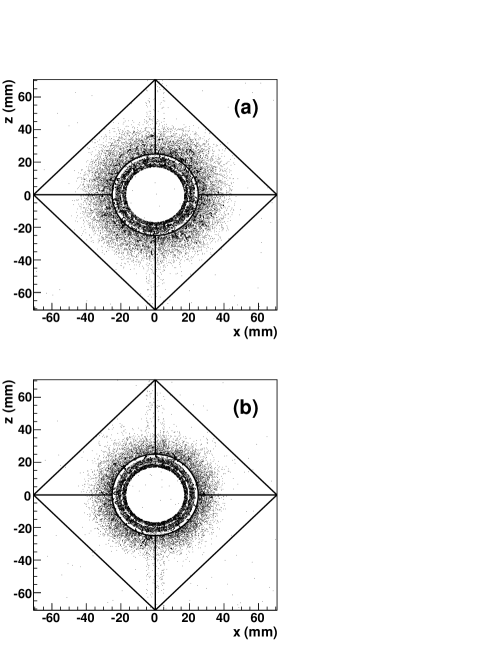
The design goals for the detector were that it be able to stop and measure the energies of the positrons and electrons produced from the 12C(0) pair decay, while remaining relatively insensitive to the gamma-ray cascade decay of that state. Figure 3 illustrates the position within the detector, where positrons or electrons from E0 transitions from the (a) 12C(0; 7.65 MeV) and (b) 16O(; 6.05 MeV) states stop. Each figure shows the results of 104 e+-e- pairs emitted at the target position in the center of the plot. Electrons and positrons stopping in the two central tubes as well as in the scintillator cube are clearly identified. On both figures the effects of the Ta liners for the beam entrance and exit can be seen (between x=5 mm).
Most of the electrons and positrons from the 7.65 MeV state in 12C which enter the quadrants, stop near the center of the detector and away from the corners where light collection presumably deteriorates. Those positrons or electrons that exit the detector without depositing their full energy mainly do so through the central hole, the beam entrance and exit holes, the empty spaces between the acrylic and the scintillator tubes or the scintillator tube and the quadrants; some particles exit the detector after depositing energy in a quadrant.
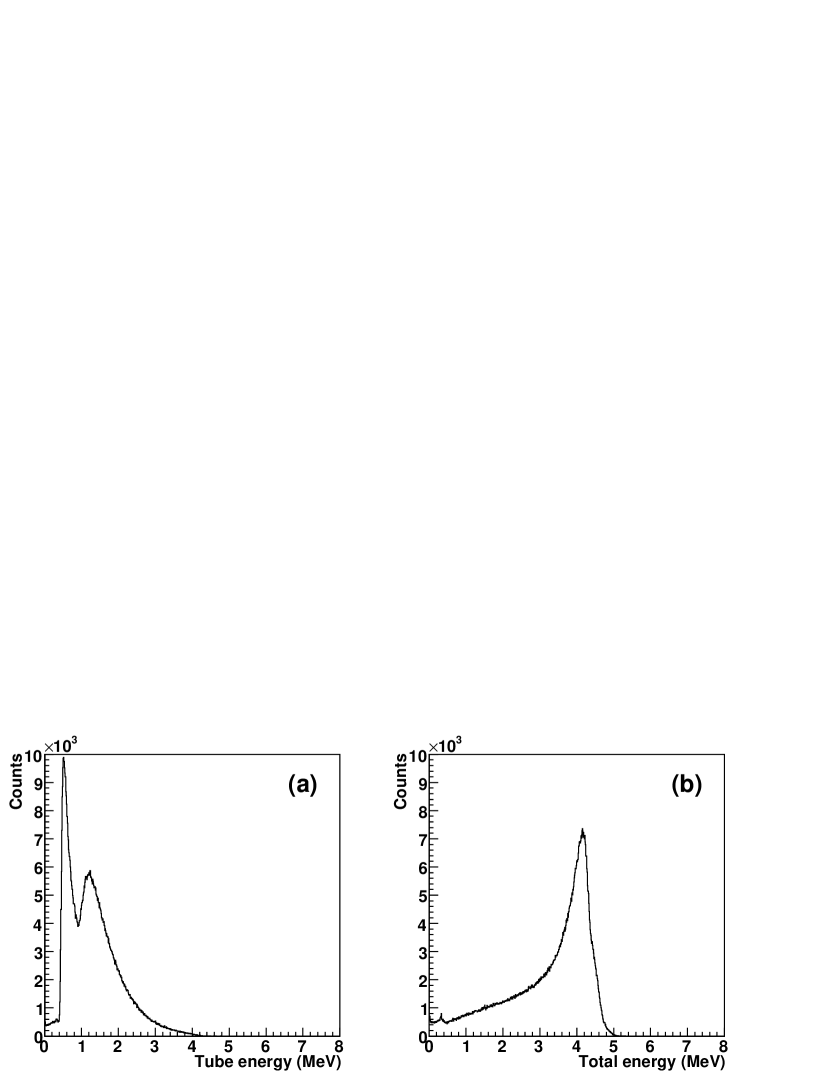
Figures 4(a) and 4(b) show the energy deposited in the active scintillator tube and the total energy deposited in all active components of the detector (i.e., the scintillator tube and the four quadrants) for simulated 16O(0) pair-decay events. The low-energy peak structure observed in Fig. 4(a) arises from events where one of the two particles never reaches the tube, either because it exited the device or was absorbed by the inert central tube. The higher energy peak corresponds to events where both particles deposit energy in the scintillator tube. In Figure 4(b), the spectrum peaks at a total deposited energy of about 4.18 MeV, showing that on average approximately 1 MeV of pair kinetic energy is lost by particles traversing the inert central tube.
To determine the simulated detection efficiency for e+-e- pairs, we make the following assumptions: for an event in which the energy deposited in the scintillator tube was greater than 0.16 MeV, and the energy deposited in at least one of the four scintillator quadrants was greater than 0.13 MeV, corresponding to the respective experimental energy thresholds, the pair was detected. Otherwise, the pair was not detected. The ratio between the number of detected pairs and total number of emitted pairs gives the simulated detection efficiency, and was 85% for the decay of the 16O(0) state, and 90% for the 12C(0) state. Since this difference is small, observation of pairs from 16O(0) provides a good baseline for an estimate of the experimental efficiency for pairs from the 12C(0) excitation, which cannot be determined directly. While the experimental detection efficiency depends on other factors in addition to the total deposited energy, such as timing, detector thresholds, etc., the difference between the efficiencies for the two pair transitions should be relatively insensitive to these detailed effects.
3.3 Response to gamma rays
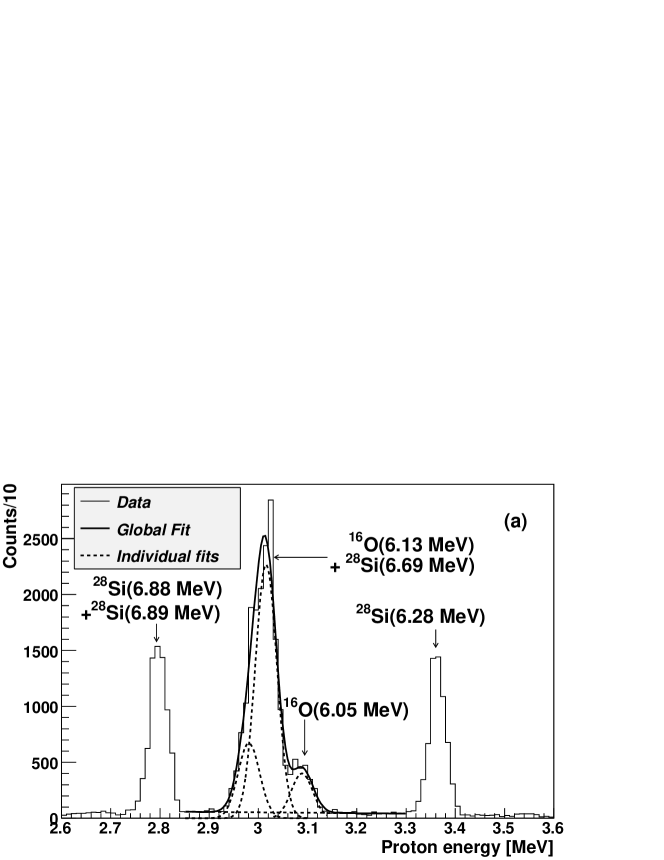
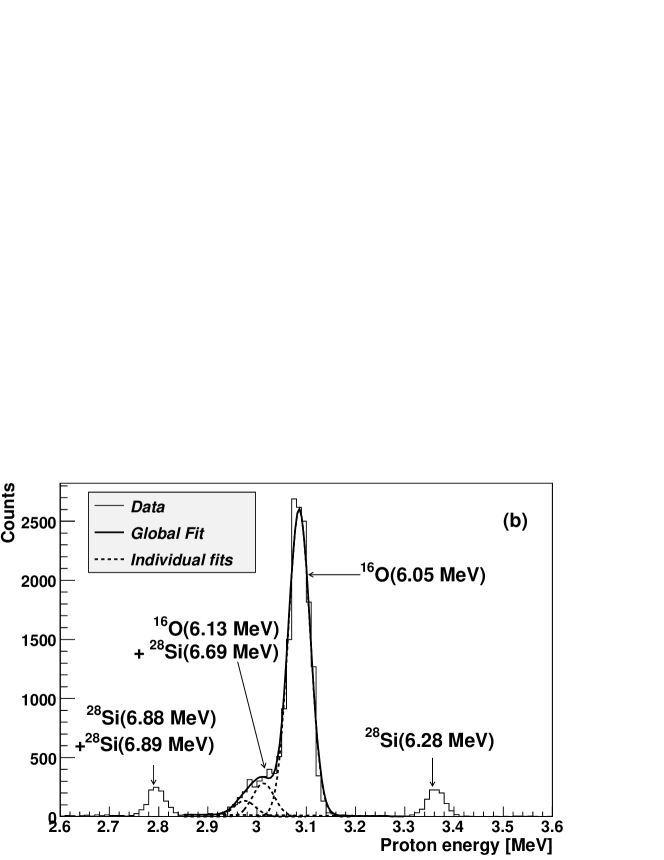
Figure 5 shows the simulated total energy deposited in the scintillator tube and all active detector elements for several gamma-ray transitions as detailed in the caption. The sensitivity of the device to the 511 keV photons is very small and therefore an additional 1.022 MeV of the single gamma-ray transition energy is lost for many pair production events. The sharp peaks 1.022 MeV below the maximum deposited energy in the total energy spectra illustrate this effect.
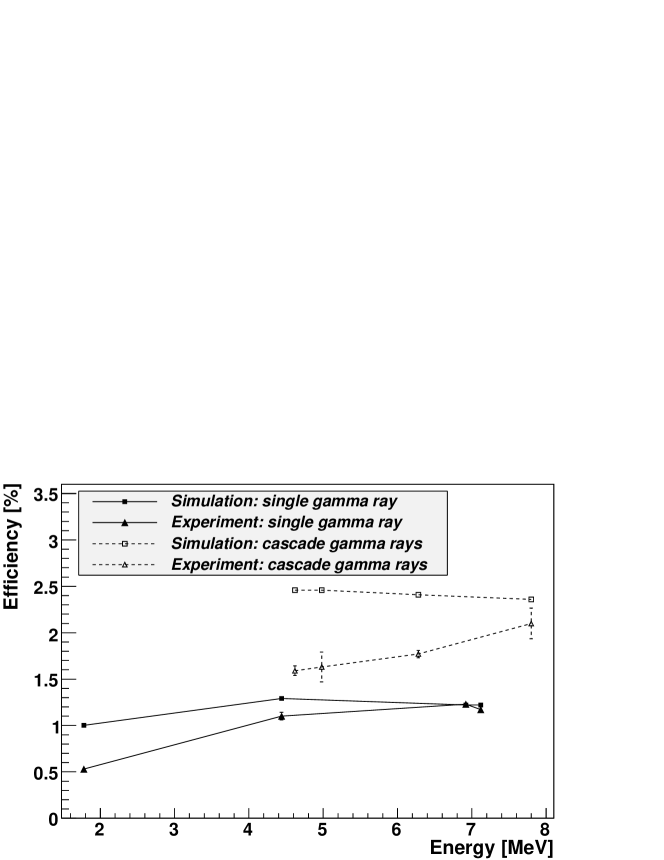
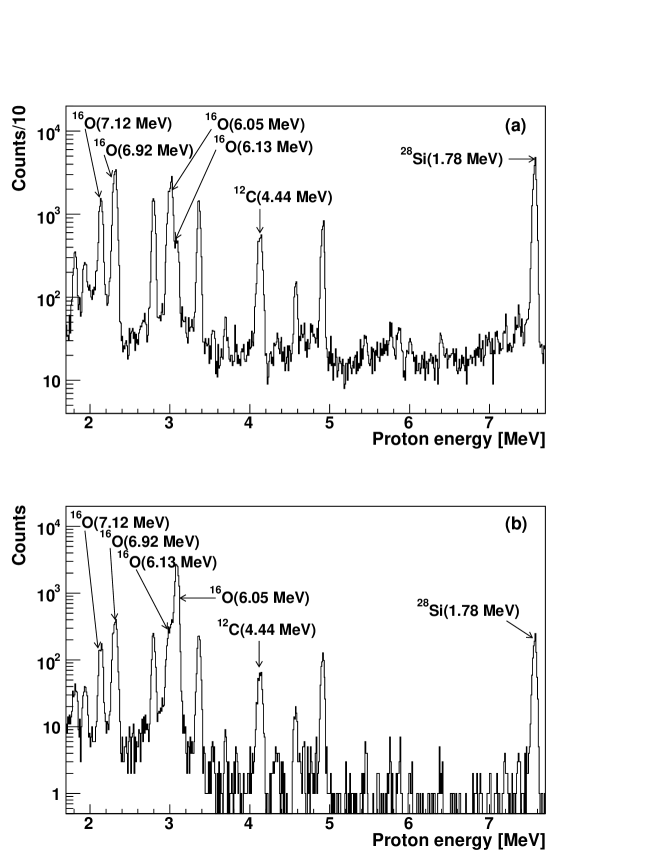
The efficiency for gamma rays estimated from these simulations was obtained in the same fashion as described above for e+-e- pairs. The simulated efficiencies for single gamma-ray and cascade gamma-ray transitions are shown in Figure 6, where they are compared to their experimental values. The experimental gamma-ray coincidence efficiency was determined by comparing proton events obtained with, and without coincident signals in the scintillator-detector array. For a given total gamma-ray energy, the efficiency for detecting at least one of the two photons in a cascade is systematically larger than that for a single photon carrying the same energy. Figure 7 shows (a) a ”singles” proton-energy spectrum from p+SiO2 collisions obtained without the requirement of a scintillator coincidence, and (b) the corresponding spectrum obtained with silicon-detector signals in coincidence with pulses in the scintillator detectors, corrected for random coincidences. Several proton-energy peaks are observed corresponding to different excitations in 16O and 28Si, as well as in 12C that was present as an impurity in the target. Clearly visible in Figure 7(b) is the relative enhancement of the peak of the pair-emitting 16O() excitation at E MeV compared to excitations that decay by gamma-ray emission. The experimental efficiency for e+-e- pairs is discussed below.
4 Comparison Between Experimental Results and Simulations
4.1 Energy calibrations
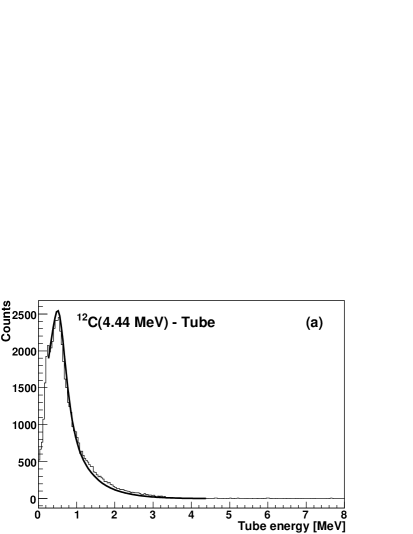
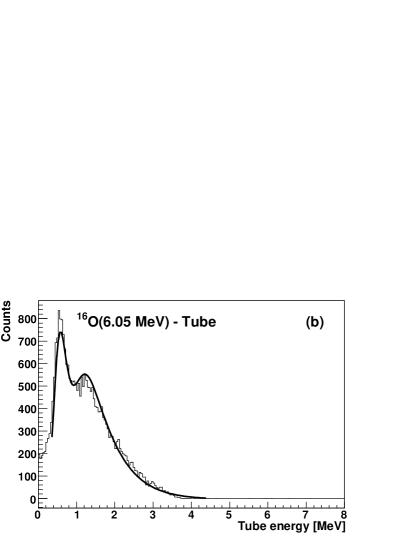
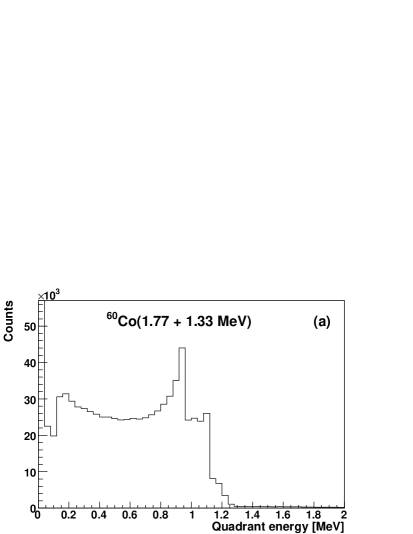
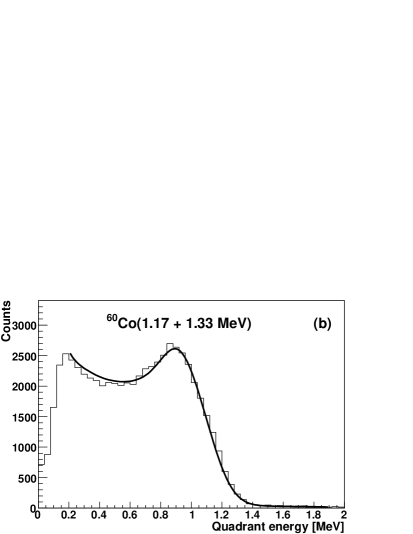
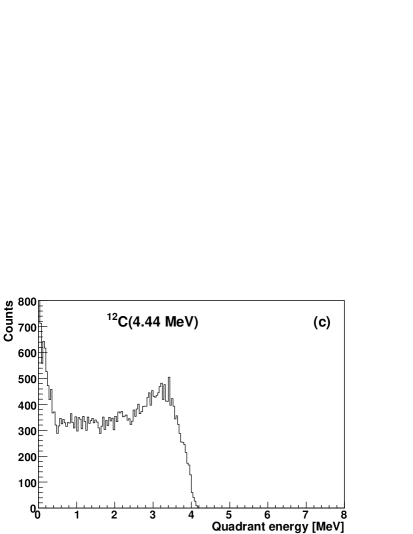
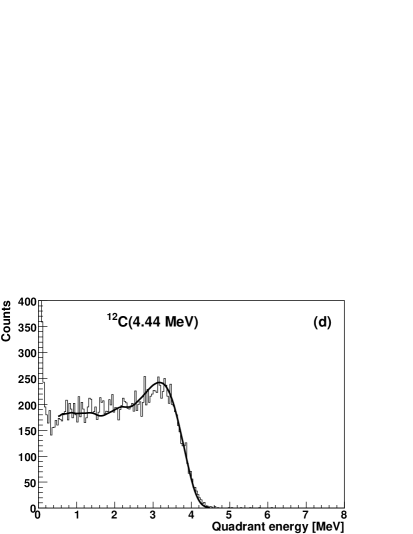
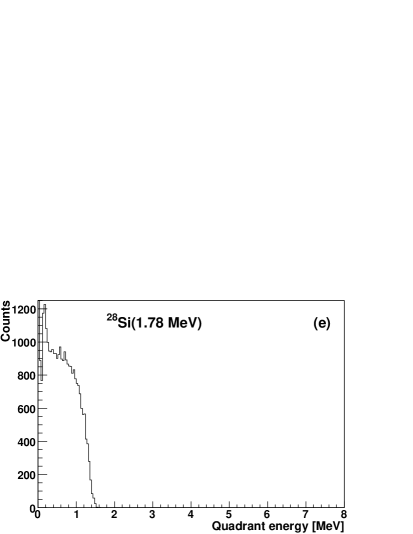
Figure 8 illustrates the method used to calibrate the tube energy. The peaks in the tube spectra near 0.5 MeV (12C(4.44 MeV)) and 1.2 MeV (16O(6.05 MeV)) are first assigned a reasonable channel number based on the corresponding uncalibrated experimental spectra. The calibration constants are then refined recursively by fitting the simulated spectra to data. Detector thresholds and an approximate detector resolution function are applied to the simulations for each detector component based on experimental data. Once the energy calibration has been determined, the best fit parameters for the resolution function used to smear the simulated data are obtained by fitting the tube spectrum for 16O(6.05 MeV). They are then fixed to fit the tube spectra for many gamma rays (we illustrate the case of 12C(4.44 MeV) on Figure 8(a)). The same method is used to determine the best fit parameters for the quadrants. This gives the following detector resolution functions: a Gaussian with an energy dependent width of for the tube spectra and for the quadrant spectra, where E is the deposited energy. The widths of the resolution functions include three terms: an energy-independent part to account for the baseline noise, a term to account for the statistical nature of light collection, and a term proportional to E to account for the variation of light collection efficiency within the detector. Figures 9(b) and 9(d) show the same two-point calibration technique applied to one quadrant using the 12C(4.44 MeV) and the 60Co(1.17+1.33 MeV) transitions. The high-energy drop-off on the quadrant spectra occurs below the Compton edge for gamma rays from 12C and 28Si due to the requirement of energy being also deposited in the scintillator tube. The simulations for 28Si(1.78 MeV) are convoluted using the same resolution function and normalized to data as shown on Figure 9(f). The results are in good agreement with the data.
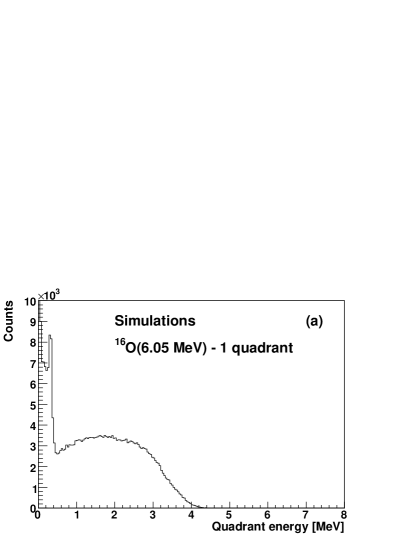
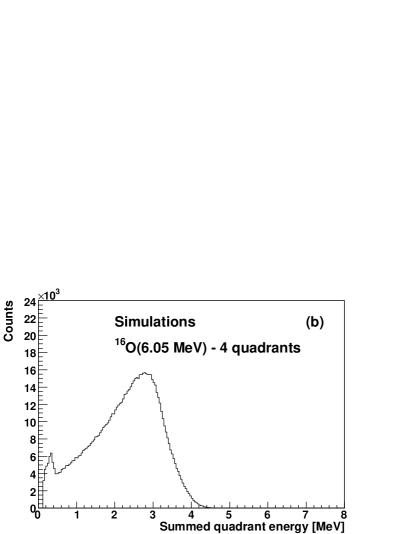
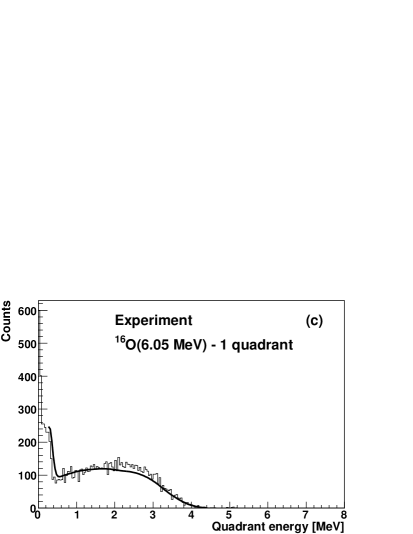
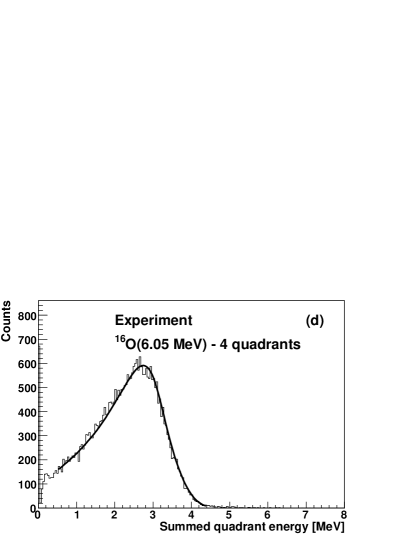
Figure 9 also shows a comparison between the simulated (unsmeared) and the random-subtracted data spectra for various gamma-ray transitions after energy calibration has been performed. Figures 10(a) and 10(b) show the unsmeared simulated spectra for energy deposited by e+-e- pairs for the decay of 16O(6.05 MeV) in one quadrant and all four quadrants, respectively. Resolution smearing is not included in Figures 9(a), 9(c), 9(e), and Figures 10(a) and 10(b); resolution smearing is, however, performed before normalization to data. Figures 10(c) and 10(d) show the corresponding experimental energy spectra normalized to the simulations. The same detector resolution function as the one used for the gamma-ray quadrant spectra has been applied to the simulated spectra before normalization; the results are in good agreement with the data.
4.2 e+-e- detection efficiency and gamma-ray suppression
The experimental efficiency of the scintillator-detector array for e+-e- pairs from the 16O() level was obtained in a manner similar to that described above for gamma rays. Fig. 11 shows proton-energy spectra in the region of the 16O() peak for (a) singles proton events and (b) random-subtracted coincidence events. A complication in the measurement arises from the nearby 3- excitation in 16O at Ep= 3.015 MeV and a 0+ excitation in 28Si at Ep= 2.99 MeV, which are not completely resolved from the 16O() peak. To extract the yield for the 16O(), the data were fit with three overlapping Gaussians. The curves in Fig. 11 show the resulting fits to the proton-energy data. In Fig. 11(a) the sum of the 3- (16O) and 0+ (28Si) peaks is dominant. With the application of the scintillator-detector coincidence the 16O() peak is strongly enhanced relative to those corresponding to excitations that decay by gamma rays. The experimental value of the pair efficiency is 65.4 1.8 %, compared to the simulated value of 85%. The systematic over-prediction of the detector efficiency is similar to that observed for various gamma-ray transitions.The difference between the observed and simulated efficiencies is attributed to effects not treated in the simulation, such as light collection in the scintillators and light guides and a realistic treatment of electronic thresholds. While these effects are not fully addressed in the simulation, the experimental efficiency may be calibrated by the 16O() pair measurement, and extrapolated to the nearby 12C() state with guidance from the Monte Carlo calculation.
5 Conclusion
The pair detector described here was used for an experiment to better determine the rate of the triple alpha experiment by improving the error bars on the internal pair emission branch of the 0 excited state in 12C. The detector performance was simulated using the GEANT4 simulation framework. The simulations helped determine the best detector geometry at the design stage and were crucial for the detector calibration and the determination of important detector efficiencies. Monte Carlo simulations combined with empirically determined detector resolution functions yielded good agreement with the experimental data.
6 Acknowledgements
We wish to acknowledge the skilled assistance of Len Morris and Doug Miller in the mechanical design and construction of the detector. This research was supported in part by the US National Science Foundation Grants PHY01-10253 and PHY02-16783, the latter funding the Joint Institute for Nuclear Astrophysics (JINA) and by US Department of Energy Grant DE-FG02-04ER41320 (WMU).
References
- [1] Austin, S. M. 2005, Nucl. Phys. A, 758, 375c
- [2] Alburger, D. E. 1960, Phys. Rev., 118, 235
- [3] Alburger D. E. 1977, Phys. Rev. C, 16, 2394
- [4] Robertson, R. G. H., Warner, R. A., and Austin, S. M. 1977, Phys. Rev. C, 15, 1072
- [5] Swint, J. B., Barnard, A. C. L., Clegg, T. B., & Weil, J. L. 1966, Nucl. Phys. 86, 119
- [6] Tur, C., Austin, S. M., Wuosmaa, A., Lighthall, J., Marley, S., Goodman, N., & Bos, J. J. 2006, Proceedings of Science, Nuclei In the Cosmos conference, PoS(NIC-IX)050 (http://pos.sissa.it)
- [7] Evensen, L., Hanneborg, A., Happ, T., Wuosmaa, A. H., and Betts, R. R . 1993, Nucl. Instr. Meth. in Phys. Res. A, 326, 136
- [8] GEANT4 Physics Reference Manual, http://geant4.web.cern.ch/geant4/
- [9] Oppenheimer, J. R. 1941, Phys. Rev. 60, 158, APS abstract number 33
- [10] Hofmann, Ch., Reinhardt, J., Greiner, W., Schlüter, P., & Soff, G. 1990, Phys. Rev. C 42, 2632