Ultradeep Near-Infrared Observations of GOODS 850-51,21,2footnotemark: 1,2
Abstract
GOODS 850-5 is a hyperluminous radio-faint submillimeter source in the GOODS-N. Although it is generally agreed that GOODS 850-5 is at a high redshift , its exact redshift is unknown. While its stellar SED suggests , its radio/FIR SED suggests a lower redshift of . To better constrain its stellar SED and redshift, we carried out nano-Jansky sensitivity ultradeep NIR observations between 1.2 and 2.1 m with the HST and the 8 m Subaru Telescope. Even with such great depths we did not detect GOODS 850-5, and the results show that it is an extremely curious source. Between the and 3.6 m bands its spectral slope is that of an ERO, and the flux ratio between the two bands is that of Lyman breaks. It is quite challenging to explain this unusually red color without a Lyman break (which would imply ). It requires a large amount () of reddened old stars at , coexisting with an even more extinguished violent –4400 yr-1 starburst, which does not have any associated detectable rest-frame UV radiation. We discuss the discrepancy between the NIR and radio/FIR photometric redshifts. We conclude that GOODS 850-5 is at least at and is more likely at . We describe the unusual properties of GOODS 850-5, including its SED and formation history, and we discuss the implications of such massive galaxies.
Subject headings:
cosmology: observations — galaxies: evolution — galaxies: formation — galaxies : starburst — infrared: galaxies — submillimeter1. Introduction
The Rayleigh-Jeans portion of the dust spectral energy distribution (SED) of IR-luminous galaxies produces a strong negative -correction and makes the observed submillimeter flux of such galaxies almost invariant at to (Blain & Longair, 1993). Thus if there are IR-luminous galaxies at high redshift, observations at submillimeter wavelengths are a powerful way to find them. However, to date, all but one of the identified submillimeter galaxies (SMGs), other than those around luminous quasars, are at redshifts lower than 4, likely because of the limited resolution of the current submillimeter instruments and the limited sensitivity of the current radio instruments, which are needed to locate the sources.
The Submillimeter Common-User Bolometer Array (SCUBA) on the single-dish James Clerk Maxwell Telescope (JCMT) resolved 20%–30% of the submillimeter extragalactic background light (EBL) into point sources brighter than mJy at 850 m (Smail, Ivison, & Blain, 1997; Barger et al., 1998; Hughes et al., 1998; Barger, Cowie, & Sanders, 1999; Eales et al., 1999). Because of the low resolution of JCMT ( at 850 m), identifications of the submillimeter sources have to assume the radio–far-infrared (FIR) correlation in local galaxies (see, e.g., Condon, 1992) and rely on radio interferometry to pinpoint the location of the submillimeter emission. Optical spectroscopy of radio identified SMGs shows that they are ultraluminous sources ( , corresponding to a star formation rate of – yr-1) peaking at –3 and that they dominate the total star formation in this redshift range (Chapman et al., 2003, 2005). However, the positive -correction of the radio synchrotron emission makes the radio wavelength insensitive to high-redshift galaxies, and radio observations can only identify 60%–70% of the blank-field submillimeter sources (Barger, Cowie, & Richards, 2000; Ivison et al., 2002). The radio unidentified SMGs are commonly thought to be at redshifts higher than the radio detection limit (typically –4) but there has been a lack of direct evidence for such a high-redshift radio-faint submillimeter population. To date, there is only one spectroscopically confirmed SMG at (Capak et al., 2008, ). Luminous radio-faint SMGs contribute to the submillimeter EBL measured by the COBE satellite (Puget et al., 1996; Fixsen et al., 1998). If most of these galaxies are indeed at high redshifts, then this implies a large amount of star formation in massive high-redshift systems.
With recent developments in submillimeter interferometry, it is now possible to directly locate submillimeter sources without relying on radio interferometers. Younger et al. (2007) observed a sample of SMGs with the Submillimeter Array (SMA). Several of their SMA detections are radio faint and consistent with being at redshifts higher than the radio identified SMGS. We have also been carrying out a program specifically targeting radio-faint submillimeter sources with the SMA. In Wang et al. (2007, hereafter W07) we reported our first identification in this program, GOODS 850-5. GOODS 850-5 was detected in our JCMT SCUBA jiggle-map survey of the Great Observatories Origins Deep Survey-North (GOODS-N, Giavalisco et al., 2004) with an 850 m flux of mJy (Wang, Cowie, & Barger, 2004). It was also detected in the combined jiggle and scan map of the GOODS-N (GN 10, see Pope et al., 2006 and references therein). It is the second brightest submillimeter source in our jiggle-map catalog of the GOODS-N and has a total IR luminosity of . It did not have a radio counterpart in the deep Very Large Array (VLA) 1.4 GHz catalogs of Richards (2000) and Biggs & Ivison (2006).
In W07, an SMA 880 m detection of GOODS 850-5 was obtained and its counterpart was found to be extremely faint in the optical and near-IR (NIR). Dannerbauer, Walter, & Morrison (2008, hereafter D08) soon followed up with new 1.25 mm and 20 cm detections of GOODS 850-5. It turns out that the correct Spitzer counterpart had already been suggested by Pope et al. (2006) but this identification was not confirmed and the high redshift of the source was not realized until the accurate position was obtained by W07. However, the exact redshift of GOODS 850-5 is unclear. Both W07 and D08 found that the NIR SED is consistent with a galaxy at , and the submillimeter and radio SED is consistent with . While both groups agree that this is a high-redshift SMG, W07 favors but D08 favors based on the radio–FIR correlation. The redshift suggested by W07 is based on a featureless power-law continuum in the IRAC bands and a non-detection in a relatively shallow band image. However, it is fair to say that this photometric redshift is not a secure one, which would require the detection of at least one prominent spectral feature. To obtain a better constraint on the redshift, we carried out ultradeep NIR imaging in the , , and bands, hoping to detect the stellar continuum at m. However, we found instead that the SED of GOODS 850-5 at 1–3 m is quite weird—it is not detected even at a 5 nJy sensitivity at 1.6 m (compared with its Jy flux at 3.6 m). Explaining this is challenging, but our analyses show that it greatly strengthens the previous W07 suggestion of .
In this paper we present our new ultradeep NIR imaging observations of GOODS 850-5 and complete analyses of the likelihood of its redshift. The new observations and data used in this paper are described in § 2. Photometric redshift analyses in the optical, NIR, FIR, and radio are described in § 3. The mass and age of the stellar population and the star formation rate of GOODS 850-5 are estimated, and the nature of this galaxy is discussed in § 4. The implications for galaxy evolution are discussed in § 5. We summarize and make some final remarks in § 6. The cosmological parameters adopted in this paper are km s-1 Mpc-1, , and .
2. New NIR Imaging and Existing Data
2.1. HST NICMOS F160W Imaging
We observed GOODS 850-5 with the Near Infrared Camera and Multi-Object Spectrometer (NICMOS) on the Hubble Space Telescope (HST) in Cycle 16. We used the NIC3 camera and the F160W filter to obtain the highest sensitivity. The observations were made in November and December 2007, containing a total of 16 HST orbits in four visits. In each orbit, we made only one exposure that is as long as possible ( minutes) in order to minimize the contribution of read noise. The exposures were dithered to provide 0.5 pixel sampling.
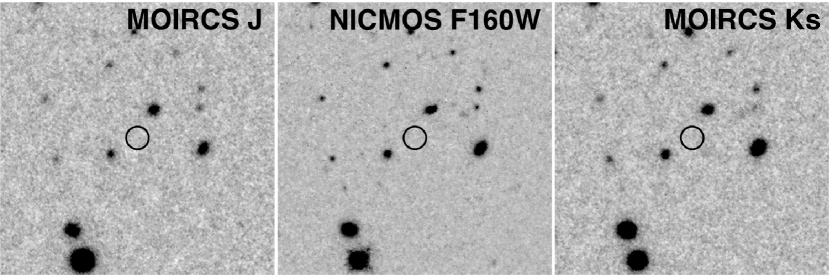
The data reduction was carried out in the Interactive Data Language (IDL) environment. We started the reduction with the standard pipeline-calibrated images provided by the HST Archive, which are flux calibrated and have instrumental singatures removed. We applied a background subtraction to each exposure by fitting the object masked image with a smooth polynomial surface. The brightest cosmic ray hits and hot pixels were removed in each image with a spatial sigma filtering. The offsets between images were determined by measuring the positions of the detected objects in the central part of the field of view. We did not attempt to correct for the optical distortion of NIC3. The 16 images were then drizzled to a common grid of per pixel (two times finer than the original pixel of NIC3) and combined to form a deep image. The absolute astrometry was matched to the GOODS-N ACS catalog (Giavalisco et al., 2004) but corrected for the offset in the ACS frame to match the radio frame (Richards, 2000). Before the images were combined, another sigma filtering was applied to drizzled pixels in the same coordinate grids to remove fainter cosmic ray hits. When the images were combined, each pixel was weighted by its exposure time and each image was inverse-weighted by the background brightness to achieve the highest S/N. The reduced image is shown in Figure 1. The final image has an extremely deep 1 sensitivity of 4.9 nJy. Surprisingly, even with such a great depth, we are not able to detect GOODS 850-5.
2.2. Subaru MOIRCS and Imaging
We obtained extremely deep and images of GOODS 850-5 with the Multi-Object InfraRed Camera and Spectrograph (MOIRCS, Ichikawa et al., 2006) on the 8 m Subaru Telescope on Mauna Kea. MOIRCS contains two 2k 2k HAWAII2 detectors, covering a field of view of with a pixel scale of . The images used here were taken in two large MOIRCS imaging campaigns in the GOODS-N led by Japanese groups and our group based in Hawaii between December 2005 and January 2008. All the band exposures and approximately half of the band exposures were made by Japanese investigators and were obtained from the Subaru public archive. Parts of the Japanese data were published in Kajisawa et al. (2006). The rest of the exposures were made by our group and will be published elsewhere. The majority of the observations were performed under photometric conditions with excellent seeing of . A very small fraction of the data has a large extinction of magnitude or poor seeing of , and they were excluded in this work.
The MOIRCS images were reduced with the IDL based SIMPLE Imaging and Mosaicking Pipeline (SIMPLE, W.-H. Wang 2008, in preparation888also see http://www.aoc.nrao.edu/whwang/idl/SIMPLE/index.htm). Images within a dither set (typically 20–30 minutes in length) were flattened using an iterative median sky flat in which a simple median sky was first derived to flat the images and then a second median sky was derived by masking all the detected objects using the flattened images. After the images were flattened, the residual sky background was subtracted with a smooth polynomial surface. The brightest cosmic ray hits were removed by a spatial sigma filtering in each flattened image. MOIRCS produces almost nearly circular fringes in roughly half of the images. The fringes were modeled in polar coordinates where they are nearly perfect straight lines and were subtracted from the images in the original Cartesian coordinates.
The package SExtractor (Bertin & Arnouts, 1996) was used to measure object positions and fluxes in each flattened, sky subtracted, and fringe removed image in a dither set. The first-order derivative of the optical distortion function was derived by measuring the offsets of each object in the dither sequence as a function of location in the images. Absolute astrometry was obtained by matching the detected objects to a reference catalog constructed with brighter and compact objects in the GOODS-N ACS catalog (matched to the radio frame) and the GOODS-N SuprimeCam catalog (Capak et al., 2004). The images were then warped directly from the raw frames to a common tangential sky plane with a sub-pixel accuracy. All projected images were weighted by their sky transparencies, exposure times, inverse background brightnesses, and pixel-to-pixel efficiencies (i.e., flat field) to obtain optimal S/N. The weighted images were then combined to form a large mosaic. When images from a dither set were combined, a sigma filter was applied to pixels that have the same sky positions to further remove fainter cosmic rays. The images were calibrated by observing various UKIRT Faint Standards (Hawarden et al., 2001) at least every half night on each detector. Data taken under nonphotometric conditions and poorly calibrated archive data were recalibrated with photometric data taken by our group.
The final mosaics have weighted exposure times (relative to median sky brightness and transparency) of 13.2 and 23.7 hours in the and bands, respectively, at the location of GOODS 850-5. The image qualities are very good, with FWHMs of at and at . The rms astrometry error between the MOIRCS source positions and the ACS/SuprimeCam reference catalog is . The reduced MOIRCS images in the region around GOODS 850-5 are shown in Figure 1. The sensitivity limits at and are both 14 nJy. As with the F160W image, GOODS 850-5 is not detected in the and images.
2.3. NIR Photometry
Although GOODS 850-5 is not detected in any of the above ultradeep NIR images, it is useful to measure its fluxes at the SMA position (J2000 = 12:36:33.45, +62:14:08.65, W07) to determine whether there is any low level flux recorded. It is also important to obtain realistic flux limits/errors in these bands for the use of photometric redshift fitting. We placed apertures with diameters that are 1.5 times the FWHMs of compact objects in the fields (, , and in , F160W, and , respectively) at the SMA position to measure the fluxes of GOODS 850-5. For each image, the background was estimated in a area around GOODS 850-5 after detected objects and GOODS 850-5 itself were masked. The measured and F160W fluxes are negative, and the flux is 0.65 . To estimate flux uncertainties, we first masked all detected objects in the images and then randomly placed the apertures in the neighborhood of GOODS 850-5. The dispersions in the random aperture fluxes are considered as flux uncertainties in these three bands. This procedure is necessary especially for the two MOIRCS bands, where the images were not drizzle combined and therefore the noise is more correlated between pixels. Such flux errors also include the uncertainties in background subtraction and confusion noise from faint undetected sources in the field. We summarize the measurements in Table 1.
| Wave Band | Flux (nJy) |
|---|---|
| MOIRCS | |
| NICMOS F160W | |
| MOIRCS |
2.4. Existing Data
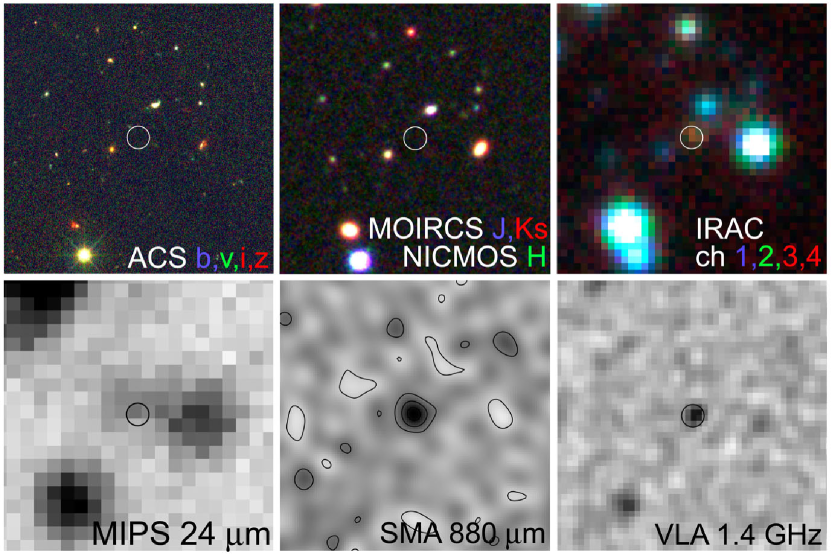
GOODS 850-5 is not detected in the GOODS-N HST ACS images but is clearly detected in the Spitzer IRAC 3.6–8 m and MIPS 24 m images (GOODS Spitzer Legacy Program, M. Dickinson et al. 2008, in preparation). Its IRAC and MIPS fluxes were first measured by Pope et al. (2006). Because GOODS 850-5 is blended with brighter nearby IRAC and MIPS sources, in W07 we remeasured the IRAC and MIPS fluxes with a PSF fitting method to better isolate its flux. In this work, we adopt the W07 results. (The flux errors in W07 and here include the uncertainties in the deblending processes.) GOODS 850-5 is not detected in the MIPS 70 m and 160 m bands (Frayer et al., 2006; Huynh et al., 2007). We adopt the 1 limits of 2 mJy at 70 m and 30 mJy at 160 m.
In the submillimeter, we adopt the SCUBA 850 m jiggle map flux of Wang et al. (2004) and the SMA 880 m flux of W07. GOODS 850-5 was detected by D08 with the IRAM Plateau de Bure Interferometer at 1.25 mm with a flux of mJy. In W07, we used the older Very Large Array (VLA) 20 cm image of Biggs & Ivison (2006, also see ), in which GOODS 850-5 has a flux of Jy999This flux was measured at the location of the SMA position, which is away from the best-fit VLA position. G. Morrison (2008, personal communication) and R. Ivison (2008, personal communication) found best-fit VLA fluxes of and Jy, respectively, from the image of Biggs & Ivison (2006).. G. Morrison et al. (in preparation) obtained a deeper VLA 20 cm image of GOODS-N. GOODS 850-5 was detected with a highly significant flux of in the new VLA image (D08). Here we adopt the latest D08 values at 1.25 mm and 20 cm. The photometry used in this work is summarized in Table 2.4. Figure 2 show the multicolor images of GOODS 850-5. Comparing to the figure shown in W07, the main difference is the new Subaru and HST NIR images and the new VLA 20 cm image.
| Wave Band | Flux (Jy) | Reference |
|---|---|---|
| ACS F435W | 2 | |
| ACS F606W | 2 | |
| ACS F775W | 2 | |
| ACS F850LP | 2 | |
| MOIRCS | 1 | |
| NICMOS F160W | 1 | |
| MOIRCS | 1 | |
| IRAC 3.6 m | 2 | |
| IRAC 4.5 m | 2 | |
| IRAC 5.8 m | 2 | |
| IRAC 8.0 m | 2 | |
| MIPS 24 m | 2 | |
| MIPS 70 m | 3 | |
| MIPS 160 m | 4 | |
| SCUBA 850 m | 5 | |
| SMA 880 m | 2 | |
| IRAM 1.25 mm | 6 | |
| VLA 20 cm | 6 |
3. SED and Redshift of GOODS 850-5
3.1. Non-detections in , F160W, and
The results of our new NIR imaging are surprising and not particularly easy to understand. GOODS 850-5 is clearly detected in the IRAC 3.6 m band at 8 . Despite the great sensitivities at F160W and , which are respectively 29 and 10 times higher than those at 3.6 m, GOODS 850-5 is not detected. This reveals an extraordinarily red SED in the NIR. The 1 flux upper limit (23 nJy) implies a flux ratio of or a spectral slope of . For comparison, objects with , corresponding to , are called “extremely red objects” (EROs, e.g., McCarthy, 2004). The spectral slope of GOODS 850-5 is more than three times that of EROs, and the m color (in AB scale) of GOODS 850-5 is higher than the color of Hu-Ridgway 10, which is a prototype dusty starburst ERO (Hu & Ridgway, 1994). High redshift UV emitting objects are commonly selected with red colors of (in the AB system) between two adjacent optical filter bands (the “Lyman-break” technique, e.g., Steidel et al. 1999; Fan et al. 2001), corresponding to . The flux ratio of GOODS 850-5 between and 3.6 m is times that of a minimal Lyman break. (A Lyman break between and 3.6 m would imply .)


The extremely red color of GOODS 850-5 sets a strong constraint on its redshift. It can be seen in Figure 3 that it is very difficult to explain the observed colors between 1.6 and 3.6 m with galaxies at even with a considerable amount of reddening. Simply based on the two colors in Figure 3, appears to be the most likely redshift for GOODS 850-5. However, we can use all the filter bands simultaneously to obtain better redshift estimates with the photometric redshift technique.
3.2. NIR Photometric Redshift
In W07 we derived photometric redshifts for GOODS 850-5 and found that galaxies at provided the best fits. Here we used our new photometric data in the NIR to improve our photometric redshift estimates. We used all the Spitzer IRAC, HST ACS and NICMOS, and Subaru MOIRCS data and the latest version of the Hyperz package (Bolzonella, Miralles, & Pelló, 2000)101010also see http://www.ast.obs-mip.fr/users/roser/hyperz/ for this calculation. In each band, we added a 5% of zeropoint error quadratically. We used zeros to replace negative fluxes in the four ACS bands and the and F160W bands, since negative fluxes are not physical. (The F775W flux is consistent with zero.) We used the non-zero flux. The photometric redshifts were derived independently with two SED template sets. The first is the latest stellar population synthesis model of Bruzual & Charlot (2003, BC03). The second contains the empirically observed galaxy spectra of Coleman, Wu, & Weedman (1980) from E to Im types and the starburst spectra of Kinney et al. (1996). Both SED sets are widely used by the optical extragalactic community for photometric redshift estimates. The combination of the latest Hyperz with the BC03 model has the nice feature of estimating ages and stellar masses of galaxies. Hyperz also limits the age of the galaxies not to exceed the age of the universe.
We adopted the standard extinction law of Calzetti et al. (2000). There is a subtlety in the maximum extinction to be allowed. Explaining the extremely red color of GOODS 850-5 between F160W/ and 3.6 m requires a strong Balmer break (rest wavelength 4000 Å) at a high redshift of (or a Lyman break at ). However, if we allow very large extinctions, this red color might be reproduced with a highly reddened low-redshift galaxy. For example, Mobasher et al. (2005) suggest that the very red color of the object HUDF-JD2 may come from a Lyman break at . On the other hand, the mid-IR (MIR) observations of Chary et al. (2007) suggest that HUDF-JD2 is at and the red color comes from an extinction of (also see Fontana et al., 2006; Dunlop, Cirasuolo, & McLure, 2007). Spectroscopically confirmed SMGs have a typical extinction of –3 (Smail et al., 2004; Swinbank et al., 2003), but the spectroscopic sample may be biased toward less reddened systems. Photometric redshift fitting to SMGs without spectroscopy generally gives –5. From these examples, seems to be a reasonable limit for high-redshift SMGs. (For heavier extinctions, the shape of the extinction curve becomes a much more important uncertainty than the value itself.) We adopted this limit for our photometric redshift analyses. Later we will show that, unlike in the case of HUDF-JD2, a redshift with a large extinction is ruled out for GOODS 850-5 by its radio and FIR SED.
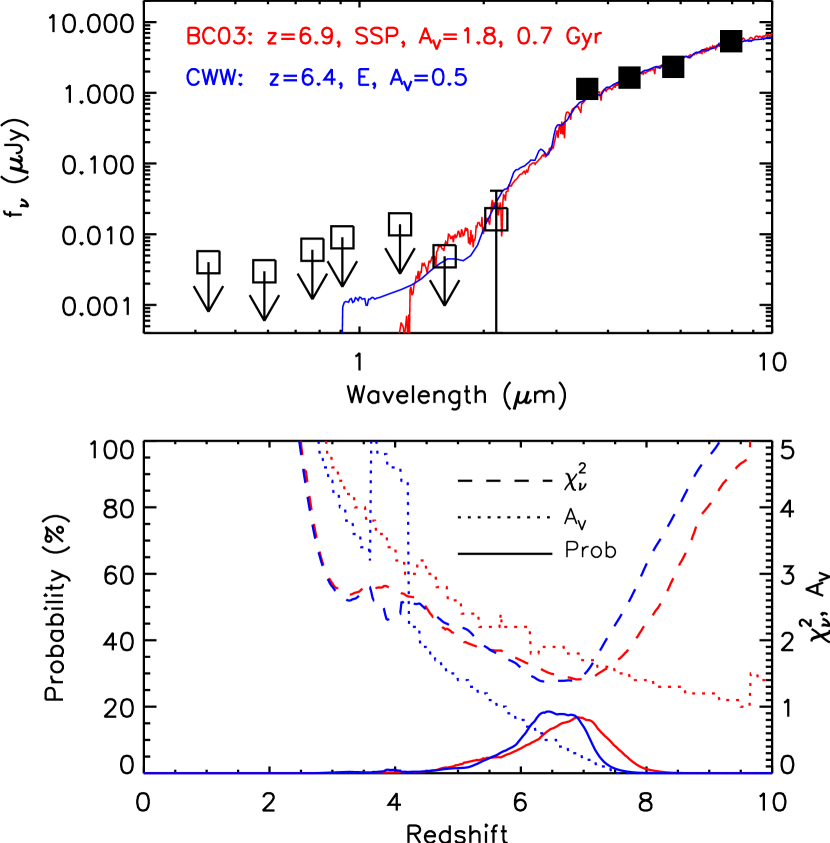
Figure 4 shows the results of our photometric redshift analyses. Both SED template sets give best fits at redshifts between 6 and 7. The BC03 best-fit is a galaxy at that formed in a single burst of star formation and has now aged 0.7 Gy with an extinction of . The empirical SED set provides a best fit at , with an elliptical type and . The BC03 set systematically gives higher extinctions at all redshifts, likely because of the limit in the galaxy age, i.e., an unreddened galaxy that is sufficiently red to fit the observed SED may be too old for the age of the universe. Nevertheless, the distributions from the two SED sets are consistent with each other. In our subsequent analyses, we adopt the BC03 result as it includes an age limit for the galaxy and provides physical quantities such as the age and stellar mass. The 68% confidence range (1 for a Gaussian distribution) from the integration of the BC03 probability function is –7.4. We note that redshifts between 4 and 5 are not entirely ruled out, although the fit is poorer here. On the other hand, is safely ruled out by the strong limits from the NICMOS and MOIRCS non-detections.
Comparing to the photometric redshift analyses in W07, the probability distribution now becomes narrower, which is an important improvement of this work. On the other hand, the minimum increases, indicating that it is generally difficult to explain the red color between 1.6 and 3.6 m. We tested photometric redshifts at and obtained nearly perfect fits at (i.e., a Lyman break between and 3.6 m). However, this high redshift cannot explain the observed SED in the FIR and radio. We do not consider in this paper.
3.3. Millimetric Redshift
We used the radio and FIR portion of the SED for another photometric redshift estimate (the millimetric redshift estimate). Because there is not a clear correlation between the radio/dust SEDs and the stellar SEDs of galaxies, this millimetric redshift estimate was carried out independently of the above NIR photometric redshift. The earliest version of such millimetric redshift estimates was carried out using the spectral index between two wavebands in the radio and submillimeter (Carilli & Yun, 1999; Barger, Cowie, & Richards, 2000; Yun & Carilli, 2002) based on the well known radio–FIR correlation in the local universe. This method has larger errors caused by the uncertainty in the dust temperature. Advanced versions utilize full SED fitting in the radio and FIR as the amount of available data increases.
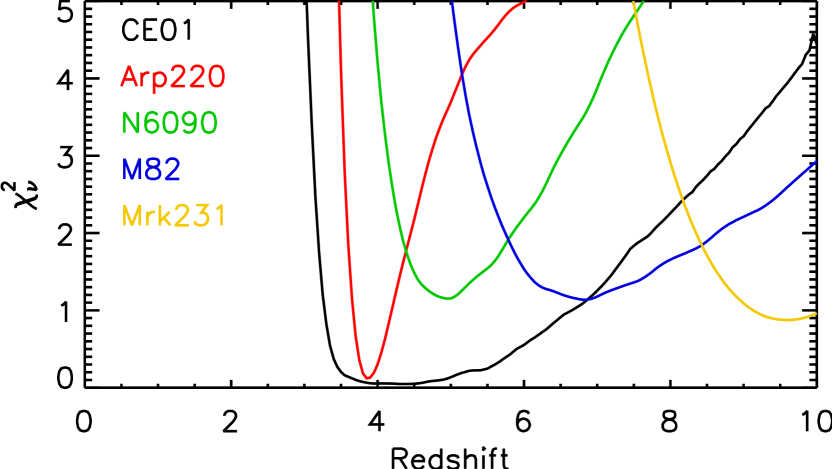
Here we used all the data listed in Table 2.4 between 24 m and 20 cm, including the two non-detections at 70 and 160 m. These two non-detections play a key role in ruling out low redshifts of but do not provide strong constraints at . We used two sets of radio and FIR SED templates. The first set contains model SEDs of Arp 220 (ultraluminous starburst with cooler dust emission), NGC 6090 (luminous starburst), M 82 (low luminosity starburst with warm dust) and M 100 (normal spiral) adopted from Silva et al. (1998), and Mrk 231 (ultraluminous dusty active galactic nucleus, AGN, with warm dust) derived from the photometry in NED111111The NASA/IPAC Extragalactic Database (NED) is operated by the Jet Propulsion Laboratory, California Institute of Technology, under contract with the National Aeronautics and Space Administration.. The second SED set includes all of the 105 SED models in Chary & Elbaz (2001, CE01).
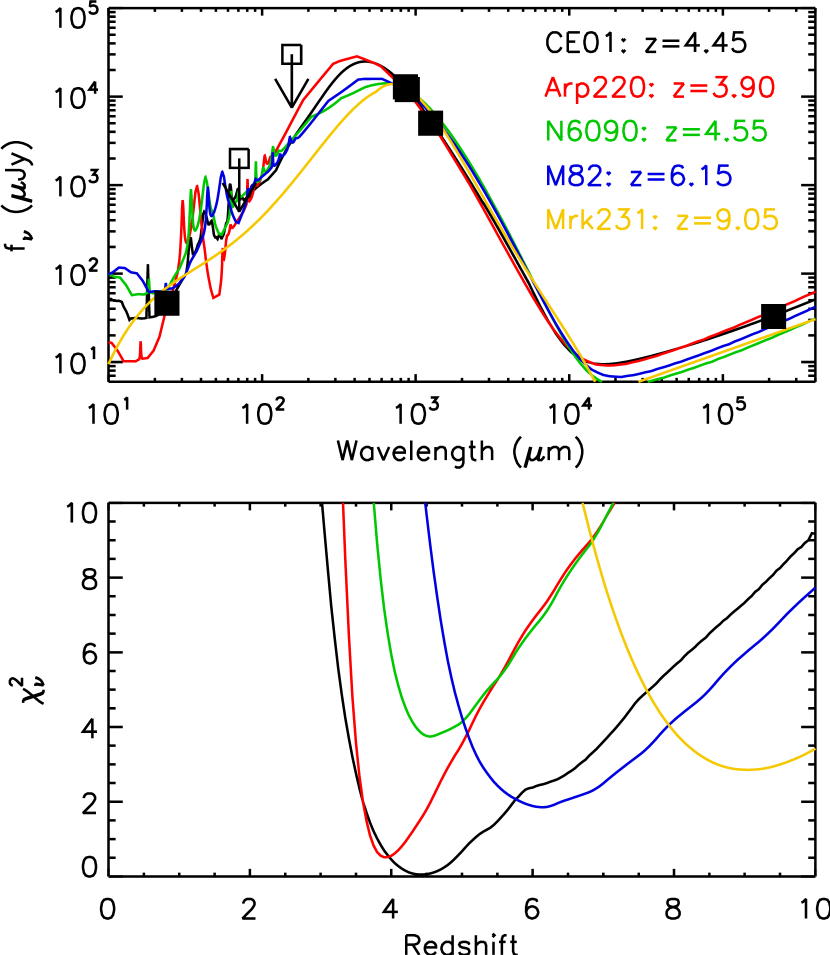
In Figure 5, we present the best-fit SEDs and the redshift distribution of for each SED template. A low redshift of is ruled out and this agrees with the NIR photometric redshift. The best-fit with the Silva et al. models comes from Arp 220 at . This is perhaps not too surprising since Arp 220 has been commonly considered as the local analogue to high-redshift SMGs. The next best fit comes from M 82. It is at and the fit is slightly poorer than that with Arp 220. The fit with the spiral template M 100 has everywhere and is not shown in the figure. The best-fit AGN template has a redshift of 9.1, which was discussed in W07. The best-fit of the CE01 templates is at and has a () lower than that from the Silva et al. models. This unreasonably low is perhaps a result of the very wide range of models (105 of them). Generally speaking, the CE01 models provide good fits in the –5.5 range. D08 used both the two-waveband spectral index method and the SED fitting method (also with the CE01 templates, but only with the 24 m, 850 m, 1.25 mm, and 20 cm bands) and obtained and respectively. Our photometric redshift results are slightly higher than those in D07, likely due to the introduction of the two upper limits at 70 and 160 m, which strongly disfavor . Nevertheless, the results here and those in D08 are still broadly consistent.
3.4. or ?
We are now faced with two different photometric redshift results. The NIR photometric redshift suggests –7, while the millimetric redshift suggests . We favor the NIR redshift of because we believe that our knowledge about the stellar photospheric emission of galaxies is more robust than that about the dust and radio emission. This is not only because the stellar spectral synthesis models (such as the Bruzual & Charlot models) and the empirical spectra (such as the Coleman, Wu, & Weedman templates) have been widely adopted and tested in numerous extragalactic studies from to , but also because of the various uncertainties in the radio/IR photometric redshift. Below we discuss each of the uncertainties.
First, the two-waveband spectral index method suffers from the uncertainty in dust temperature. Second, the stellar contamination in the 24 m band is quite uncertain at . All NIR photometric redshift models for GOODS 850-5 at predict observed 24 m stellar photospheric fluxes that are much weaker than those in the Silva et al. and CE01 models. If we decrease the stellar emission in the Silva et al. models to match the observations, all fits become better than those in Figure 5. In particular, the M 82 fit at slightly shifts to and becomes better than the Arp 220 fit at . Third, and most importantly, there is a fundamental problem in the millimetric redshift, which is the uncertainty in the radio–FIR correlation.
The radio–FIR correlation is a tight correlation observed for local galaxies (Condon, 1992), but the detailed physical mechanism of this correlation is still unclear. Several groups have attempted to measure this correlation on different samples of high-redshift galaxies with various methods, and the results remain controversial (Appleton et al., 2004; Boyle et al., 2007; Vlahakis, Eales, & Dunne, 2007). If high-redshift SMGs are brighter in the radio, as suggested by Vlahakis et al., then the redshift of GOODS 850-5 should be higher than that inferred from the local radio–FIR correlation. In addition to the uncertainties in observational determinations of the correlation, there are also physical reasons to suspect that the radio–FIR correlation at high redshift would be different than that in the local universe. For example, the higher energy density of the cosmic microwave background radiation at high redshift leads to a stronger inverse-Compton cooling for the cosmic-ray electrons (Condon, 1992), which suppresses the radio emission. If this is the dominant effect at high redshift, the correct redshift of GOODS 850-5 should be lower than that inferred from the local correlation. On the other hand, galaxies tend to have smaller sizes at high redshift. This may enhance the interstellar magnetic field and the synchrotron radiation, but the total radio emission can be further complicated by ionization and bremsstrahlung loss (Thompson et al., 2006).
Unfortunately, at least in the case of GOODS 850-5, the result of the millimetric redshift highly relies on the validity of the radio–FIR correlation. To show this, we repeated the same photometric redshift fitting but did not use the 20 cm data point. The resultant distributions are shown in Figure 6. In this experiment, all the fits have around 1.0 (the expectation value) between and . This shows that the redshift of GOODS 850-5 highly depends on its dust temperature when the radio–FIR correlation is not assumed. While it is established that many high-redshift SMGs have cool dust SEDs similar to that of Arp 220, a small number of SMGs have warmer, M 82-like SEDs (e.g., Clements et al. 2008, also see Figure 2 in W07). Because of this, we cannot rule out higher redshifts of and an M 82-like SED for GOODS 850-5.
3.5. Summary on the Redshift
A low redshift of is ruled out by both the NIR and millimetric redshifts for GOODS 850-5. The NIR photometric redshift suggests –7, but the millimetric redshift suggests . The later strongly relies on the validity of the local radio–FIR correlation. If we do not assume the local radio–FIR correlation, redshifts between 3 and 10 seem equally possible for the observed FIR SED of GOODS 850-5. We consider the NIR photometric redshift as a more likely one, but is still a possibility for GOODS 850-5.
4. Properties of GOODS 850-5
4.1. Active Galactic Nucleus?
The possibility of the existence of an AGN was discussed by W07. The lack of an X-ray counterpart in the 2 Ms Chandra image (Alexander et al., 2003) rules out a Compton-thin AGN at . An AGN with an X-ray luminosity erg s-1 at cannot be detected by Chandra and therefore is still possible. If the radio and FIR emission of GOODS 850-5 is entirely powered by a Compton-thick dusty AGN like Mrk 231, its redshift would be (§ 3.3, W07), which is less likely. Furthermore, our new observation in the NIR shows a strong spectral break around 2–3 m, which is an important feature of old stellar populations. On the other hand, QSOs typically have power-law SEDs across a wide wavelength range from the UV to the NIR and do not show strong spectral breaks like this. We conclude that there is no evidence for an AGN in any of the observations.
4.2. Stellar Population
The use of the BC03 models and the latest Hyperz allows us to estimate the stellar masses and ages. The SED of GOODS 850-5 is nearly a power law in the IRAC bands but shows a clear spectral break between 1.6 and 3.6 m. This can hardly be explained by a normal extinction curve. A spectral break in the unreddened stellar SED is required, and the most natural spectral break is the 4000 Å Balmer break, which is a signature of older stars. Hyperz agreed with this interpretation and all the best-fit models between and 10 have nearly the age of the universe. For example, at the best fit of , the age of the universe is 0.79 Gyr and the best-fit model has an age of 0.7 Gyr . The minimum age with good fits ( probability the best-fit one) is 0.5 Gyr, corresponding to a formation redshift of 10–14. Because there are no detections in the and F160W bands, the actual strength of the Balmer break in GOODS 850-5 is unknown. Therefore we do not think we can constrain its age with sufficient accuracy. Nevertheless, we can conclude that it requires a well established stellar population with an age that is significantly large compared to the cosmic time to explain the observed SED at m.
Since the observed IRAC fluxes are likely dominated by old stars with little AGN contributions, they can be used to make a measurement of the stellar masses. Figure 7 shows the Hyperz/BC03 best-fit masses as a function of redshift, and the uncertainty range. At and 6.0, the best-fit masses are 3 and , respectively. The range allowed by the photometric redshift fitting is quite narrow at . We therefore believe that the true uncertainty in the mass estimate is more likely from the stellar population model. In BC03, we can see that the mass-to-light () ratio is a strong function of initial mass function (IMF) and a weaker function of metallicity. The adopted IMF in BC03 is the Chabrier (2003) IMF, which is more top-heavy than the standard Salpeter (1955) IMF. If the IMF is Salpeter, the stellar mass of GOODS 850-5 would be approximately 2 times larger than the above values. Another important factor is the likely existence of the thermally pulsing asymptotic giant branch (TP-AGB, Maraston, 2005) phase, which is not included in the BC03 models. Such a phase decreases the ratio for a young stellar population in the rest-frame NIR. Maraston (2006) found that the inclusion of the TP-AGB stars decreases the mass by on average, compared to the BC03 models. This would decrease the stellar mass of GOODS850-5 to at , but this is still a very large mass.

4.3. IR Luminosity and Star Formation Rate
The data at m allow us to robustly determine the total IR luminosity (integrated from 8–1000 m, e.g., Sanders & Mirabel 1996). Figure 8 shows the IR luminosity of the best-fit Silva et al. (1998) models (FIR only, § 3.4 and Figure 6) as functions of redshift and SED type. We consider two redshifts here: , as suggested by the millimetric redshift estimate, and , as suggested by the NIR photometric redshift. At the best-fit model is Arp 220 and the best-fit IR luminosity is . At the best-fit model is M 82 and the luminosity is . These are all comparable to the result directly inferred from the submillimeter flux using the standard formulas (e.g., Blain et al. 2002, mJy, which is for GOODS 850-5).

The star formation rate for GOODS 850-5 can be estimated with the relation (e.g., Kennicutt, 1998). The results are 2400 yr-1 for and 4400 yr-1 for . This assumes the standard Salpeter IMF.
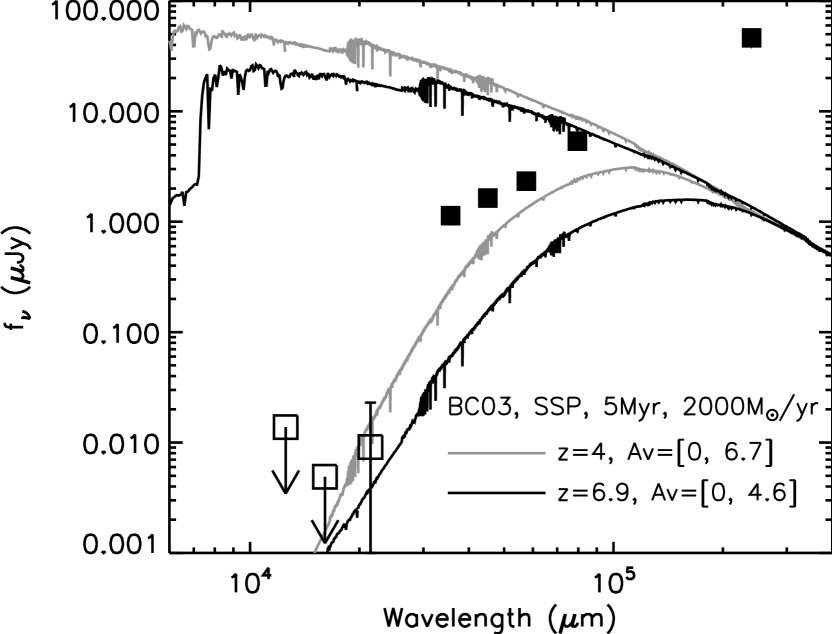
It is interesting to compare the above star formation rates with the non-detections in the NIR. Using the UV luminosity versus star formation rate conversion in Kennicutt (1998), (erg s-1 Hz-1), and a minimum IR star formation rate of 2000 yr-1, we found an unattenuated UV (1500–2800 Å) luminosity of erg s-1 Hz-1. At –6.9, this corresponds to approximately 40–20 Jy at 1.6 to 2.1 m, assuming a young burst SED from BC03. The observed F160W and flux upper limits then imply the extinctions for the starburst component to be at least –4.6. Figure 9 shows the SEDs of such hidden starbursts at and 6.9. The lower limits for the extinctions of the starburst component are significantly higher than those derived from the optical/NIR SED. We will come back to this in § 4.5.
4.4. Nature of the 24 m Emission
All the above discussions on the existence of an AGN, the stellar mass, and the IR luminosity depend (to various degrees) on whether the observed 24 m emission is dominated by emission from stellar photosphere or from dust (see the extensive discussion on the 24 m emission from HUDF-JD2 in Mobasher et al., 2005). Roughly speaking, the observed 24 m flux of GOODS 850-5 is unlikely to be dominated by stellar emission, as this would require at to explain the observed red 24-to-8.0 m color without dust emission. If we include the 24 m band in the optical/NIR photometric redshift analyses, the fit becomes poor at all redshifts.
We can quantify the strength of stellar radiation at 24 m using photometric redshift fits without including the 24 m data. The best-fit BC03 models in § 3.2 imply 24 m stellar emission of 4.6 and 2.9 Jy at and 6.9, respectively, corresponding to 10% and 6% of the observed 24 m flux. These seem unusually small, especially at , where 24 m corresponds to rest-frame 3 m. We can compare these with local templates in Silva et al. (1998) to see if they make any sense. Table 3 compares the ratios of and the ratios of dust-to-stellar radiation at 24 m for Arp 220, NGC 6090, M 82, and GOODS 850-5, at and . We found that once the dust-to-star ratios in the observed 24 m emission is normalized by the ratios, GOODS 850-5 is not different from local galaxies. It is also interesting to note that at and 6.9 the normalized dust-to-star ratios are similar to Arp 220 and M 82, respectively. This is consistent with what we found in the photometric redshift analyses: GOODS 850-5 is similar to Arp 220 if it is at but more similar to M 82 if .
| Galaxy | ||||
|---|---|---|---|---|
| 4 | ||||
| Arp 220 | 14 | 4.8 | 0.34 | |
| NGC 6090 | 1.5 | 1.6 | 1.1 | |
| M 82 | 0.2 | 2.7 | 13 | |
| GOODS 850-5 | 46 | 15 | 0.33 | |
| 6.9 | ||||
| Arp 220 | 14 | 0.08 | 0.0057 | |
| NGC 6090 | 1.5 | 0.07 | 0.047 | |
| M 82 | 0.2 | 0.08 | 0.40 | |
| GOODS 850-5 | 52 | 9.1 | 0.18 |
Note. — is in solar unit. .
There are two subtle issues in the above comparison. First, the underlying assumption for the normalization is that the ratios are similar for the galaxies at 24 m (rest-frame 3.0–4.8 m for the redshifts of interest). Given the long wavelengths, this is acceptable. Second, the estimates of the IR luminosity for GOODS 850-5 slightly depends on how much of the observed 24 m emission comes from the warmer dust components. However, from Figure 8 we can see that the uncertainty is well within a factor of 2 and the IR luminosity is mostly determined by the three measurements in the millimeter and submillimeter. Therefore the 24 m measurement can still be considered as a semi-independent check for all the analyses in longer and shorter wavelengths. The fact that the extrapolations of the optical/NIR photometric redshift analyses agree well with the millimetric one at 24 m (in terms of dust-to-star ratio) does show an excellent self consistency. It is fair to conclude that the unusually large dust-to-star ratio in the observed 24 m emission of GOODS 850-5 is simply a consequence of its extremely large IR luminosity.
Two question arises once we establish that of the observed 24 m emission comes from dust: (1) Does this affect our millimetric redshift analyses? (2) Does the dust emission extend to the IRAC bands and bias our stellar mass estimates? To examine (1), we decreased the stellar contribution in the Silva et al. templates by factors of 2 to a few tens and repeated the photometric redshift fitting. We found that the fits improve slightly. The best-fit redshift with Arp 220 does not change significantly and the best-fit redshift with M 82 decreases from –7 to –6. Thus, the general conclusions on the millimetric redshift and the IR luminosity are both fairly insensitive to the assumed stellar contribution to the 24 m flux.
The answer to (2) is negative as well. The dust spectral slope for starbursts is extremely steep at m (IRAC bands for ), and the blue end of the dust emission does not contaminate the IRAC fluxes. This is still true even if the observed 24 m emission comes from a dusty AGN with dust much warmer than starbursts. Mobasher et al. (2005) compared the observed 24 m emission from HUDF-JD2 with dusty AGN templates Mrk 231 and NGC 1068. We follow the procedure in Mobasher et al. and compare the SEDs of GOODS 850-5 and NGC 1068. We found that the dust emission only contributes to the IRAC fluxes at . At , similar to what Mobasher et al. concluded for HUDF-JD2 at , the dusty AGN does not bias the IRAC stellar mass estimates. We do not consider Mrk 231 here as its SED in the literature is contaminated by stellar emission at rest-frame m (as pointed out by Mobasher et al.) and hence it does not provide a definite answer. Moreover, as shown in our photometric redshift analyses, to explain the large millimeter fluxes of GOODS 850-5 with a Mrk 231-like warm dust, it would require unlikely high redshifts of –10. In short, we conclude that the dust emission at 24 m is unlikely to bias our IRAC-based stellar mass estimates regardless of the existence of a dusty AGN.
4.5. Coexistence of Old Stars and a Starburst
The properties of GOODS 850-5 are puzzling. There appear to be two inconsistencies that are related to each other. (1) While the IR luminosity implies an intensive ongoing starburst and the formation of a young galaxy, the NIR SED suggests that most of the observed stellar radiation comes from old stars without any detectable rest-frame UV radiation. (2) Our interpretation of the NIR SED suggests , but is required to hide all the young stars.
One conceivable way to solve this is to see if with young stellar populations could provide reasonably good fits in the photometric redshift. If yes, we may argue that the entire young galaxy is behind an dust screen and that the observed IRAC fluxes indeed mostly come from young stars. To investigate this possibility, we limited the photometric redshift fitting to the BC03 models with –10, , and ongoing star formation. At , fits with such highly extinguished stellar populations all have , which is significantly poorer than the fits with . At , the becomes larger than 5 and the models fail to fit the data. We conclude that for a young galaxy is a less likely case, although not fully ruled out for . It is more likely that the observed IRAC fluxes mostly come from a relatively old stellar population with a moderate extinction of .
Another possible and indeed sensible scenario to explain the above inconsistencies is that the star forming region (with ) in GOODS 850-5 is different from the region that produces most of the observed IRAC fluxes (). GOODS 850-5 is not resolved by the SMA ( beam FWHM, S/N=8.6) and by the VLA (, S/N=8.2). These imply an uncertainty of (beam FWHM divided by S/N) for its beam-convolved size and for the upper limit of its intrinsic size. The upper limit corresponds to kpc at and is consistent with the CO sizes of low-redshift SMGs (Tacconi et al., 2006). On the other hand, the IRAC fluxes suggest a massive stellar population of , which may be spatially offset from the starburst region and may have less extinction.
An interesting object for comparison is the prototypical dusty starburst ERO, Hu-Ridgway 10. Stern et al. (2006) found that its 10 m silicate feature implies but its optical/NIR SED implies a much smaller . They ascribed this to a heavily obscured starburst in Hu-Ridgway 10, similar to our hypothesis for GOODS 850-5. Unfortunately, the current data of GOODS 850-5 do not allow us to use the silicate feature for an extinction measurement. Another possibility to test the above two-component hypothesis for GOODS 850-5 is to see if we can fit the observed NIR SED with two components. We found that the photometric redshift fitting becomes poorer at all redshifts if we include hidden bursts shown in Figure 9. The increase in is from at to at . However, we note that the actual extinction for the starburst component can be higher than the minimally hidden burst shown in Figure 9. Once we increase the extinction for the burst component by –3 (still less than the extinction in Hu-Ridgway 10), the photometric redshifts reduce to the ones shown in § 3.2 at all redshifts. In other words, the current data are insufficient for further testing the two-component hypothesis.
We conclude that a massive galaxy with an old stellar population but with some dust screening hosting a much more dusty nuclear starburst can explain the observations of GOODS 850-5.
5. Discussion
For the stellar masses and star formation rates estimated at and 6.9, the mass build-up times are both Myr, respectively corresponding to 7% and 14% of their cosmic times. It is clearly more difficult to produce the stellar mass for the case, since there is less time available for the formation of the galaxy. Given that all the stars we see are old, it requires an intensive but short burst of yr-1 at . This also suggests that GOODS 850-5 has undergone two distinct bursts of star formation: one produced the old stars observed in the IRAC bands, and the other is producing the observed dust emission in the MIPS and (sub)millimeter bands.
The estimated mass of is similar to typical SMGs at (e.g., Smail et al., 2004; Dye et al., 2008) but is more massive than other galaxies observed at . The most massive Lyman-break (UV luminous) selected galaxies at –7 have stellar masses of – (Labbé et al., 2006; Yan et al., 2006; Eyles et al., 2007). GOODS 850-5 is 10 times more massive than these optically selected galaxies, suggesting that the very massive galaxies at these redshifts may be still in dusty starbursting phases and therefore may be missed by deep optical surveys.
We can estimate the limit for the number of massive, dust-hidden galaxies at . The photometric redshift uncertainty range for GOODS 850-5 is –7.4 and our GOODS-N SCUBA survey area for sources brighter than GOODS 850-5 is arcmin2. Therefore the comoving volume of our survey for sources similar to GOODS 850-5 is Mpc3. This implies a number density of Mpc-3 for massive objects of . It is unclear how a radio-faint submillimeter selection is related to stellar masses. However, the above density is probably a lower limit, since GOODS 850-5 is the first radio-faint SMG studied in our SMA survey and the survey is not yet complete. This lower limit is slightly larger than the maximum value suggested by Yan et al. (2006, see their Figure 11) for optically selected galaxies at , and is significantly larger than the values from the CDM hydrodynamic simulations of Nagamine et al. (2004) and Night et al. (2006). This emphasizes the importance of dusty galaxies at high redshift, but we clearly need a much larger high-redshift SMG sample to reach cosmologically meaningful conclusions.
It is interesting to ask whether current CDM models can produce galaxies at all at . In standard CDM models, massive galaxies form in later cosmic times (aka. “hierarchical” galaxy formation). On the other hand, evidence of “cosmic downsizing” (Cowie et al., 1996) has been observed at many different wavelengths over a broad range of redshifts, and this has been considered by some as anti-hierarchical. The existence of ultraluminous SMGs at once put a strain on the CDM models (Baugh et al., 2005). Moreover, the stacking detection of a population of faint SMGs at low redshifts of , which dominates the submillimeter EBL, further demonstrated the downsizing behavior in the SMG population from to (Wang, Cowie, & Barger, 2006; Serjeant et al., 2008). Recent semi-analytic and hydrodynamic models are able to reproduce galaxies with up to –6 under the CDM framework (Bower et al., 2006; Night et al., 2006).
At slightly higher redshifts of –7, the CDM N-body simulations of Lukić et al. (2007) provide a halo density of (Mpc/h)-3 for the mass range of –. The density rapidly drops to – (Mpc/h)-3 for the mass range of –. If we assume a matter-to-star mass ratio of , the density of Mpc-3 that we derived for high-redshift SMGs seems to match the upper bound in the simulations. This suggests that it is plausible to find approximately one dark halo in our survey area that is massive enough to host a hyperluminous SMG. However, whether the simulations can reproduce the observed intensive starburst and the large stellar mass within such a halo in a short cosmic time remains to be seen.
Lastly, can objects like GOODS 850-5 play a role in the reionization of the universe? The latest 5 yr WMAP result (Dunkley et al., 2008) implies a reionization redshift of (for instantaneous reionization) and the massive old stellar population in GOODS 850-5 implies intensive star formation at . We use the standard formulation in Madau, Haardt, & Rees (1999), yr-1 Mpc-3, where is the minimum star formation rate density required for reionization, is the escaping fraction of ionizing photons, and a Salpeter IMF is assumed. With the number density estimated above, , and assuming that the initial burst in GOODS 850-5 is as intensive as the current one, we found that the formation of GOODS 850-5 at contributed to the ionizing photons that are required for reioinization. The fraction would be even smaller if the initial burst of GOODS 850-5 were dusty (i.e., a smaller ). This is consistent with the current picture that the universe is ionized by a large amount of low luminosity objects.
6. Summary and Final Remarks
Our new ultradeep NIR observations reveal many unusual properties of GOODS 850-5. It is detected by the SMA, IRAM, and VLA from the submillimeter to centimeter wavelengths, and by Spitzer between 3.6 and 24 m, all with high significance. On the other hand, it is not detected in the , F160W, and bands even with the nano-Jansky sensitivities. We analyzed the photometric redshifts of GOODS 850-5. The NIR photometric redshift suggests a high redshift of and rules out . The millimetric redshift also rules out and suggests if we assume the local radio–FIR correlation. Without this assumption, to 10 is equally possible for the observed IR SED. We conclude that is more likely for GOODS 850-5 but remains a possibility.
To explain the observed NIR SED of GOODS 850-5 and the IR luminosity requires an established stellar population that formed at a large look-back time coexisting with an intensive ongoing starburst that is completely invisible in the rest-frame UV. The old stars observed in the IRAC bands have a large mass of and are times more massive than optically selected massive galaxies at . The current burst of star formation seems to be compact with a total IR luminosity of 1.4– and a star formation rate of 2400–4400 yr-1. It is deeply enshrouded by an dust screen so its UV radiation is not detected by NICMOS at 1.6 m and by Subaru at 2.1 m. This large extinction required for the starburst component also makes it difficult to directly confirm its existence in the IRAC bands and the two-population hypothesis remains to be tested.
The high redshift of GOODS 850-5, if confirmed, will have important implications for galaxy formation and evolution, as discussed in this paper and in W07. Its extreme faintness at m prevents any optical and NIR spectroscopy with current space and ground-based instruments. A precise measurement of its redshift will most likely come from millimeter “redshift machines” on large telescopes such as the 110 m Green Bank Telescope. Spectroscopy in the MIR and FIR with the Herschel Space Observatory is another possibility. In general, the observations of GOODS 850-5 remind us that there is a class of unexpected objects that are not included in the traditional picture of radio identified SMGs. The SMA is likely to reveal more examples in the near future. Studies of cosmologically large samples of such high-redshift SMGs, however, will require combinations of next-generation instruments, such as the Expanded VLA, Atacama Large Millimeter/Submillimeter Array, James Webb Space Telescope, and large bolometer arrays on single-dish millimeter telescopes.
References
- Alexander et al. (2003) Alexander, D. M. et al. 2003, AJ, 126, 539
- Appleton et al. (2004) Appleton, P. N., et al. 2004, ApJS, 154, 147
- Barger et al. (1998) Barger, A. J., Cowie, L. L., Sanders, D. B., Fulton, E., Taniguchi, Y., Sato, Y., Kawara, K., & Okuda, H. 1998, Nature, 394, 248
- Barger, Cowie, & Sanders (1999) Barger, A. J., Cowie, L. L., & Sanders, D. B. 1999, ApJ, 518, L5
- Barger, Cowie, & Richards (2000) Barger, A. J., Cowie, L. L., & Richards, E. A. 2000, AJ, 119, 2092
- Baugh et al. (2005) Baugh, C. M., Lacey, C. G., Frenk, C. S., Granato, G. L., Silva, L., Bressan, A., Benson, A. J., Cole, S. 2005, MNRAS, 356, 1191
- Bertin & Arnouts (1996) Bertin, E. & Arnouts, S. 1996, A&AS, 117, 393
- Biggs & Ivison (2006) Biggs, A. D. & Ivison, R. J. 2006, MNRAS, 371, 963
- Blain & Longair (1993) Blain, A. W. & Longair, M. S. 1993, MNRAS, 264, 509
- Blain et al. (2002) Blain, A. W., Smail, I., Ivison, R. J., Kneib, J.-P., & Frayer, D. T. 2002, Phys. Rep., 369, 111
- Bolzonella, Miralles, & Pelló (2000) Bolzonella, M., Miralles, J.-M., & Pelló, R. 2000, A&A, 363, 476
- Bower et al. (2006) Bower, R. G., Benson, A. J., Malbon, J. C., Helly, J. C., Frenk, C. S., Baugh, C. M., Cole, S., Lacey, C. G. 2006, MNRAS, 370, 645
- Boyle et al. (2007) Boyle, B. J., Cornwell, T. J., Middelberg, E., Norris, R. P., Appleton, P. N., & Smail, I. 2007, MNRAS, 376, 1182
- Bruzual & Charlot (2003) Bruzual, G., & Charlot, S. 2003, MNRAS, 344, 1000 (BC03)
- Calzetti et al. (2000) Calzetti, D., Armus, L., Bohlin, R. C., Kinney, A. L., Koornneef, J., & Storchi-Bergmann, T. 2000, ApJ, 533, 682
- Capak et al. (2004) Capak, P., et al. 2004, AJ, 127, 180
- Capak et al. (2008) Capak, P., et al. 2008, ApJ, 681, L53
- Carilli & Yun (1999) Carilli, C. L. & Yun, M. S. 1999, ApJ, 513, L13
- Chabrier (2003) Chabrier, G. 2003, PASP, 115, 763
- Chapman et al. (2003) Chapman, S. C., et al. 2003, ApJ, 587, 57
- Chapman et al. (2005) Chapman, S. C., Blain, A. W., Smail, I., & Ivison, R. J. 2005, ApJ, 622, 772
- Chary & Elbaz (2001) Chary, R. & Elbaz, D. 2001, ApJ, 556, 562
- Chary et al. (2007) Chary, R.-R., Teplitz, H. I., Dickinson, M. E., Koo, D. C., Le Floc’h, E., Marcillac, D., Papovich, C., & Stern, D. 2007, ApJ, 665, 257
- Clements et al. (2008) Clements, D. L., et al. 2008, MNRAS, 387, 247
- Coleman, Wu, & Weedman (1980) Coleman, G. D., Wu, C.-C., & Weedman, D. W. 1980, ApJS, 43, 393
- Condon (1992) Condon, J. J. 1992, ARA&A, 30, 575
- Cowie et al. (1996) Cowie, L. L., Songaila, A., Hu, E. M., & Cohen, J. G. 1996, AJ, 112, 839
- Dannerbauer, Walter, & Morrison (2008) Dannerbauer, H., Walter, F., & Morrison, G. 2008, ApJ, 673, L127 (D08)
- Dunkley et al. (2008) Dunkley, J., et al. 2008, ApJS, submitted (arXiv:0803.0586)
- Dunlop, Cirasuolo, & McLure (2007) Dunlop, J. S., Cirasuolo, M., & McLure, R. J. 2007, MNRAS, 376, 1054
- Dye et al. (2008) Dye, S., et al. 2008, MNRAS, 386, 1107
- Eales et al. (1999) Eales, S., Lilly, S., Gear, W., Dunne, L., Bond, J. R., Hammer, F., Fèvre, O. L., & Crampton, D. 1999, ApJ, 515, 518
- Eyles et al. (2007) Eyles, L. P., Bunker, A. J., Ellis, R. S., Lacy, M., Stanway, E. R., Stark, D. P., Chiu, K. 2007, MNRAS, 374, 910
- Fan et al. (2001) Fan, X., et al. 2001, AJ, 122, 2833
- Fontana et al. (2006) Fontana, A., et al. 2006, A&A, 459, 745
- Fixsen et al. (1998) Fixsen, D. J., Dwek, E., Mather, J. C., Bennett, C. L., & Shafer, R. A. 1998, ApJ, 108, 123
- Frayer et al. (2006) Frayer, D., et al. 2006, ApJ, 647, L9
- Giavalisco et al. (2004) Giavalisco, M. et al. 2004, ApJ, 600, L93
- Hawarden et al. (2001) Hawarden, T. G., Leggett, S. K., Letawsky, M. B., Ballantyne, D. R., & Casali, M. M. 2001, MNRAS, 325, 563
- Hu & Ridgway (1994) Hu, E. M., & Ridgway, S. E. 1994, AJ, 107, 1303
- Huynh et al. (2007) Huynh, M. T., Pope, A., Frayer, D. T., & Scott, D. 2007, ApJ, 659, 305
- Hughes et al. (1998) Hughes, D. H., et al. 1998, Nature, 394, 241
- Ichikawa et al. (2006) Ichikawa, T., et al. 2006, Proc. SPIE, 6269, 38
- Ivison et al. (2002) Ivison, R. J., et al. 2002, MNRAS, 337, 1
- Kajisawa et al. (2006) Kajisawa, M., et al. 2006, PASJ, 58, 951
- Kennicutt (1998) Kennicutt, R. C. 1998, ARA&A, 36, 189
- Kinney et al. (1996) Kinney, A. L., Calzetti, D., Bohlin, R. C., McQuade, K., Storchi-Bergmann, T., & Schmitt, H. R. 1996, ApJ, 467, 38
- Labbé et al. (2006) Labbé, I., Bouwens, R., Illingworth, G. D., & Franx, M. 2006, ApJ, 649, L67
- Lukić et al. (2007) Lukić, Z., Heitmann, K., Habib, S., Bashinky, S., & Ricker, P. M. 2007, ApJ, 671, 1160
- Madau, Haardt, & Rees (1999) Madau, P., Haardt, F., & Rees, M. J. 1999, ApJ, 514, 648
- Maraston (2005) Maraston, C. 2005, MNRAS, 362, 799
- Maraston (2006) Maraston, C., Daddi, E., Renzini, A., Cimatti, A., Dickinson, M., Papovich, C., Pasquali, A., & Pirzkal, N. 2006, ApJ, 652, 85
- McCarthy (2004) McCarthy, P. J. 2004, ARA&A, 42, 477
- Mobasher et al. (2005) Mobasher, B., et al. 2005, ApJ, 635, 832
- Nagamine et al. (2004) Nagamine, K., Cen, R., Hernquist, L., Ostriker, J. P., & Springel, V. 2004, ApJ, 610, 45
- Night et al. (2006) Night, C., Nagamine, K., Springel, V., & Hernquist, L. 2006, MNRAS, 366, 705
- Pope et al. (2006) Pope, A., et al. 2006, MNRAS, 370, 1185
- Puget et al. (1996) Puget, J.-L., Abergel, A., Bernard, J.-P., Boulanger, F., Burton, W. B., Désert, F.-X., & Hartmann, D. 1996, A&A, 308, L5
- Richards (2000) Richards, E. A. 2000, ApJ, 533, 611
- Salpeter (1955) Salpeter, E. E. 1955, ApJ, 121, 161
- Sanders & Mirabel (1996) Sanders, D. B., & Mirabel, I. F. 1996, ARA&A, 34, 749
- Serjeant et al. (2008) Serjeant, S., et al. 2008, MNRAS, 386, 1907
- Silva et al. (1998) Silva, L., Granato, G. L., Bressan, A., & Danese, L. 1998, ApJ, 509, 103
- Smail, Ivison, & Blain (1997) Smail, I., Ivison, R. J., & Blain, A. W. 1997, ApJ, 490, L5
- Smail et al. (2004) Smail, I., Chapman, S. C., Blain, A. W., & Ivison, R. J. 2004, ApJ, 616, 71
- Steidel et al. (1999) Steidel, C. C., Adelberger, K. L., Giavalisco, M., & Dickinson, M. 1999, ApJ, 519, 1
- Stern et al. (2006) Stern, D., Chary, R.-R., Eisenhardt, P. R. M., & Moustakas, L. A. 2006, AJ, 132, 1405
- Swinbank et al. (2003) Swinbank, A. M., Smail, I., Chapman, S. C., Blain, A. W., Ivison, R. J., & Keel, W. C. 2004, ApJ, 617, 64
- Tacconi et al. (2006) Tacconi, L. J., et al. 2006, ApJ, 640, 228
- Thompson et al. (2006) Thompson, T. A., Quataert, E., Waxman, E., Murray, N., & Martin, C. L. 2006, ApJ, 645, 186
- Vlahakis, Eales, & Dunne (2007) Vlahakis, C., Eales, S., & Dunne, L. 2007, MNRAS, 379, 1042
- Wang, Cowie, & Barger (2004) Wang, W.-H., Cowie, L. L. & Barger, A. J. 2004, ApJ, 613, 655
- Wang, Cowie, & Barger (2006) Wang, W.-H., Cowie, L. L. & Barger, A. J. 2006, ApJ, 647, 74
- Wang et al. (2007) Wang, W.-H., Cowie, L. L., van Saders, J., Barger, A. J., & Williams, J. P. 2007, ApJ, 670, L89 (W07)
- Yan et al. (2006) Yan, H., Dickinson, M., Giavalisco, M., Stern, D., Eisenhardt, P. R. M., & Ferguson, H. C. 2006, ApJ, 651, 24
- Yun & Carilli (2002) Yun, M. S. & Carilli, C. L. 2002, ApJ, 568, 88
- Younger et al. (2007) Younger, J. D., et al. 2007, ApJ, 671, 1531