22email: chapillon@obs.u-bordeaux1.fr,guilloteau@obs.u-bordeaux1.fr, dutrey@obs.u-bordeaux1.fr 33institutetext: IRAM, 300 rue de la Piscine, 38400 Saint Martin d’Hères, France.
33email: pietu@iram.fr
Disks around CQ Tau and MWC 758: dense PDR or gas dispersal?††thanks: Based on observations carried out with the IRAM Plateau de Bure Interferometer. IRAM is supported by INSU/CNRS (France), MPG (Germany) and IGN (Spain).
Abstract
Context. The overall properties of disks surrounding intermediate PMS stars (HAe) are not yet well constrained by current observations. The disk inclination, which significantly affect SED modeling, is often unknown.
Aims. We attempted to resolve the disks around CQ Tau and MWC 758, to provide accurate constraints on the disk parameters, in particular the temperature and surface density distribution.
Methods. We report arcsecond resolution observations of dust and CO line emissions with the IRAM array. We also searched for the HCO+ J=10 transition. The disk properties are derived using a standard disk model. We use the Meudon PDR code to study the chemistry.
Results. The two disks share some common properties. The mean CO abundance is low despite disk temperatures above the CO condensation temperature. Furthermore, the CO surface density and dust opacity have different radial dependence. The CQ Tau disk appears warmer, and perhaps less dense than that of MWC 758. Modeling the chemistry, we find that photodissociation of CO is a viable mechanism to explain the low abundance. The photospheric flux is not sufficient for this: a strong UV excess is required. In CQ Tau, the high temperature is consistent with expectation for a PDR. The PDR model has difficulty explaining the mild temperatures obtained in MWC 758, for which a low gas-to-dust ratio is preferred. A yet unexplored alternative could be that, despite currently high gas temperatures, CO remains trapped in grains, as the models suggest that large grains can be cold enough to prevent thermal desorption of CO. The low inclination of the CQ Tau disk, , challenges previous interpretations given for the UX Ori - like luminosity variations of this star.
Conclusions. We conclude that CO cannot be used as a simple tracer of gas-to-dust ratio, the CO abundance being affected by photodissociation, and grain growth.
Key Words.:
Stars: circumstellar matter – planetary systems: protoplanetary disks – individual: CQ Tau, MWC 758, MWC 480, AB Aur – Radio-lines: stars1 Introduction
It is now generally admitted that the disks surrounding intermediate mass () pre-main-sequence (PMS) HAe stars are warmer and more massive analogs of those surrounding lower mass TTauri stars. Mannings & Sargent (1997, 2000) have shown that disks are indeed frequent, if not ubiquitous around HAe stars. Nevertheless, only very few objects have been modeled in detail. Accurate disk orientation, sizes, temperatures and CO abundances are available for a few objects only: AB Aur (Piétu et al., 2005), MWC 480 (Simon et al., 2000; Piétu et al., 2007), and HD 163296 (Isella et al., 2007) have been studied in CO isotopologues. Already one disk out of these three stands out as peculiar: the disk around AB Aur exhibits non-Keplerian motions, perhaps due to its youth (Piétu et al., 2005; Lin et al., 2006). HD 34382 was observed at high angular resolution in by Piétu et al. (2003), but due to its larger distance, only limited information could be obtained.
The disk around CQ Tau (HD 36910) has also been imaged at different wavelengths. So far, this is one of the oldest HAe star ( 10 Myrs) surrounded by a resolved dust and gas disk (Mannings & Sargent, 1997; Testi et al., 2001; Doucet et al., 2006). Moreover, CQ Tau appears as a peculiar HAe star exhibiting an UX Ori-like variability (Natta et al., 1997). MWC 758 (HD 36112) has also been barely resolved in CO by Mannings & Sargent (1997, 2000). Both disks appeared significantly weaker and smaller in CO lines than the previously studied disks around HAe stars.
| (1) | (2) | (3) | (4) | (5) | ( 6) | (7) | (8) |
|---|---|---|---|---|---|---|---|
| Source | Right ascension | Declination | Spec. type | Effective temp.(K) | Stellar lum.() | Distance | CO paper |
| MWC 480 | 04:58:46.264 | 29:50:36.86 | A4 | 8460 | 11.5 | 140 | 1,2 |
| AB Aur | 04:55:45.843 | 30:33:04.21 | A0/A1 | 10000 | 52.5 | 140 | 3 |
| HD 34282 | 05:16:00.491 | -09:48:35.45 | A1/A0 | 9440 | 29 | 400 | 4 |
| HD 163296 | 17:56:21.28 | -21:57:21.9 | A1 | 9300 | 30 | 122 | 5 |
| CQ Tau | 05:35:58.485 | 24:44:54.19 | A8/F2 | 7200 | 8-16∗ | 140∗ | 6 |
| MWC 758 | 05:30:27.542 | 25:19:57.32 | A3/A8 | 8200 | 11∗ | 140∗ | 6 |
Columns 2&3: J2000 coordinates deduced from the fit of the 1.3 mm continuum map of the PdBI. Errors bars on the astrometry are of order . Columns 4, 5, and 6, the spectral type, effective temperature and the stellar luminosity are those given in Simon et al. (2000) and Piétu et al. (2003) for HD 34282 van den Ancker et al. (1998) for AB Aur and MWC 758, Natta et al. (2001) and Mannings & Sargent (1997) for CQ Tau. Column 8, CO interferometric papers are: 1 = Piétu et al. (2007), 2 = Simon et al. (2000), 3 = Piétu et al. (2005), 4 = Piétu et al. (2003), 5 = Isella et al. (2007). and 6 = this work. (*) For MWC 758 and CQ Tau, the luminosity has been scaled to the assumed distance of 140 pc.
In order to improve our knowledge on HAe disks, we have observed CQ Tau and MWC 758 with the IRAM array. We present here our results. The two stars were imaged in J=21 and continuum emission at 1.3 and 3.4 mm (angular resolution of 1.5 and 3.4′′, respectively). 2.5′′ resolution images of J=10 in MWC 758, and upper limits on the HCO+ J=10 line are also reported.
Section 2 presents the stellar properties and the observations. Section 3 focusses on the CO and dust modeling. We present in Section 4 the chemical model that we used to interpret the observed CO column densities. We discuss in Section 5 all the properties of the two sources before conclusion, in Section 6.
2 Observations
2.1 Star properties and the distance problem
CQ Tau and MWC 758 are two Herbig Ae stars situated near the edge of the Taurus complex. The spectral type of MWC 758 ranges from A3e (The et al., 1994) to A8v (Beskrovnaya et al., 1999); that of CQ Tau from A8 to F2 (e.g. Creech-Eakman et al., 2002), or even F4/F5 (Mora et al., 2001). MWC 758 has a rotation velocity sin km s-1, and CQ Tau sin km s-1 (Boehm & Catala, 1995; Mora et al., 2001).
Hipparcos measurements place them formally at 100 pc (CQ Tau) and 200 pc (MWC 758) respectively (van den Ancker et al., 1998). However, the formal uncertainties on the parallaxes are such that the two stars could be equally placed (at the level) at 140 pc. As the apparent position of the stars place them at the outskirts of the Taurus/Auriga molecular cloud region and their systemic velocities are equal to the Taurus one, we assume here a physical association, and use D=140 pc for both sources. This eases the comparison with other studies of similar objects in the Taurus region. Furthermore, in Sec.3.4, we show that the 100 pc distance for CQ Tau is not compatible with our new measurements.
Nevertheless, the effects of the distance uncertainties will be considered whenever appropriate in this paper. Most of the results for the disk parameters can be simply scaled for different distances using the appropriate scaling laws given in Dutrey et al. (2003).
The stellar properties corresponding to the D=140 pc distance are given in Table 1, with those of other HAe stars having detailed disk studies. Note that CQ Tau being highly variable (up to 3 magnitudes, see Grinin et al., 2008), the values of its luminosity quoted in the literature vary by almost an order of magnitude.
2.2 PdBI data
The J=21 data for CQ Tau and MWC 758 were obtained in snapshot mode in Nov 1999 and Jan 2001, together with AB Aur (Piétu et al., 2005). The 12CO J=2-1 data were smoothed to 0.25 spectral resolution for the final analysis. Baselines up to 170 m provided about 1.5′′ resolution with robust weighting. The HCO+ J=10 data were obtained simultaneously: a 20 MHz/512 channels correlator unit provided a spectral resolution of 0.13 .
The phase and secondary flux calibrators were 0415+379 and 0528+134. The primary flux calibrator was MWC 349. The rms phase noise was 8 to 25 and 15 to 50 at 3.4 mm and 1.3 mm, respectively, which introduced position errors of . The estimated seeing is about 0.2′′ after calibration. Since the observations were obtained with those of AB Aur, these data share a common flux scale. Thus the temperature (and column densities) can be directly compared with those cited by Piétu et al. (2007) for AB Aur, MWC 480 and DM Tau, as well as the derived values for the dust emissivity spectral index .
For MWC 758, the J=10 line was observed in Dec 1995 and Mar 1996. The longest baseline was 180 m, and provided an angular resolution of at PA .
(a)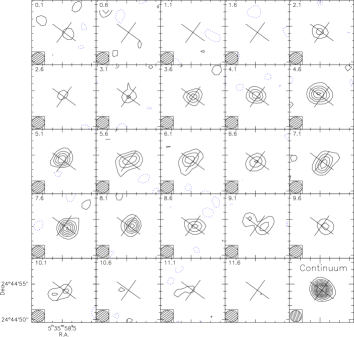 (b)
(b)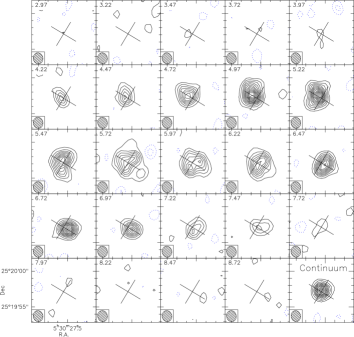
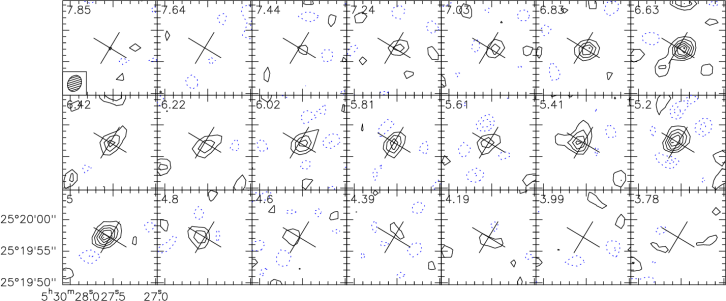
Figure 1 presents the channel maps of J=21 for CQ Tau and MWC 758. Figure 2 shows the J=10 channel maps of MWC 758. The characteristic pattern of rotation is clearly apparent. No HCO+ was detected.
We used the GILDAS111See http://www.iram.fr/IRAMFR/GILDAS for more information about the GILDAS software. software package (Pety, 2005) to reduce the data and as a framework to implement our minimization technique. Table 2 indicates the result of Gaussian fit to the continuum visibilities. Elliptical Gaussian were used at 230 GHz; at 89 and 113 GHz, the resolution is insufficient to constrain the disk aspect ratio and only a circular Gaussian was fitted.
| Frequency | Flux | Major | Minor | PA |
| (GHz) | (mJy) | ′′ | ′′ | ∘ |
| MWC 758 | ||||
| 230 | ||||
| 113 | – | – | ||
| 89 | – | – | – | |
| CQ Tau | ||||
| 230 | 32 | |||
| 89 | – | – | ||
The error bars include only thermal noise, but not the flux scale accuracy ( %) or the effects of seeing. Here, the P.A. is that of the ellipse major axis. At 89 and 113 GHz, a circular Gaussian was fitted.
3 CO and Dust Models
The data were fitted using our standard flaring disk model, with power law distributions for all primary quantities (surface density , temperature , velocity and scale height), following the method described in detail by Piétu et al. (2007). This allows the CO surface density and dust radial emissivity profile to be recovered completely independently, without assumptions on the CO abundances. An essential property of disks is that, because the CO surface density gradient is significantly steeper than the temperature gradient (), it is possible, with sufficient angular resolution, to distinguish (from the apparent slope of the surface brightness versus radial distance) the transition between an optically thick core () and an optically thin outer part ( for low J CO lines, see Dutrey et al., 2007). Thus, the fitting procedure can actually reveal whether the CO emission is mostly optically thick or optically thin, even with a single transition.
For the dust emission, we use the standard prescription for the mass absorption coefficient (Beckwith et al., 1990):
| (1) |
For the continuum data, as the angular resolution does not allow to separate the optically thick core, all frequencies observed with the IRAM interferometer were fitted simultaneously, using the temperature (fixed) derived from the CO measurements.
The results are summarized in Table 3. The errors bars are derived from the covariance matrix by the minimization routine. We refer to Piétu et al. (2007) for notations (see also Table 3) and detailed description. These new observations directly prove the Keplerian nature of the rotation, with a best fit exponent for both sources.
| (1) | (2) | (3) | (4) | (5) | ( 6) | (7) |
|---|---|---|---|---|---|---|
| Source | CQ Tau | MWC 758 | ||||
| Data | J=21 | Dust | J=21 | J=10 | Dust | |
| (km.s-1) | 5.79 | |||||
| Orientation, PA (∘) | -36.7 | -31 | -23 | -31 | ||
| Inclination, (∘) | 29.3 | 18 | 16 | 16 | ||
| Velocity law: | ||||||
| Velocity, (km.s-1) | [4.00] | |||||
| Velocity exponent, | 0.51 0.02 | 0.51 0.03 | 0.47 | 0.50 | ||
| Stellar mass, M∗ () | 1.8 0.2 | 1.5 0.7 [1.80] | [1.80] | |||
| , (cm-2) | ||||||
| (g.cm-2) | 0.075 0.015 | 0.3 0.1 | ||||
| Exponent | [3] | |||||
| Outer radius , (AU) | ||||||
| Temperature,(K) | [150] | |||||
| Exponent | [0.5] | |||||
| , (km.s-1) | ||||||
| Scale height, (AU) | 11 | |||||
| 1.0 0.15 | ||||||
Column (1) contains the parameter name. Columns (2) and (4) indicate the parameters derived from J=21,
column (5) parameters derived from J=10, and
columns (3) and (7) parameters derived from the dust emission, using
the disk temperature from and the dust emissivity from Eq.1.
Column (6) indicates the results of a simultaneous fit to both CO lines.
Note that the P.A. is that of the disk axis.
is the local line width (sum of thermal + turbulent component see Piétu et al. (2007) for a description of the convention). is the surface density ((H+2H2)/2) and the mass surface density assuming a ratio of 100. values at 100 AU. Square brackets indicate fixed parameters. The error bars correspond to 1 level of uncertainties.
3.1 MWC 758
The disk outer radius is AU in CO and somewhat smaller in dust. The line and continuum emissions provide very consistent results for the disk orientation. The J=21 line appears partially optically thick, thereby allowing the derivation of the disk temperature in the inner regions ( AU), and of the CO column density in the outer regions ( AU) under the assumption of a single temperature power law. The parameters derived from both transitions are in good agreement. The exponent is not well constrained for the J=10 line; we thus fix it to a value compatible with the J=21 results. We also present results which both lines fitted together (col 6, Table 3). The better sensitivity allows to derive more parameters such as stellar mass, temperature and exponent .
The difference between the temperatures determined from the J=10 and J=21 lines is in line with the vertical temperature gradients found in some other stars (Piétu et al., 2007), but not determined with sufficient precision to conclude. We thus prefer to use the temperature derived from a simultaneous fit of both transitions. This temperature is moderate, 30 K, with little dependance upon radius (exponent ). Because the J=21 transition is barely optically thick, the temperature is representative of the bulk of the disk, and not only of the surface layers as in the optically thick CO disks studied by Piétu et al. (2007).
Because the emission is spatially resolved at 1.3 mm, the dust emissivity index is well constrained, with little bias due to a possible contribution from an optically thick core: . If we assume that the dust and CO are at the same temperature, the total disk mass is (with cm2g-1).
Assuming the same distribution and excitation conditions than for CO, the HCO+ J=10 line provides an upper limit of cm-2 for the column density of HCO+ at 100 AU, i.e. []/[HCO+ ]
The inclination is poorly constrained (), but, except for the rotation velocity at 100 AU (as the data essentially constrain ), all other parameters remain unaffected by this uncertainty. Besides the solution presented here, another solution with can be found. However, only the low inclination solution is compatible with the stellar mass derived from the location of the star on a distance independent HR diagram, and . For , the stellar mass is . Reconciling this with the spectral type of the star would imply placing it at a distance of pc. The disk outer radius would be AU, the disk mass , and the temperature at 100 AU 40 K. MWC 758 would have among the most massive disks around HAe stars (with HD 34282 Piétu et al., 2003). It would however give , which from the Siess et al. (2000) tracks, require .
3.2 CQ Tau
For CQ Tau, we obtain for the first time accurate measurements of the inclination of the disk and of the orientation of the disk axis (). The disk inclination is well constrained from both () and continuum emission (), although with larger error bars for the continuum. Note that both determinations are affected by different instrumental effects. The dust emission is biased by the phase noise (seeing), while the CO-derived inclination is affected by bandpass calibration errors, which are negligible in our case. The overall agreement indicates that the seing effects remain small compared to the thermal noise. However, our results on the disk differ from several previous determinations: for example, Testi et al. (2003) cite a major axis disk orientation (or for the disk axis) and inclination () very different from ours. Most of the previous measurements were based on deconvolved sizes in the image plane, either on integrated intensity maps of CO (Mannings & Sargent, 1997) or from relatively low S/N continuum data (e.g. the 7 mm VLA data of Testi et al., 2001). Our results being based on the velocity gradient and a plane analysis are much more reliable: in particular, they predict a stellar mass in agreement with the spectral type of CQ Tau. It is worth noting that, using the mid-IR camera CAMIRAS installed on the CFHT, Doucet et al. (2006) have imaged the thermal emission of the dust disk at 20.5 m and found an inclination angle of in agreement with our measurements.
The disk of CQ Tau is somewhat smaller, 200 AU in radius, than that of MWC 758. Both continuum and CO measurements give the same outer radius. Doucet et al. (2006) estimated the disk radius to be of order of AU at 20.5 m (when corrected for the distance of 140 pc). The 20 m emission comes from small, warm, grains at the surface layer of a flared disk. On the opposite, the mm data trace large grains in the disk mid-plane. A difference in radial extent between these two populations of grains is a standard feature of protoplanetary disks, as exemplified for example by HH 30 (Guilloteau et al., 2008).
The J=21 emission appears essentially optically thin. Since the contribution of the optically thick core is small for R 60 AU, the disk temperature exponent is poorly constrained. Best fit values are around 1, but with large uncertainty. We thereby adopted . This value is a compromise between the flat temperature distribution () obtained in the disk mid-planes, as for MWC 758, or DM Tau and MWC 480 (Piétu et al., 2007), and the steeper laws occurring at the disk surfaces, (Guilloteau & Dutrey, 1998).
Even with this reduced degree of freedom, the temperature remains difficult to constrain. A lower limit of about 60 K can be obtained (in essence, because of the apparent J=21 surface brightness, taking into account that the Keplerian shear results in significant beam dilution), but higher values cannot be excluded. We adopted K; this choice has no effect on the disk parameters, except for the derived CO and dust surface densities and thus disk mass and CO abundance. The brightness temperature being fixed, for a constant line-width and in the high temperature approximation, the CO surface density is proportional to the assumed temperature (because ) and the dust surface density is proportional to the inverse of the temperature (as , see Dartois et al. (2003) and their Fig.4 for details).
If we assume that the dust and CO are at the same temperature, and the prescription for the dust emissivity in Eq.1, which gives cm2g-1, the total disk mass is small, . Note however that this is probably a lower limit, because of the existence of vertical temperature gradients, as directly demonstrated by Piétu et al. (2006): if the dust is at 50 K, the disk mass increases to .We stress that our choice of temperature maximizes the apparent CO abundance, as this scales as .
Our result on agrees very well with the determined by Testi et al. (2003) using a broader frequency range including VLA observations at 7 mm.
Assuming the same distribution and excitation conditions than for CO, the HCO+ J=10 line provides an upper limit of cm-2 for the column density of HCO+ at 100 AU, i.e. []/[HCO+ ].
3.3 Prediction for the CO J=3-2 Line
The J=32 in CQ Tau and MWC 758 was detected by Dent et al. (2005) using the JCMT. Our best fit model can be used to predict the intensity of this line. This is given in Table 4, also for MWC 480 using the model parameters from Piétu et al. (2007). The agreement is excellent for MWC 758 and MWC 480, but our prediction is a factor 2 too high for CQ Tau. The discrepancy can be somewhat reduced (by about 30 %) by using a temperature of 70 K for CQ Tau. The remaining difference may be due to noise, as the CQ Tau CO J=3-2 line is detected with a S/N of only 6 by Dent et al. (2005). The spectral baseline uncertainty on the JCMT data can also play a significant role at this sensitivity level. Nevertheless, this result suggests that the temperature in CQ Tau may not be as high as we estimated. It is also possible that the J=32 line is somewhat sub-thermally excited, as its higher opacity makes it more sensitive to the upper layers than the J=21 transition.
| Source | J=32 integrated line flux (Jy km s-1) | |
| name | observed | predicted |
| CQ Tau | 6 1 | 14(#) – 11(*) |
| MWC758 | 15 2 | 15 |
| MWC480 | 52 1.1 | 47 |
J=32 observation from Dent et al. (2005). The conversion factor from the main beam brightness temperature Tmb(K) to flux density is 19 Jy/K for the 22′′ beam at 345 GHz. (#) for T=150 K,(*) for T=70 K.
3.4 Distance effects
As mentioned in Sec.2.1, CQ Tau could be at 100 pc and MWC 758 at 200 pc, instead of our assumed D=140 pc. The surface density scales as Dp, the temperature as Dq, the disk mass as D2, and the stellar mass, when derived from the Keplerian rotation, as D (see Dutrey et al., 2003). With the values of and from Table 3, the impact of the distance ambiguity remains limited to a factor 2 on the disk masses. However, the difference in disk mass between CQ Tau and MWC 758 becomes affected by a factor 4.
The CO abundance (at 100 AU) will scale as Dp(CO)-p(dust). It is thus little affected by the distance uncertainty (less than 50%).
Figure 3 shows the location of CQ Tau and MWC 758 on a distance independent HR diagram, as used by Simon et al. (2000), using the evolutionary tracks of Siess et al. (2000). The location of CQ Tau in this diagram is a further argument for the distance of 140 pc for this object: at 100 pc, the kinematic data would require a mass of , which is clearly incompatible with the effective temperature and L/M2, which indicate a star. We point out that, with these new results, CQ Tau could actually be younger than initially thought (5 Myr), and even younger than MWC 758.

3.5 Comparison between sources
Both sources have many characteristics in common:
-
1.
Partially optically thin CO line emission, in contrast to most previously studied disks.
-
2.
Different surface density profiles for CO and dust, with the CO surface density falling faster () than the dust opacity (). This property is apparently shared with all other observed sources so far, with the exception of HD 163296 which displays a relatively shallow CO surface density profile (, according to Isella et al. (2007)).
-
3.
Similar values for the dust emissivity exponent . In both sources, we have resolved the continuum emission, so this value is free of the bias due to a possible optically thick core. For CQ Tau, Testi et al. (2003) also found that the free-free contribution is negligible. These values are smaller than those found for MWC 480 and AB Aur, (Piétu et al., 2006, 2007).
-
4.
Similar lower limit for the ratio, , corresponding to when taking into account a reasonable (average) CO isotopologue ratio. This limit is consistent with what has been measured in other sources by Piétu et al. (2007).
-
5.
An essential result, which remains whatever the distance, is that the apparent CO abundance is very low in both sources, less than 10-6, corresponding to a CO depletion compared to typical molecular clouds (Ohishi et al., 1992).
-
6.
Both sources have also relatively small disk masses, less than or about . Because of the distance problem, and dust temperature uncertainty for CQ Tau, disk masses remain the least accurate parameters. In the most extreme case, the MWC 758 disk could be up to 8 times more massive than the CQ Tau one.
Although the two sources are very similar, CQ Tau stands out among the sources studied so far because it accumulates a number of peculiarities. It is at least as warm as AB Aur, the warmest source detected in CO J=2-1 so far, and only the second source in which J=21 is optically thin, after BP Tau (Dutrey et al., 2003). Like BP Tau, the CO and dust outer radii are identical within the current error bars. This is an important difference with most other sources, either TTauri stars or HAe stars, for which the outer radius of the bulk of the dust emission is in general smaller than the CO outer radius (see the T Tauri stars DM Tau, LkCa 15 and the HAe stars AB Aur, MWC 480 (Piétu et al., 2006, 2007), and HD 163296 (Isella et al., 2007)).
3.6 CO abundance: an anomalous gas to dust ratio ?
For both sources, one of the surprising findings is the very low apparent CO abundance, (within a factor 3, as this value decreases with radius), if a standard gas to dust ratio of 100 is assumed, i.e. an apparent depletion of . Note that this result is completely distance independent. Since the temperature of these two disks is large, depletion of CO due to sticking on grains cannot be invoked in a simple way. The situation here is similar to that found for the T Tauri star BP Tau by Dutrey et al. (2003).
This suggests either i) that the gas (H and H2) to dust ratio is actually much lower than our assumed value of 100, because we are observing disks in the process of dissipating their gaseous content, or that the dust distribution has evolved (grain growth and settlement along the mid plane) either ii) by simple coagulation and size redistribution, and/or iii) by mantle accretion, taking off elements from the gas phase. In all cases, the CO/dust ratio is no longer a direct reflection of the gas to dust ratio, because of changes in the H2 shielding of the CO photo-dissociation lines.
Jonkheid et al. (2007) have studied the chemistry of HAe disks, and find that for very low masses of small grains, , the CO/H2 ratio can be of order of a few (see their models B4/BL4). Thus, our low observed CO column densities might be the result of grain growth and/or efficient dust settling. However, only in the lowest mass disks are the predicted column densities as low as we observe, a few (their Fig.8). As Jonkheid et al. (2007) do not present calculations with grain growth for disk masses in the range of what we observe, we have performed new chemical models which are described in the next section.
4 The Chemical Models
We use the PDR code from the Meudon Group (Le Bourlot et al., 1993; Le Petit et al., 2006), with the modifications from Hily-Blant et al. (2008) for the grain size distribution. The model is a one-dimensional stationary plane-parallel slab of gas and dust illuminated by an ultraviolet (UV) radiation field. The radiative transfer in the UV (which takes into account the self-shielding of H, H2 and CO lines and absorption in the continuum by dust grains), the molecular abundances and optionally the thermal balance are calculated iteratively at each point in the “cloud”. The chemical network is similar to that of Goicoechea et al. (2006). No freeze-out onto grains is considered: this assumption will be discussed in Sec.5.4.
In order to study the chemical and physical effects of grain growth on disks, in particular the UV penetration, the PDR code was modified by Hily-Blant et al. (2008) to introduce a standard power law grain size distribution with and being the maximum and minimum cutoff radii, respectively. This modification affects the UV extinction curve, the chemistry (H2 formation) and the thermal balance and is self-consistently introduced. The resulting extinction curve is calculated using the Mie theory for homogeneous isotropic spherical particles and presented in Appendix A.
To have a two-dimensional molecular distribution we compute the model at different radii. The output of this 1+1D model is the vertical distribution of molecular abundance calculated at different radii.
4.1 Parameters of the Chemical Model
As an input we can impose physical conditions relevant from the disk structure (i.e. temperature and vertical density laws as derived from Table 3) at each radius. Since the disk masses are the most poorly constrained parameters, the models are not intended to fit any particular object, but are to be used to understand the major effects of the model parameters on the CO abundance, and more specifically, to seek what conditions and physical processes prevent CO to reach high surface densities. Two different disk density profiles were used. The “low mass” case correspond to a dust mass (in the inner 200 AU) of , the “high mass” case of , both with and a scale height of 22 AU at 100 AU.
We investigate several gas to dust ratio () under various UV field conditions, and different maximum grain size . A wide range of parameters has been explored (see Table 5). The whole ensemble of results is presented in Appendix A, B and C.
.
Parameters
values in calculations
1, 10, and 100
1 mm, 10, 1, and 0.1 m
(at 100 AU)
,, , , plus a modified shape
(km.s-1)
0.5, 1.0, and 2.0
is the Gas to Dust ratio, the maximum grain radius, the UV scale factor over the Draine interstellar field, and the local line width for H2. See Section 4.1 for details.
UV field To estimate the UV field, we assumed UV is scattered by the dust: half towards the mid-plane and half towards the exterior. We have checked that the opacity toward the star is strong enough to justify this hypothesis, as the amount of small grains remains sufficient even when increasing . The shape of the UV field is assumed to follow a Draine field (as provided by Sternberg & Dalgarno (1995)). With the above scattering assumption, it is described by a scale factor (222 is the ratio of the local UV field over the Draine interstellar UV field) at 100 AU, and decreases as . As the actual UV fields from the stars are unknown, several simulations have been done with different factors ( and ). As expected, a decrease of the incident UV field implies a decrease of the photodissociation rates, and makes CO more abundant (Figure 14 and 17 in Appendix B).
Thermal Balance Models can be calculated with and without thermal balance. The dust temperature is derived following Burton et al. (1990). With thermal balance, this dust temperature is used to compute the energy transfer between the gas and the grains as described in Burke & Hollenbach (1983). The gas temperature is then calculated, taking into account heating and cooling processes (see Le Petit et al. (2006)). Without thermal balance, the gas temperature is taken from the CO observations. The thermal balance has little effects on the CO abundances, except at very low densities. Provided that the assumed gas and dust temperatures are close enough to those derived in the disk mid-plane from the thermal balance, the results on the disk structure and CO column densities are rather similar. This is clearly seen by comparing Fig.6 and Fig.13.
Grain Distribution The composition of the dust is 50% of silicates and 50% of graphite with and 3nm in all calculations. The minimum grain radius is small enough to properly represent the photoelectric process, the UV extinction curve and the formation of H2 on grain surface. Keeping the dust mass constant, we have simulated grain growth by varying the maximum radius . The amount of small grains is therefore reduced to the benefit of large ones and the extinction curve is clearly modified. With , the UV opacity scales as for m.
We present the various models in Appendix A, with varying from 0.1 m to 1 mm. The main result is a significant decrease of the opacity towards the mid-plane and therefore an extension of the photo-dissociation layer when increases. As a consequence, the transition between the region where Carbon is predominantly atomic or ionized, and the region where CO dominates appear closer to the disk mid-plane (figure 12) and the CO column density is reduced (13).
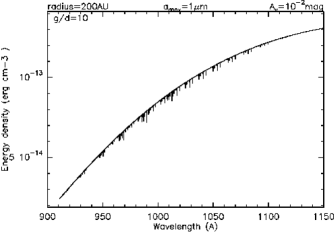
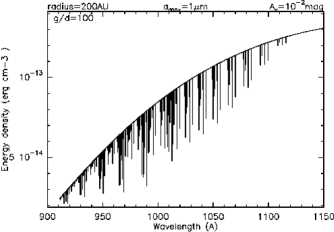
ratio We modify the ratio by decreasing the gas mass (H) while keeping the dust mass constant to simulate the dissipation of the gas. We performed calculations for and with several grain size distributions. The main effect of decreasing the gas to dust ratio is a modification of the spectral distribution of the radiative energy density in the disk (see figure 4). The gas being less abundant, the absorption in the lines of CO and H2 is less efficient and the transition H - H2 occurs closer to the mid-plane, and the disk is more ionized (e.g. for m, C+ is the dominant form of carbon in the mid-plane for radius greater than 200 AU).
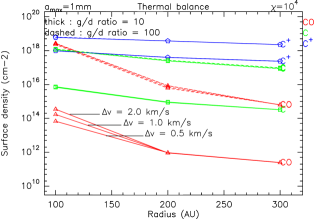
Turbulence We also check the effect of the intrinsic line width (turbulence) on the photo-dissociation line shielding. We have made three runs with three different values of the Doppler width of the H2 lines (0.5 - 1.0 - 2.0 km s-1) for m and 1 mm with . The stronger effects (obtained for mm) are presented in Appendix C, but the effect on CO is negligible, essentially because the CO pre-dissociation intrinsic line widths are much larger.
4.2 Chemical Models and comparison with the CQ Tau Disk
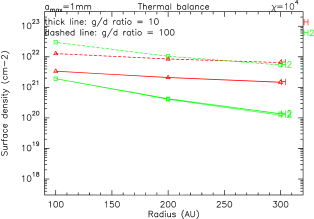
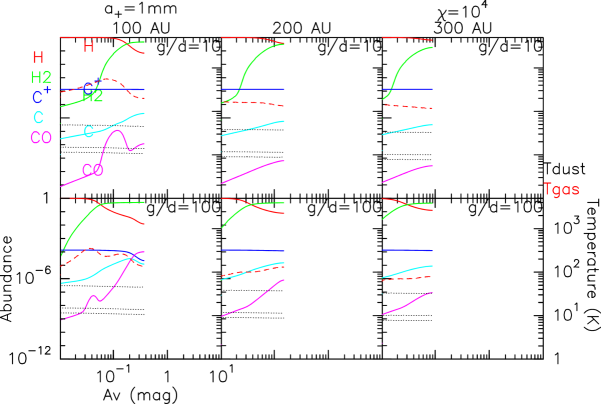
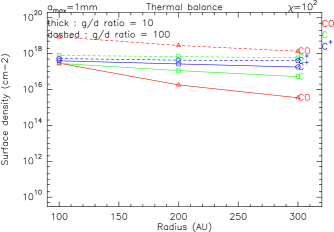
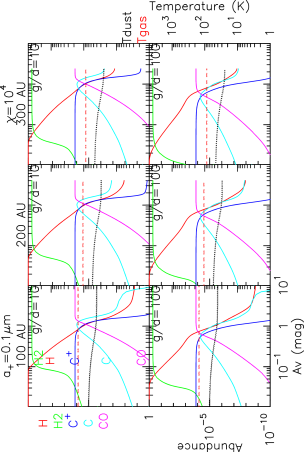
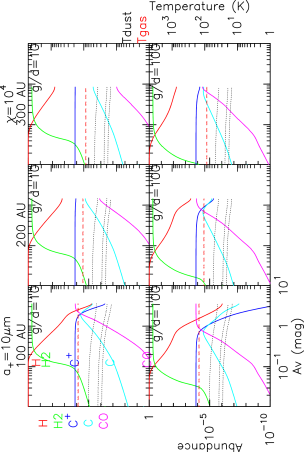
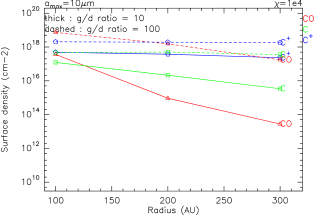
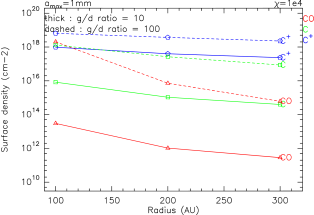
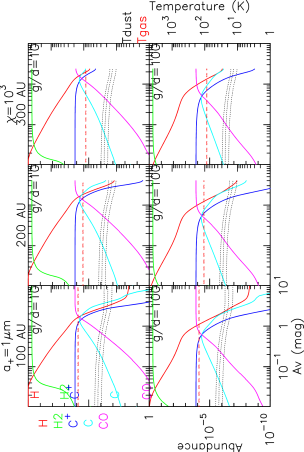
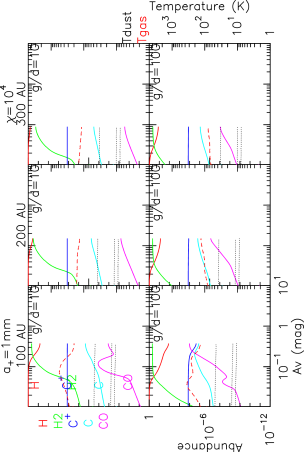
We only discuss in this section the results relevant for the CQ Tau case. The MWC 758 case is treated in the discussion by comparison to this example. More models are given in Appendix A, B and C. We assume the physical and chemical conditions derived from the CO analysis (see Table 3). Our goal is to reproduce the low CO column density which is observed, and corresponds (for a normal gas-to-dust ratio) to a CO depletion factor of or an abundance CO/H.
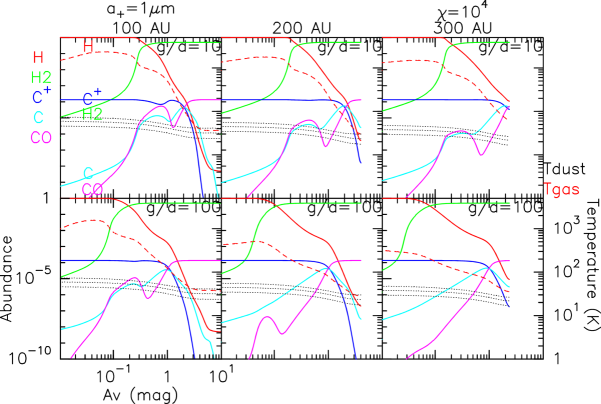
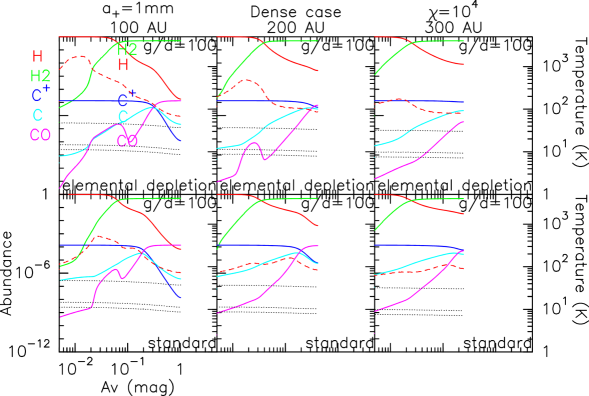
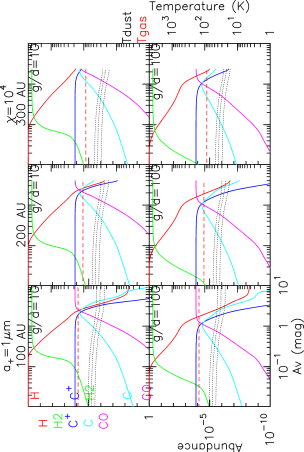
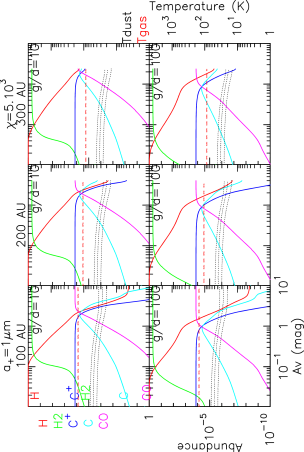
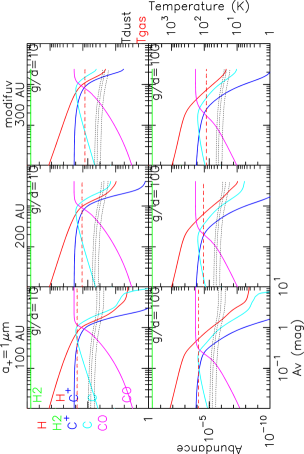
Figures 5 and 6 shows the abundances with respect to H+2H2 and the column densities obtained at radii 100, 200 and 300 AU under a UV field of . We assume two different values for (1m and 1 mm) and for (10 or 100) and the thermal balance is calculated. The gas temperature goes up to several thousand Kelvin in the disk atmosphere. In the mid-plane in the small grain case, the gas temperature is of the same order of magnitude as the dust temperature because the density is high enough to have thermal coupling by collisions. The shape of the CO abundance distribution is clearly affected by reactions at high temperature with OH leading to a secondary peak not located in the disk mid-plane. Although this peak is quite high in abundance, it occurs when the density is low and the column density is very weakly affected (Figure 6).
(a)
(b)
4.3 Chemical uncertainties and comparison with other results
Jonkheid et al. (2007) have also calculated the chemistry and gas temperature of evolving Herbig Ae disks. Their model differs in several ways from the above approach. Contrary to us (see above), they have modified the gas to dust ratio by decreasing the mass of the small grains (i.e. interstellar grains) in order to mimic the dust growth and/or settling. The UV transfer is performed with a 2-D code (van Zadelhoff et al., 2003) whereas in our case this is a 1-D approach. But the self-shielding of H2 and CO are calculated assuming a constant abundance whereas we compute it explicitly at each point of the “cloud”. Their chemical network is described in Jonkheid et al. (2004) and Jansen et al. (1995). It also incorporates chemical reactions with PAHs which are not considered in our model.
Indeed, we also find that CO becomes underabundant if and only if photodissociation is important. This requires a reduction in the UV opacity which is obtained by grain growth to 1 mm, or larger. Note that dust sedimentation towards the disk mid-plane should not play a significant role, as the small dust grains which are responsible for the UV opacity remain coupled to the gas. However, contrary to Jonkheid et al. (2007), we find that Carbon is predominantly in its ionized form C+ when CO is photo-dissociated.
5 Discussion
5.1 CO Abundance: Photodissociation with grain growth
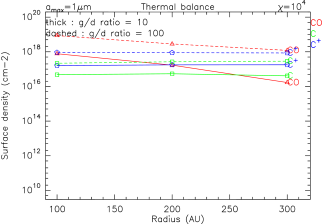
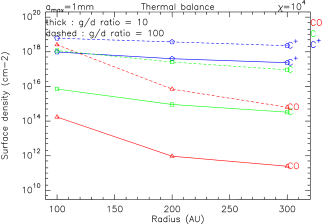
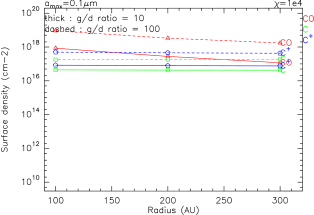
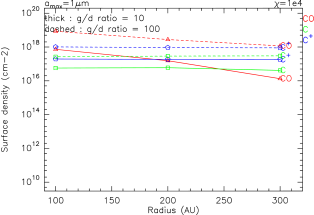
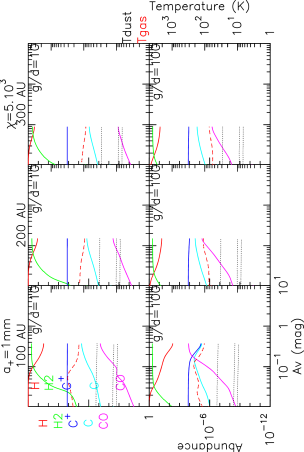
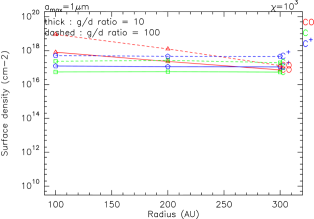
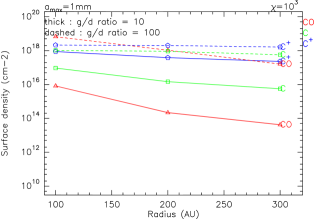
Figure 6 (right) suggests that a case with 1 mm and 100 can explain CO column densities of order cm-2 around 200 AU. Figure 6 (left) allows us to conclude that the case with m cannot explain the observed CO column densities, even with a low ratio. For CQ Tau this is in agreement with the spectral index we measure () which indicates that significant grain growth has occurred as also found by Testi et al. (2003). Grain growth is also supported by the value found for MWC 758.
This result suggests that grain growth, or more precisely the enhancement of the UV penetration resulting from grain growth is the dominant process explaining the measured CO column density. Note that we have assumed that the dust size distribution follows with . The conclusion will not significantly change for realistic slopes (Draine (2006) indicates for ). As the extinction curve is governed by the amount of small grains, it is reasonable to conclude that any solution which guarantees the same amount of small grains, leading to a similar extinction curve, would be sufficient to explain the CO column density without changing . Note that for , the mass within grains smaller than is about times the total dust mass, i.e. 3 % of the dust is in grains smaller than m for mm.
It is worth pointing that the photodissociation offers a natural explanation for the steeper surface density law of CO compared to dust. As UV penetration is more efficient in the outer parts of the disk, CO is more heavily dissociated, and the CO abundance decreases with radius (see Fig.6), resulting in a larger slope for CO than for dust and Hydrogen, in qualitative agreement with the observations. However, the values predicted by the models (4-6) seem larger than observed (2.5-3).
The ratio can also be used as a secondary diagnostic of the physical conditions. For large grains, a low ratio predicts a value around 1000 for this ratio, and much higher values for . Although this is relatively inconclusive compared to our current limit (4000), longer integration times on HCO+ could bring a useful diagnostic.
Note however that the CO column density is very sensitive to the UV penetration (and thus to the disk mass). We computed models twice less massive than those presented in Figs.5-6. In such cases, C+ is the dominant form of Carbon throughout the disk, and the CO column densities become much smaller than observed. Similar results can be obtained using a larger maximum grain size.
5.2 The UV problem
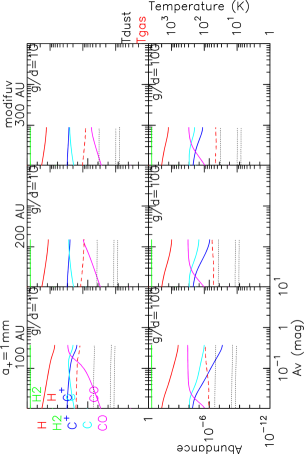
A significant uncertainty is linked to the knowledge of the UV field and to its vertical diffusion in the disk. Comparing Figure 16 with Figure 13 in the = 1mm case shows that decreasing the UV field to essentially brings back the Carbon into CO and increases the CO column densities by a factor 100 in both cases ( and 100). It is important to stress that what matters here is the number of available photons between 900 and 1200 where all the important photodissociation processes occur. Such large values of the UV field cannot be provided by the relatively cool stellar photospheres, and must come from the UV excess due to accretion, see Appendix for details. On the other hand, the heating will be significantly affected by the mean intensity up to 2000 Å, which is dominated by the stellar photosphere. In this respect, note that many authors specify the strength of the radiation field in reference to Habing (1968), i.e. by the integral of the UV flux between 912 and 2400 (= 5.166 eV) or between 912 and 2050 (= 6e V) (van Dishoeck et al., 2006). As the shape of the UV spectra from T Tauri or Herbig Ae stars differs quite significantly from the interstellar UV field between 900 and 2400 , this can lead to some inappropriate results.
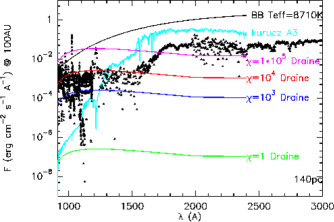
For example, the FUSE and IUE spectra for MWC 758 at 100 AU from the star (Figure 7) are relatively well fit, between 900 and 1200 , by a Draine field scaled up by (the apparent best fit is for a few , but correction for the star extinction, E(B-V)=0.07, Martin-Zaïdi, 2005, must be added to the curve presented in Fig.7). On the other end, a scale factor of would be needed to match the integrated intensity between 912 and 2400 Å. This scale factor would overestimate by a factor 10 the available UV flux in the 912 – 1200 domain relevant for photodissociation.
For CQ Tau, the situation is less clear because of its variability. From the IUE spectrum, the CQ Tau UV flux is 10-30 times lower than that of MWC 758 (see Grady et al., 2005, their Figure 5). However, the star may have been observed during a minimum by IUE. We performed another calculation with big grains and a lower UV field (). The results for are in good agreement with the observations: the CO column density is about cm-2 at 200 AU (Fig.8) and the gas temperature determined from the thermal balance is about 60 K. The ratio is consistent with our limit. Thus a solution with gas dispersal cannot be excluded if the actual UV field is indeed relatively low in CQ Tau.
5.3 MWC 758 and the Temperature problem
The observed CO temperature and that calculated from the (approximate) thermal balance are in reasonable agreement for CQ Tau, around 60 – 100 K. MWC 758 poses a different challenge, as the observed gas temperature is much lower, about 30 K, while the estimated CO column density is similar.
Reducing the UV flux inside the disk is the simplest way to obtain a lower temperature. For a similar incident UV flux, increasing the attenuation through the disk, i.e. having smaller grains, will lower the temperatures. However, this will also reduce photodissociation and produce more CO. Indeed, Fig.5 shows that low gas temperatures (in the mid-plane) can be obtained only with small (maximum size 1m) grains, in which case the CO abundance is high. For all cases compatible with low CO column densities, the gas temperature is high ( K). In fact, in the PDR interpretation, to have a similar CO surface density, the UV fields in the disk must be similar in both sources.
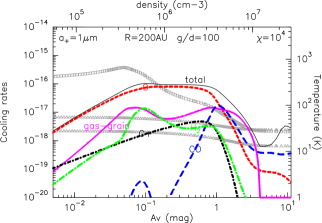
What can explain the temperature difference between the two objects? The thermal balance of the gas is controlled by several mechanisms. In the upper layers, the energy release due to H2 formation dominates the heating, and the gas cools by radiation in the fine structure lines of C and O. Deeper in the disk, photoelectric effect on dust grains become important (and sometimes dominant), and then the energy deposition from cosmic rays (which is largely transported via the chemical reactions). CO line cooling becomes important. At still higher densities, the gas-grain coupling become dominant: this can be either a heating or a cooling mechanism, depending on whether dust is warmer than the gas or vice versa.
The similarities and differences between CQ Tau and MWC 758 are
-
•
CQ Tau apparently has a lower UV field than MWC 758, by a factor 10 to 30 (see Sec.5.2)
-
•
The UV attenuation is most likely larger in MWC 758 than in CQ Tau, because of the larger density and the (slightly) smaller grains (as its value is larger).
-
•
The smaller grains in MWC 758 lead to a higher dust temperature, although the effect is expected to be small (e.g. Kruegel & Siebenmorgen, 1994).
-
•
The larger densities in MWC 758 result in a more efficient gas-grain coupling, as the coupling constant for thermal exchange
(2) (see Burke & Hollenbach, 1983), where we assume the grain size distribution has an exponent .
-
•
The above equation also indicates that smaller grains in MWC 758 also result in a more efficient gas-grain coupling.
Can these differences explain the lower gas temperature in MWC 758? In addition to the above effects, dust sedimentation may play a role. If dust grains are more sedimented in CQ Tau, the gas-grain coupling will be less efficient, and this may preserve a higher temperature of the gas above the disk mid-plane.
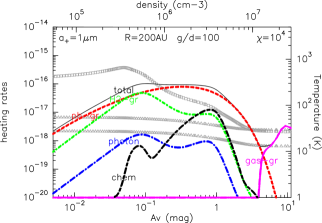
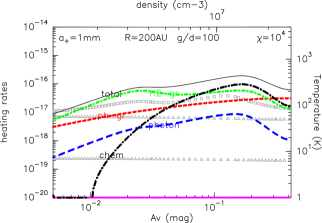
The magnitude of these effects is difficult to evaluate without detailed modeling. Figure 9 indicates the heating/cooling rates for a disk with a (dust) surface density compatible with that of MWC 758 as computed in our models. In this figure, the “chemical” heating rate is the total energy released by chemical reactions: one of the prime energy source for these is actually cosmic-rays through dissociative recombination ion-neutral reactions, the primary ions being produced by cosmic-rays. Note that it is probably an upper-limit (see Le Petit et al., 2006, section 6.1.5). The direct heating by cosmic-rays is too low to appear here.
 |
 |
 |
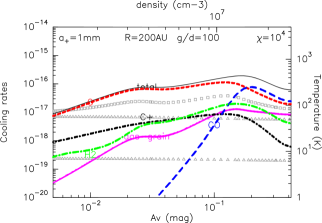 |
Taken at face value, the results of the thermal balance study would favor the low solution (i.e. ), which results in a somewhat more efficient cooling. Reducing even further the ratio () results in higher gas temperature because the gas is then mostly heated by H2 formation and photoelectric effect on grains. However, there are several significant uncertainties in our modeling procedure. For example, the amount of small grains which controls the photo-electric heating (Bakes & Tielens, 1994) is poorly constrained, so the efficiency of this process may be overestimated in our model. Similarly, the gas-grain coupling is dominated by the small grains, because of their larger cross section and higher temperature, and remains also rather uncertain. Furthermore, we use a very crude approximation for the diffusion of UV photons towards the disk plane, and even the unattenuated UV flux is uncertain (see Sec.5.2). Note that the photodissociation is totally dominated by the UV excess, while the stellar UV flux will play a role in the heating processes.
In fact, the situation of CQ Tau and MWC 758 is comparable to that of BP Tau, where Dutrey et al. (2003) have found warm, optically thin CO, with a very low “apparent” abundance (of order 10-6). It is thus tempting to interpret BP Tau in the same framework of CO photodissociation by the UV. This possibility is further supported by the fact that BP Tau is a very active T Tauri star, with a large accretion rate (/yr, see e.g. Bertout et al., 1988; Gullbring et al., 1996).
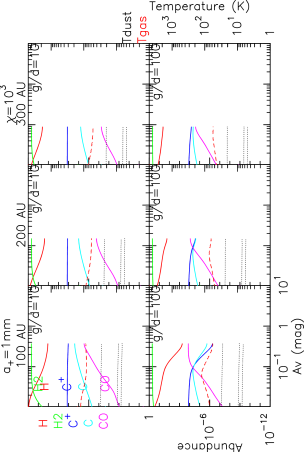
5.4 An alternative: Grain growth by ice mantle accretion
We have not explored so far the possibility that Carbon (and Oxygen too) nuclei are locked into grains. The gas temperature determines whether gaseous components can stick onto grains, while the dust temperature determines whether ices can evaporate. In both sources, the gas is warm enough to avoid new CO molecules to stick on grains. However, a fraction of C and O nuclei can nevertheless remain trapped in grains, as discussed below.
This can happen if Carbon has been removed from the gas phase through the building of ice mantles onto grains. Such a process does not change the dust mass significantly (at most a factor 2 with standard elemental abundances), and changes even less the grain sizes. However, it removes selectively from the gas heavy nuclei with respect to Hydrogen. It is then conceivable to have a low CO / dust ratio. The difficulty of such a possibility is the thermal history of the dust and gas during the disk evolution. The dust must have been cold enough to accrete CO, which is the main reservoir of Carbon, and not released later, either thermally or by photo-desorption due to the enhanced UV field.
This can happen if the CO is converted onto grains into other species (such as H2CO or CH3OH) with larger desorption temperature.
In this respect, it is worth noting that in our simulations, the temperatures of the big grains are low enough (around 10 K) to prevent CO from being thermally evaporated. In a dynamical process where the small grains build up ice mantles, and then grow by coagulation to form larger and larger grains, the bulk of the CO trapped on grains will end up in the large grains, which contains most of the mass. Hence, despite the apparent ”large” gas temperature traced by CO, a substantial fraction of C and O may be actually depleted onto grains. In this explanation, the apparently low CO to dust ratio would not imply a low ratio, but strong C and O depletion like in disks around T Tau stars.
The achieved depletion depend on the past thermal history but also critically on the grain growth processes. The maximal depletion depends on the dust mass fraction in grains which are large enough to remain below the CO desorption temperature.
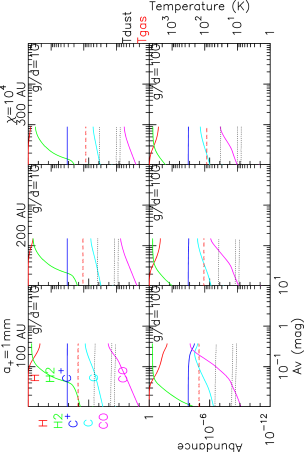
We have computed some models with such depleted elemental abundances. As expected, the CO abundance reflects the elemental depletion (see Figure 10). Note that the gas remains warm even in the “dense” case (factor 3 in density compared to the previous models).
A possible way to check this hypothesis would be a direct measurement of the mm dust temperature. The only such available measurement is for MWC 480 by Piétu et al. (2006), who indeed found a very low dust temperature in this source, much lower than found from the SED fitting, and perhaps as low as 10 K near 100 AU. Although this can be attributed to vertical temperature gradients, the temperature dependence on the grain size may also play a role in explaining such a large difference.
5.5 The pending UX Ori Problem for CQ Tau
The large photometric variations observed in CQ Tau classify it as an UXOr variable, and have been interpreted as due to variable extinction. The accurate determination of the inclination of CQ Tau challenges this interpretation since UX Ori phenomenon can only be observed if the disk inclination is larger than (Natta et al., 1997; Natta & Whitney, 2000).
Eisner et al. (2004) have measured the distribution of the NIR emission from the disks of CQ Tau and MWC 758 using the PTI interferometer. For CQ Tau, they find a position angle for the disk axis 333 Eisner et al. (2004) give the PA of the emission major axis whereas we indicate the PA of the disk axis of and (for MWC 758, they find PA and ). Taken at face value, this indicates that the orientation and inclination of the two inner disks differ markedly from that of the outer disks, sampled by CO, the axes being separated by . One possibility would be that the inner disk is warped due to dynamical interactions with (yet undetected) inner bodies, as in the case of the more evolved disk of Pictoris (Mouillet et al., 1997). Such large warps have never been observed so far. In the case of the spectroscopic binary UZ Tau-E, for which Simon et al. (2000) suggested a mis-alignment between the orbit and the surrounding disk by a similar amount, a recent re-evaluation of the binary orbit (Prato et al., 2002) concludes that the orbit and disk planes are aligned to within 4 degrees. In all confirmed cases, disk warps are small: only a few degrees in Pic for example.
Moreover, the inner disk results are based on very few interferometric data points: a confirmation of theses values would be required before one can seriously invoke such large disk warps.
6 Summary
Using the IRAM array, we have observed in continuum and CO J=2-1 and J=1-0 the disk surrounding MWC758 and in CO J=2-1 that of CQ Tau. We also got upper limits in HCO+ J=1-0 in both sources. We detected the dust and gas emission and were able to derive their physical conditions applying a standard disk model. In both cases, we found two relatively small CO and dust disks compared to those observed and analyzed so far around other Herbig Ae stars such as AB Aur, MWC 480 or HD 34282. We also used the PDR model developed by the Meudon Group in order to qualitatively interpret the observed CO abundances. Our main results are:
-
•
The two disks have partly optically thin CO J=2-1 line and high CO depletion factor with respect to H2 of the order . We also found a similar lower limit on the ratio []/[HCO+] . In both cases, their CO surface densities fall down faster than the dust surface density. The dust emissivity spectral index is of the same order with , implying grain sizes up to a few mm.
-
•
The main difference between the two disks is the temperature. The disk orbiting CQ Tau is the hottest one observed so far with T K, while the MWC 758 disk is not as warm, with T K.
-
•
Although the disk masses are uncertain, due to distance ambiguities and, in CQ Tau, to limited knowledge of the temperature, they appear lower than those of similar objects studied so far such as MWC 480, HD 163296, and HD 34282
-
•
We found that change in UV opacity due to grain growth, and thus the resulting enhancement of the UV penetration, is a major process to explain the low CO column densities.
-
•
An important uncertainty in the PDR model resides in the estimate of the UV field intercepted by the disk. The amount of stellar UV photons is too small to produce the required CO photodissociation. The stars must be accreting to produce a sufficient UV excess. Since the accretion rates and the UV fields are both poorly known for most similar sources, this remains a limiting factor for chemical modeling of disks.
-
•
CQ Tau may be explained by a high UV flux and a normal ratio. However, obtaining column densities just around cm-2 requires a rather fine balance between incident UV flux and UV penetration.
-
•
The lower gas temperature of MWC 758 is not well reproduced by the PDR model. A reduced ratio may be favored for this source. Alternatively, the uncertainties in the overall thermal balance modeling may be the cause of the discrepancy.
-
•
Although the observed CO gas is too warm to allow sticking onto grains, we find that the temperature of large grains to be low enough to prevent CO from being released from the grain surfaces. The apparent low CO to dust ratio may thus be the result of the disk thermal history.
-
•
Finally, the inclination angle we measured in the outer disk of CQ Tau () appears to be incompatible with the fact that this object is classified as an UX Ori star. One possibility left is that the inner disk is warped due to dynamical interactions with large bodies. Accurate determinations of the inclination of the inner and outer disks in more UXOr are required to progress in resolving this issue.
Our study clearly indicates that a low apparent CO to dust ratio does not necessarily imply a low H2 to dust ratio, and thus that CO is not an unambiguous tracer of gas dispersal.
Acknowledgements.
This research made use of the SIMBAD database, operated at CDS, Strasbourg, France. We acknowledge all the Plateau de Bure IRAM staff for their help during the observations. We thank Pierre Hily-Blant for his modifications of a previous version of the PDR code. We also acknowledge Franck Le Petit for many fruitful discussions about the PDR code. Thierry Forveille kindly provided us with the CO J=1-0, and Gail Schaeffer helped with its initial processing. The FUSE spectrum was provided by Claire Martin-Zaïdi. This research was supported by the INSU program PCMI.References
- Bakes & Tielens (1994) Bakes, E. L. O. & Tielens, A. G. G. M. 1994, ApJ, 427, 822
- Beckwith et al. (1990) Beckwith, S. V. W., Sargent, A. I., Chini, R. S., & Guesten, R. 1990, AJ, 99, 924
- Bertout et al. (1988) Bertout, C., Basri, G., & Bouvier, J. 1988, ApJ, 330, 350
- Beskrovnaya et al. (1999) Beskrovnaya, N. G., Pogodin, M. A., Miroshnichenko, A. S., et al. 1999, A&A, 343, 163
- Boehm & Catala (1995) Boehm, T. & Catala, C. 1995, A&A, 301, 155
- Burke & Hollenbach (1983) Burke, J. R. & Hollenbach, D. J. 1983, ApJ, 265, 223
- Burton et al. (1990) Burton, M. G., Hollenbach, D. J., & Tielens, A. G. G. M. 1990, ApJ, 365, 620
- Creech-Eakman et al. (2002) Creech-Eakman, M. J., Chiang, E. I., Joung, R. M. K., Blake, G. A., & van Dishoeck, E. F. 2002, A&A, 385, 546
- Dartois et al. (2003) Dartois, E., Dutrey, A., & Guilloteau, S. 2003, A&A, 399, 773
- Dent et al. (2005) Dent, W. R. F., Greaves, J. S., & Coulson, I. M. 2005, MNRAS, 359, 663
- Doucet et al. (2006) Doucet, C., Pantin, E., Lagage, P. O., & Dullemond, C. P. 2006, A&A, 460, 117
- Draine (2006) Draine, B. T. 2006, ApJ, 636, 1114
- Dutrey et al. (2007) Dutrey, A., Guilloteau, S., & Ho, P. 2007, in Protostars and Planets V, ed. B. Reipurth, D. Jewitt, & K. Keil, 495–506
- Dutrey et al. (2003) Dutrey, A., Guilloteau, S., & Simon, M. 2003, A&A, 402, 1003
- Eisner et al. (2004) Eisner, J. A., Lane, B. F., Hillenbrand, L. A., Akeson, R. L., & Sargent, A. I. 2004, ApJ, 613, 1049
- Goicoechea et al. (2006) Goicoechea, J. R., Pety, J., Gerin, M., et al. 2006, A&A, 456, 565
- Grady et al. (2005) Grady, C. A., Woodgate, B. E., Bowers, C. W., et al. 2005, ApJ, 630, 958
- Grinin et al. (2008) Grinin, V. P., Barsunova, O. Y., Shugarov, S. Y., Kroll, P., & Sergeev, S. G. 2008, Astrophysics, 51, 1
- Guilloteau & Dutrey (1998) Guilloteau, S. & Dutrey, A. 1998, A&A, 339, 467
- Guilloteau et al. (2008) Guilloteau, S., Dutrey, A., Pety, J., & Gueth, F. 2008, A&A, 478, L31
- Gullbring et al. (1996) Gullbring, E., Barwig, H., Chen, P. S., Gahm, G. F., & Bao, M. X. 1996, A&A, 307, 791
- Habing (1968) Habing, H. J. 1968, Bull. Astron. Inst. Netherlands, 19, 421
- Hily-Blant et al. (2008) Hily-Blant, P., Dartois, E., Roueff, E., et al. 2008, A&A, submitted
- Isella et al. (2007) Isella, A., Testi, L., Natta, A., et al. 2007, A&A, 469, 213
- Jansen et al. (1995) Jansen, D. J., van Dishoeck, E. F., Black, J. H., Spaans, M., & Sosin, C. 1995, A&A, 302, 223
- Jonkheid et al. (2007) Jonkheid, B., Dullemond, C. P., Hogerheijde, M. R., & van Dishoeck, E. F. 2007, A&A, 463, 203
- Jonkheid et al. (2004) Jonkheid, B., Faas, F. G. A., van Zadelhoff, G.-J., & van Dishoeck, E. F. 2004, A&A, 428, 511
- Kruegel & Siebenmorgen (1994) Kruegel, E. & Siebenmorgen, R. 1994, A&A, 288, 929
- Le Bourlot et al. (1993) Le Bourlot, J., Pineau Des Forets, G., Roueff, E., & Flower, D. R. 1993, A&A, 267, 233
- Le Petit et al. (2006) Le Petit, F., Nehmé, C., Le Bourlot, J., & Roueff, E. 2006, ApJS, 164, 506
- Lin et al. (2006) Lin, S.-Y., Ohashi, N., Lim, J., et al. 2006, ApJ, 645, 1297
- Mannings & Sargent (1997) Mannings, V. & Sargent, A. I. 1997, ApJ, 490, 792
- Mannings & Sargent (2000) Mannings, V. & Sargent, A. I. 2000, ApJ, 529, 391
- Martin-Zaïdi (2005) Martin-Zaïdi, C. 2005, PhD thesis, Université de Provence (Aix-Marseille I)
- Mathis (1994) Mathis, J. S. 1994, ApJ, 422, 176
- Mora et al. (2001) Mora, A., Merín, B., Solano, E., et al. 2001, A&A, 378, 116
- Mouillet et al. (1997) Mouillet, D., Larwood, J. D., Papaloizou, J. C. B., & Lagrange, A. M. 1997, MNRAS, 292, 896
- Natta et al. (1997) Natta, A., Grinin, V. P., Mannings, V., & Ungerechts, H. 1997, ApJ, 491, 885
- Natta et al. (2001) Natta, A., Prusti, T., Neri, R., et al. 2001, A&A, 371, 186
- Natta & Whitney (2000) Natta, A. & Whitney, B. A. 2000, A&A, 364, 633
- Ohishi et al. (1992) Ohishi, M., Irvine, W. M., & Kaifu, N. 1992, in IAU Symposium, Vol. 150, Astrochemistry of Cosmic Phenomena, ed. P. D. Singh, 171–+
- Pety (2005) Pety, J. 2005, in SF2A-2005: Semaine de l’Astrophysique Francaise, ed. F. Casoli, T. Contini, J. M. Hameury, & L. Pagani, 721–+
- Piétu et al. (2003) Piétu, V., Dutrey, A., & Kahane, C. 2003, A&A, 398, 565
- Piétu et al. (2007) Piétu, V., Dutrey, A., & Guilloteau, S. 2007, A&A, 467, 163
- Piétu et al. (2006) Piétu, V., Dutrey, A., Guilloteau, S., Chapillon, E., & Pety, J. 2006, A&A, 460, L43
- Piétu et al. (2005) Piétu, V., Guilloteau, S., & Dutrey, A. 2005, A&A, 443, 945
- Prato et al. (2002) Prato, L., Simon, M., Mazeh, T., Zucker, S., & McLean, I. S. 2002, ApJ, 579, L99
- Siess et al. (2000) Siess, L., Dufour, E., & Forestini, M. 2000, A&A, 358, 593
- Simon et al. (2000) Simon, M., Dutrey, A., & Guilloteau, S. 2000, ApJ, 545, 1034
- Sternberg & Dalgarno (1995) Sternberg, A. & Dalgarno, A. 1995, ApJS, 99, 565
- Testi et al. (2001) Testi, L., Natta, A., Shepherd, D. S., & Wilner, D. J. 2001, ApJ, 554, 1087
- Testi et al. (2003) Testi, L., Natta, A., Shepherd, D. S., & Wilner, D. J. 2003, A&A, 403, 323
- The et al. (1994) The, P. S., de Winter, D., & Perez, M. R. 1994, A&AS, 104, 315
- van den Ancker et al. (1998) van den Ancker, M. E., de Winter, D., & Tjin A Djie, H. R. E. 1998, A&A, 330, 145
- van Dishoeck et al. (2006) van Dishoeck, E. F., Jonkheid, B., & van Hemert, M. C. 2006, Faraday Discuss., 133, 231
- van Zadelhoff et al. (2003) van Zadelhoff, G.-J., Aikawa, Y., Hogerheijde, M. R., & van Dishoeck, E. F. 2003, A&A, 397, 789
Appendix A The Extinction Curve with Grain Growth
The extinction curves for several can be seen on figure 11. The peak around m is due to small graphite grains (Mathis 1994), the feature around m is due to silicates. The curve for = crosses the one for = cm at m, and the AV extinction is calculated at m. This explains why the NH/AV ratios for these two dust size distributions are so similar (table 6).
| a+ (m) | NH/AV | a+ (m) | NH/AV | a+ (m) | NH/AV |
|---|---|---|---|---|---|
| 1 | 4.02 | 5 | 3.66 | 1 | 4.86 |
| 5 | 3.08 | 1 | 5.07 | 5 | 1.08 |
| 1 | 1.80 | 5 | 1.10 | 1 | 1.53 |
| 5 | 1.43 | 1 | 1.55 | 5 | 3.42 |
| 1 | 1.82 | 5 | 3.44 |
ratio as a function of the maximum radius of the grain size distribution for a gas to dust ratio of 100, = 3nm and .

When the grains are bigger the opacity in the mid-plane is smaller so that the photo-dissociation layer is more extended toward the mid-plane and CO is less abundant (Figure 12). In the case of relatively big grains (= 10 m) with a gas to dust ratio of 10 C+ is the dominant form of carbon in the mid-plane for R 200 AU. The radial distribution if the column density are presented on figure 13.
 |
 |
 |
 |
 |
 |
 |
 |
Appendix B Effects of UV field
For smaller UV fields, CO is more abundant (figure 14,15). The most important part of the UV spectrum is the one between 900 and 1200 Å where the lines of H2 and CO are, because the self-shielding of CO is important (see the effect for the two gas to dust ratio figure 4). We perform a calculation with a modified UV field to mimic the shape of the spectrum taken by Jonkheid et al. (2007) (a cut-off below 1200 Å) with the standard scaling factor . The H-H2 transition is dramatically affected: it occurs for a visual opacity less than magnitude instead of about for the and magnitude with for the Draine field shape. CO is less affected but the transition C-CO is also shifted towards the low opacity region. However the UV excess in Herbig Ae star is important and the spectrum shape between 912 and 1600 Å (where photodissociation takes place) is quite well represented by a scaled Draine field (see Figure 7).
 |
 |
 |
 |
 |
 |
 |
 |


Appendix C Turbulence
We present here the effect of a multiplication and division by a factor 2 of the Doppler width of H2 lines on the surface density. The effect is maximum in the case of big grains with the thermal balance calculated but remain negligible for the C-bearing species (figure 18).