Nuclear activity in nearby galaxies
Abstract
Aims. Dust enshrouded activity can ideally be studied by mid-infrared (MIR) observations. In order to explore the AGN versus star forming origin of the nuclear MIR emission of galaxies, observations of high spatial resolution are required. Here we report on 11.3 m observations with VISIR at the VLT, reaching spatial resolution (FWHM).
Methods. During the scientific verification of VISIR we have observed a sample of 36 nearby galaxies having a variety of optically classified nuclear activity: 17 black hole driven active galactic nuclei (AGN), 10 starbursts (SBs) and 9 quiet spirals.
Results. 16/17 AGN are detected and unresolved, 5/10 SBs are detected and resolved with structured emission up to a few arcsec, while for 5/10 SB and all 9 quiet nuclei low upper limits are provided. The morphology of the resolved SB nuclei follows that seen at radio frequencies. The compactness of AGN and the extent of the SB nuclei is consistent with predictions from radiative transfer models and with MIR spectra of lower spatial resolution. We explore the nuclear MIR surface brightness as a quantitative measure. While AGN and SB cannot be distinguished with MIR data from 4m class telescopes, our data provide evidence that, up to a distance of 100 Mpc, AGN and SB can well be separated by means of MIR surface brightness when using 8m class telescopes.
Key Words.:
Infrared: galaxies – Galaxies: nuclei – Galaxies: active – Galaxies: spiral1 Introduction
The mid infrared (MIR) luminosity of the central region of galaxies has long been known to be a reliable indicator of activity much less affected by extinction than optical and NIR observations (Rieke & Lebofsky, 1978). The MIR emission traces thermal radiation from hot dust (K) heated either by OB stars or black hole activity. For quasars the presence of a non–thermal synchrotron component is also conceivable. Based on data from the Infrared Space Observatory and the Spitzer Space Telescope, many diagnostics have been proposed to quantify which of the two activity types, starburst or AGN, is dominant. The diagrams include the slope of the IR continuum, the strength of the PAH features, the ratio of high to low ionization lines and the silicate band (Genzel et al. 1998, Laurent et al. 2000, Sturm et al. 2002, Siebenmorgen et al. 2005, Hao et al. 2005, Sturm et al. 2006, Spoon et al. 2007). However, given the small sizes of these telescopes in space, the diagnostics may be contaminated by the contribution from the surrounding galaxy. In order to assess the origin of the nuclear MIR luminosity, high spatial resolution observations from larger ground-based telescopes are required.
In the past, numerous MIR studies have been undertaken to see how compact AGN are as compared to SBs. While observations with 4m class telescopes have been performed for large samples, the spatial resolution and sensitivity mostly limited the studies to a comparison between central ( - ) and extended MIR emission, AGN being relatively more compact than SBs (e.g. Roche et al. 1991, Maiolino et al 1995, Gorjian et al. 2004), and only a few very nearby SBs could be resolved in more detail (e.g. Siebenmorgen et al. 2004, Galliano et al. 2005a using TIMMI2 at the ESO 3.6m telescope). With the advent of MIR facilities at 10m class telescopes a small number of nearby, mostly (ultra)-luminous infrared galaxies have been observed so far, successfully resolving some SBs (Soifer et al. 1999, 2000, 2001 with Keck/MIRLIN, Alonso-Herrero et al. 2006 with Gemini/T-ReCS, Galliano et al. 2005b, Wold et al. 2006 with VLT/VISIR).
Here we report on the science verification results from VISIR, the MIR instrument at the VLT (Lagage et al. 2004). We exploit VISIR’s capabilities to study a sample of bright, nearby spirals and compare the observations with both radiative transfer models and radio-interferometric maps.
2 VISIR science verification observations
A sample of 36 targets with distance Mpc were selected from the catalog of spiral galaxies by Albrecht et al. (2007). This catalog is a complete FIR–selected sample with Jy and includes 168 objects whose CO gas emission and submm emission is well studied. It is based on work previously carried out by Krügel et al. (1990), Chini et al. (1992) and Chini et al. (1995). Following the classification from optical spectroscopy as listed by Albrecht et al. (2007) our sample consists of: i) seventeen AGN, ii) ten starbursts and iii) nine sources classified as normal inactive spirals; their gas mass is comparable to that of the active galaxies in the sample. The median distances of the three sub-samples are similar and between Mpc. The motivation for including the inactive spirals was to search for faint compact MIR emission from low–luminosity nuclear starbursts which so far may have escaped detection in low-resolution observations.
Imaging data through filter PAH2 (11.25 m) were obtained under good and stable weather conditions during VISIR science verification in Oct. 2004 – Feb. 2005. During the observations the optical seeing was and air mass . The pixel scale yields a field of view, and for thermal background subtraction standard observations with on-array chopping and nodding amplitudes of 16′′ each were performed.
In cases where the target could not be identified in the real time display after min integration we switched to another object; otherwise typical integration times were min.
VISIR images sometimes exhibit stripes randomly triggered by a few high gain detector pixels. They are removed by dedicated reduction methods (Pantin et al. 2005). The relatively large number of bad pixels does not permit us to deconvolve the images, but noise filtering could be applied using a wavelet technique described by Starck & Murtagh (2002). In the final images unresolved sources show a FWHM of . Observations were bracketed by photometric standards which are provided by the observatory and used as PSF references. Photometry is derived from multi–aperture analysis on the final image. Achieved absolute photometric uncertainty is better than %. This error estimate is based on internal consistency and monitoring of the calibration observations. Haas et al. (2007) find also good consistency of VISIR 11.25m photometry of 16 Seyferts with other published measurements. In the VISIR observations we achieved a 3 point source detection limit of mJy after 10min. integration. The differential observing technique permits us to detect smooth extended structure of more than , which is half the chopping and nodding amplitude.
The observations are summarized in Tab. 1 where targets are sorted by type, morphological and optical classification. The VISIR 11.25m photometry, resolved area, distance, observing date and total integration time are also given. With the exception of NGC 4418, the AGN observations are listed in a companion paper (Haas et al. 2007).
All but one AGN are detected and remain unresolved. The non-detection of NGC 5427 may be due to chopping in a structure-rich emission as discussed by Haas et al. (2007); this source is excluded from the following discussion. Five out of ten starbursts (SBs) show extended emission on scales of several arcsec. Low upper limits could be achieved for the remaining 5 galaxies classified as SBs and the 9 quiet spirals. Obviously, these galaxies do not have striking hot dust emission heated by nuclear activity. Notably, for 3 out of 5 undetected SBs there is no entry in NED indicating enhanced activity, thus they may actually be rather quiet.
3 MIR morphology of the galactic nucleus
The MIR luminosity of galactic nuclei often originates from a composite of starburst and AGN activity. Observations in the past suggest that the extent of the nuclear MIR emission may be used as an indicator to distinguish between dominance of both activity types. Radiative transfer models (e.g. Siebenmorgen et al. 2004) yield quantitative predictions. Here we compare the VISIR observations with literature data and with model predictions. In addition, we check for resolved sources how far the MIR – radio correspondence holds.
3.1 AGN – core dominated
At resolution Gorjian et al. (2004) detected 62 Seyfert galaxies in the MIR. All their detected sources show a central point source; extended structure was observed in: i) Arp 220, a well-known merger with starburst activity (e.g. Soifer et al. 1999, Spoon et al. 2004); ii) NGC 7469, a composite object with a Seyfert I nucleus and a circumnuclear starburst ring (Krabbe et al. 2001); iii) NGC 1068 where a set of clumps are located in the narrow line region and not associated with the torus (Galliano et al. 2005b); and iv) Mrk1239 where the faint MIR extension claimed by Gorjian et al. (2004) cannot be confirmed by our short exposures. It is unresolved in VLA maps (Thean et al. 2000) and slightly extended in [O III] (Mulchaey et al. 1996). At resolution with TIMMI2, Siebenmorgen et. al. (2004) detected 15 Sy galaxies in the MIR. Their emission is dominated by an unresolved core and for some Seyferts (Cen A (Radomski et al. 2008), Circinus (Roche et al. 2006), NGC 1365, NGC 1386, NGC 4388, NGC 7582 (Wold et al. 2006), NGC 6240) additional faint extended structure is observed which contributes to the total MIR luminosity.
At resolution with VISIR, all 36 Seyferts detected by Horst et al. (2006), Haas et al. (2007) and Horst et al. (2007) remain unresolved. This observation is consistent with predictions of radiative transfer models of the dust emission heated by an AGN. Intensity profiles of AGN dust models give a typical MIR extent of 4pc (FWHM, Fig. 22 in Siebenmorgen et al. 2004). This translates to an angular size of at 10 Mpc and is below the spatial resolution of VISIR. VLTI provides this spatial resolution but has insufficient sensitivity except for a handful of bright AGN, such as NGC 1068 and Circinus which both show a small (few pc) flat central region of warm dust emission, that coincides with the positions of water maser emission for these galaxies (Jaffe et al. 2007). ESO’s Extremely Large Telescope (ELT, 42m) will provide sufficient sensitivity combined with a 5 times higher spatial resolution than the VLT.
3.2 Starburst – extended
All five VISIR detected starbursts show extended nuclear emission of a few arcsec and structures on sub–arcsec scale. Intensity profiles computed with radiative transfer models of dusty starbursts in which massive stars are distributed in a volume with pc radius predict MIR extension of pc (FWHM, Fig. 22 in Siebenmorgen et al. 2004). At a distance of 100 Mpc this translates to an angular size of , the resolution limit of VISIR.
A major result from IRAS was the discovery of a linear correlation between global measured far IR and radio emission of normal galaxies (Helou et al. 1985). The global picture is that IR emission traces thermal emission of dust heated by star light whereas the radio is primarily non–thermal emission from supernovae. Both infrared and radio emission are powered by early type stars, albeit in different evolutionary states: before and during the main sequence phase they heat the dust and after the supernova explosion they produce copious synchrotron emission. This picture, however, cannot explain why the dispersion of this correlation is so small for entire galaxies spanning a wide range in parameters. The physical scale below which this correlation breaks is pc for the Milky Way (Boulanger & Perault 1988), but could not be probed on this scale in detail for external galaxies with existing infrared space missions, e.g. ISO: Xu et al. (1992) or Spitzer: Murphy et al. (2006), because of limited spatial resolution. Giuricin et al. (1994) found that the nuclear MIR emission of spiral galaxies is correlated with the radio emission when probed on scales of .
VLA archive data exist for three of our sources for which we can
compare the radio – MIR correlation by means of radio contour
overlays on the VISIR images. Limitations are: i) the spatial
resolution (FWHM) of the radio maps of compared to
VISIR of and ii) the astrometric uncertainty of our VLT data
(). In the following we discuss the five objects
individually:
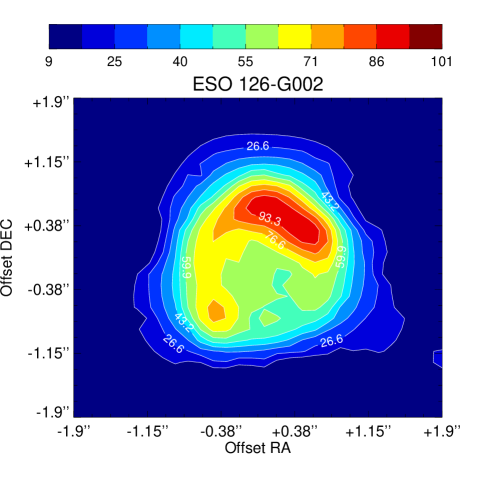
ESO126–G002
In the VISIR image (Fig.1) no central point source is
detected. The MIR emission displays a circumnuclear ring structure
quite similar to that found in NGC 7552 (Siebenmorgen et
al. 2004). Striking emission clumps are seen NW and a fainter
one SE from the center.
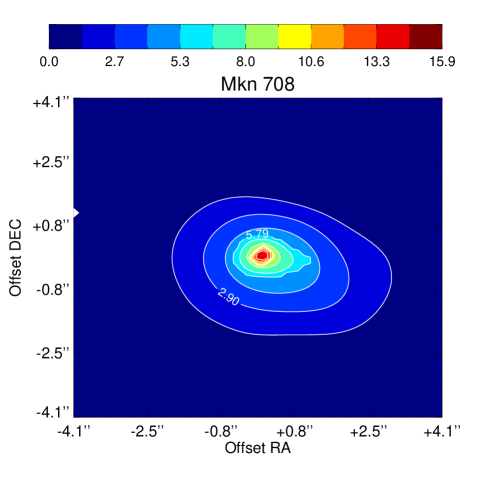
Mkn 708 (NGC 2966)
The VISIR image (Fig.1) displays a central point source on
top of a emission structure, extending West. The
central core has a flux of 15mJy, consistent with previous upper
limits (Siebenmorgen et al. 2004). The extended component gives 70%
of the total MIR luminosity and therefore we classify the nucleus as
starburst dominated.
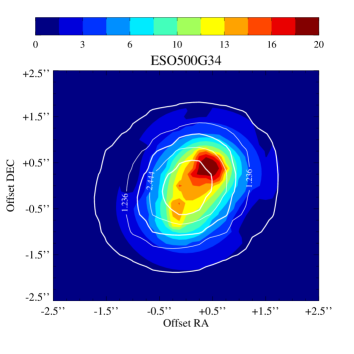
ESO500-G034
Optical spectra (Hill et al. 1999) classify ESO500-G034 as an
intermediate object between AGN and starburst. Kewley et al. (2000)
detect a compact radio core which argues for AGN rather than starburst
heating of the dust.
However the radio core remained unconfirmed in images by
Corbett et al. (2002). The astrometric precision of our observation
does not allow to locate the radio core in the VISIR image. The MIR
image (Fig.2) displays a nuclear
extension. A dominant emission component is detected to the NW
from the nominal central position. It is resolved and contributes only
to the luminosity observed with VISIR. A second
fainter clump is seen South. The beam size of the 6cm VLA map
is (FWHM) and cannot resolve the nuclear components. In the
outer parts radio and MIR emission is correlated. As no dominant and
unresolved luminosity component is detected we classify the MIR
emission to be mainly starburst heated.
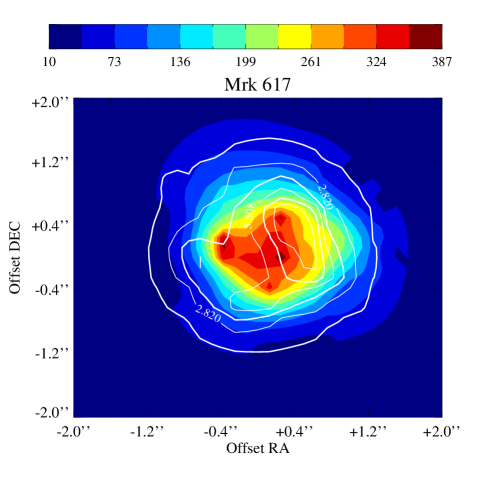
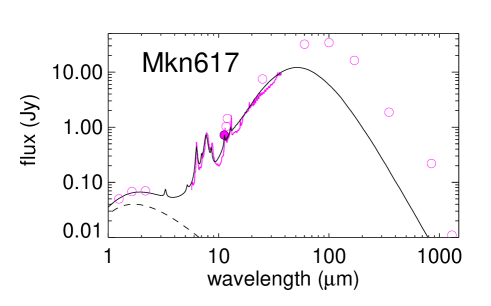
Mkn 617
This is a strongly interacting galaxy in a late stage of the merging
process displaying star forming regions seen in H (Dopita et
al. 2002). X–ray spectroscopy suggests that Mkn 617 may harbor an
obscured AGN (Risaliti et al. 2000). VLBI studies do not detect a
compact radio core (Hill et al. 2001). The 11.7m image by Miles
et al. (1996) gives similar general size as the VISIR image
(Fig.2) but does not resolve the detailed structure of the
central where individual clumps on top of a diffuse component
are detected. The radio emission follows the MIR morphology in the
outer parts but this correlation seems to break in the central
sub–arcsec region. However, differences may also be related to
insufficient spatial resolution in the VLA map having a beam size of
(FWHM).
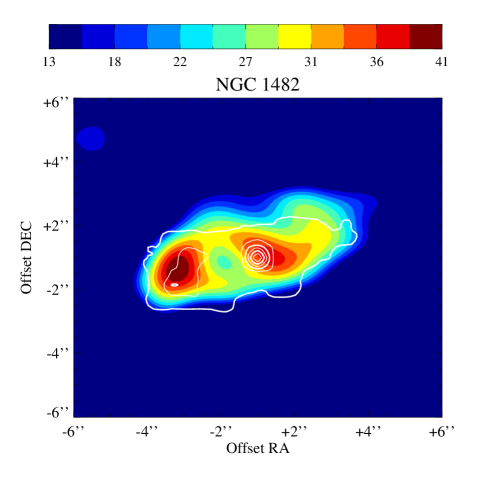
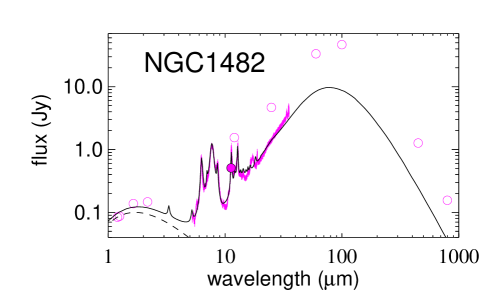
NGC 1482
IRAS observations indicate that NGC 1482 is a warm starburst galaxy
with similar mass and size as M82. Its optical spectroscopic
classification is that of a standard H II galaxy (Kewley et
al. 2001). A multi–frequency radio continuum study is presented by
Hota & Saikia (2005). Strickland et al. (2004) find no sign of AGN
activity in H and X-ray images. The soft X-ray reveals an
outflow with super-wind morphology and strength similar to that seen
in M82. The VISIR image (Fig.2) reveals a double nucleus
with core separation and is well correlated with the 6cm VLA map
observed at (FWHM) resolution.
4 Comparison with SEDs and MIR spectra
In this section we compare the nuclear 11.3 m flux with available MIR spectra and spectral energy distributions (SEDs) of the total galaxies. This comparison also involves radiative transfer calculations.
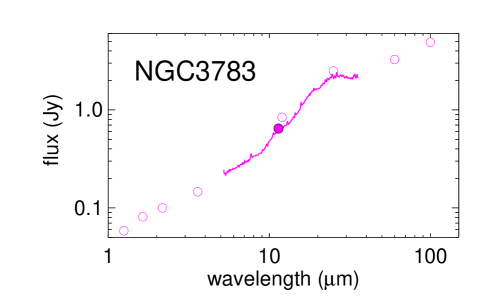
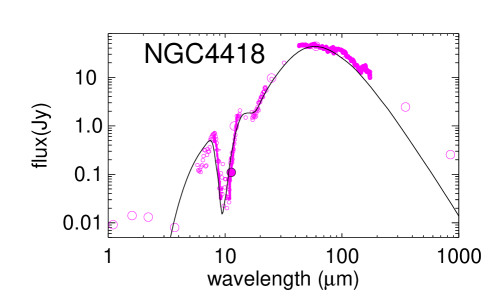
For the AGN we choose NGC 3783 and NGC 4418 and for the starbursts
Mkn 617 and NGC 1482 because of completeness of available
data111 Data of the Seyfert I NGC 3783 are from 2MASS,
3.6m (Rieke 1978), MIR: VISIR 11.25m (this
work), Spitzer (Shi et al. 2006, IRS spectrum reprocessed here) and
IRAS (Sanders et al. 2003). For the Seyfert II NGC 4418 the data are
from NICMOS (Scoville et al. 2000), ISO (Spoon et al. 2001), IRAS
(Sanders et al. 2003), 350m (Benford 1999), 850m (Dunne et
al. 2000), and 1300m (Albrecht et al. 2007). In addition, a MIR
spectrum observed by us at the ESO’s 3.6m with TIMMI2 between
8–13m at spectral resolution of and slit width of is presented, our imaging at 10.4m
with TIMMI2 gives a 3 upper limit of 30mJy. Evans et
al. (2003) reported a 10.3m detection of 86mJy using MIRLIN, but
this value is also inconsistent with the available Spitzer spectrum
(Spoon et al. 2007). Otherwise various photometric data and spectra
agree.
For the starbursts: data of Mkn 617 are from 2MASS (
aperture), 11.7m (Soifer et al. 2001), 11.25m (this work) and Spitzer IRS (Brandl et al. 2006, reprocessed here),
IRAS (Sanders et al. 2003), 160m (Stickel et al. 2004), 350m
(Benford 1999), 450m (Dunne et al. 2000) and 1300m (Albrecht
et al. 2007); and for NGC 1482 in the NIR from Hameed & Devereux
(2005), 2MASS (Spinoglio et al. 1995), 11.25m (this
work), Spitzer IRS (Kennicutt et al. 2003), IRAS (Sanders et
al. 2003), 350m (Chini et al. 1995) and 1300m (Albrecht et
al. 2007). . The AGN are shown in Fig. 3 and the
starbursts in Fig. 4. Consistent with earlier results
(e.g. Laurent et al. 2000, Brandl et al. 2006, Clavel et al. 2000,
Weedmann et al. 2005) we find for our examples that i) PAH emission
bands are strong in starbursts and weak or absent in AGN dominated
galaxies and ii) silicate absorption is strong in starburst and
type II AGN.
The Seyfert II NGC 4418 exhibits strong extinction along a nuclear diameter of less than 50 pc (FWHM, as estimated from the VISIR observations). Using radiative transfer models (Siebenmorgen et al. 2004), the SED can be fit by an AGN heated optically thick dust cloud of mag. Extinction is computed from the outer radius pc to the dust evaporation zone at pc and for simplicity a constant dust density profile is assumed. The model includes a central power–law heating source of L⊙.
The observed nuclear spectra of the starbursts are fitted by the SED model library of starburst nuclei by Siebenmorgen & Krügel (2007) 222 Model parameters are for Mkn 617: luminosity , size pc, extinction mag, ratio of the luminosity of OB stars with hot spots to the total luminosity , density of hot spots ; and for NGC 1482: , pc, mag, , and PAH abundance of 10% of C – which is a factor 5 larger than used for other elements of the SED model library. In order to fit the data below 5m, the starburst models of Mkn 617 and NGC 1482 are supplemented with an old stellar population represented by a black–body of K. . Both starburst models predict a visual extinction of mag, corresponding to mag, so that the dip at 10m is due to silicate absorption and not caused by a blend of PAH emission features. The nuclear starburst emission spectrum is not representative for the total emission of the galaxy; this is most evident at long wavelengths (Fig.4); most of the FIR luminosity is due to large extended cold or even very cold dust emission (e.g. Siebenmorgen et al., 1999). On the other hand in AGN like NGC 4418 most of the emission up to 200 m arises from the central 500 pc region.
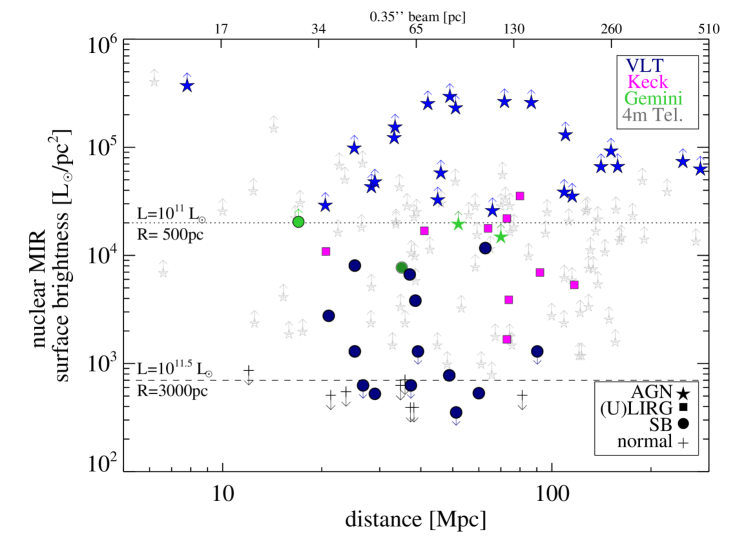
5 Nuclear MIR surface brightness
So far, we have seen that optically classified starburst nuclei are resolved with VISIR, while in AGN the unresolved core remains to dominate the MIR flux. In addition to the qualitative morphology criterion, it is desirable to quantify the effective gain reached, for instance, by VISIR when trying to distinguish between starburst and AGN. Therefore, we consider the nuclear MIR surface brightness of our distance limited (100 Mpc) sample as shown in Fig. 5. For resolved sources without dominant unresolved core an area containing 80% of the flux is used (Tab. 1). For unresolved sources and non-detections an aperture with radius is adopted, leading to lower and upper limits of , respectively. The AGN are supplemented with 9 sources (100 Mpc) observed with VISIR by Horst et al. (2006, 2007). The starbursts are supplemented with 4 resolved objects (Mrk1093, NGC 3256, NGC 6000 and NGC 7552) observed with ESO 3.6m/TIMMI2 by Siebenmorgen et al. (2004). For comparison, also (ultra)-luminous IR galaxies observed with Keck/MIRLIN (Soifer et al. 2000) and Gemini/T-ReCS (Alonso-Herrero et al. 2006, Mason et al. 2007) are shown, albeit these sources are at larger distance. The striking results are:
-
1)
At the spatial resolution of VISIR, AGN and SBs are clearly separated using the nuclear MIR surface brightness as criterion. AGN are seen at (L⊙/pc2) whereas most of the SB a factor lower at L⊙/pc2.
-
2)
The AGN – SB separation is not possible with MIR data from 4m class telescopes, even when adopting the theoretical diffraction limit of FWHM (small gray symbols, data as compiled from Tab. 3 in Haas et al. 2007). The twice larger PSF makes it harder to resolve starbursts and lowers the surface brightness of unresolved sources.
-
3)
SBs populate a surface brightness range around and below that of Orion ( L⊙/pc2). 333We have analysed VISIR archive data of the Orion hot core. Images available are in the pixel scale providing a field (pc2). In this area the mean MIR surface brightness of the Orion hot core is L⊙/pc2. Werner et al. (1976) found in a 5’ far IR map a total luminosity of L⊙ emerging from a region of 0.4pc2. This converts to a MIR surface brightness L⊙/pc2 where we scaled the IR luminosity to that in the VISIR PAH2 filter applying (relation derived using template spectrum).
-
4)
The AGN – SB separation is consistent with predictions from radiative transfer models of starburst galaxies (solid and dotted lines in Fig. 5).
-
5)
The AGN – SB separation appears to hold also when comparing (U)-LIRGs observed with Keck/MIRLIN and Gemini/T-ReCS (data from Soifer et al. 1999, 2000, 2001, Alonso-Herrero et al. 2006, Mason et al. 2007).
-
6)
Normal inactive galaxies have lower nuclear MIR surface brightness than SBs.
The high spatial resolution imaging provides a valuable diagnostic
tool to determine the activity type of a galaxy nucleus. This
diagnostics is limited by the diffraction of the telescope. It can be
used for 8m class telescopes up to distances of Mpc. Indeed, all our detected starbursts show resolved
structures. On the other hand all unresolved sources with nuclear MIR
surface brightness well above L⊙/pc2 are found in
galactic nuclei with optical identified AGN signatures and we classify
their MIR emission as AGN driven. For example, NGC1097, which displays
in the MIR an unresolved core (pc) and a surface brightness of L⊙/pc2, is not AGN driven but heated from an unresolved
star cluster (Mason et al. 2007). The VISIR derived S value of CenA is
consistent with that found with Gemini (Radomski et al. 2008). Other
caveats have to be mentioned for radio loud AGN where synchrotron
radiation may dominate the nuclear MIR emission, e.g. M87 (Whysong &
Antonucci 2004, Perlman et al. 2007) or low luminosity AGN such as
LINERs not investigated here.
Acknowledgements.
This research has made use of the NASA/IPAC Extragalactic Database (NED) and observations with the Spitzer Space Telescope which is operated by the Jet Propulsion Laboratory, California Institute of Technology, under contract with the National Aeronautics and Space Administration. M.H. is supported by the Nordrhein-Westfälische Akademie der Wissenschaften. We thank the anonymous referee for detailed critical suggestions.| Name | type | activity | date | ||||
| (Mpc) | (s) | (mJy) | (pc2) | ||||
| AGN: | |||||||
| NGC 4418 | SAB(s)a | Sy2 | 28.3 | 2005-01-31 | 906 | 110 | |
| Starburst: | |||||||
| ESO091G016 | Sb | ? | 26.7 | 2005-02-02 | 1236 | ||
| ESO126G002 | SB(rs)ab | HII | 38.5 | 2005-01-29 | 1413 | 305 | 325 |
| ESO163G011 | SB(s)bsp | ? | 37.3 | 2005-01-29 | 707 | ||
| ESO500G034 | SB(s)0/a | HII | 48.8 | 2005-01-27 | 1766 | 53 | 380 |
| Mkn 617 | SB(s)c pec | HII | 62.8 | 2004-10-02 | 1843 | 720 | 465 |
| Mkn 708 | SBc | HII | 25.2 | 2005-01-29 | 1236 | 214 | 123 |
| Mkn 708 (core) | 15 | ||||||
| Mkn 1022 | SA pec | SB | 51.2 | 2004-10-02 | 2089 | ||
| NGC 1482 | SA0+ pec | HII | 25.2 | 2004-09-25 | 1186 | 510 | 471 |
| NGC 5258 | SA(s)b pec | HII,LINER | 90.3 | 2005-02-02 | 707 | ||
| NGC 5786 | SAB(s)bc | ? | 39.2 | 2005-02-03 | 538 | ||
| Normal: | |||||||
| ESO061G011 | S | 81.3 | 2005-01-29 | 707 | |||
| ESO093G003 | SAB(r)0/a | 24.5 | 2005-02-01 | 883 | |||
| ESO317G023 | SB(rs)a | 35.8 | 2005-02-01 | 707 | |||
| ESO493G016 | Sb-c | 34.7 | 2005-01-31 | 707 | |||
| NGC 2706 | Sbc? sp | 21.3 | 2005-01-31 | 1060 | |||
| NGC 3318 | SA(sr)b | 37.2 | 2005-01-31 | 1766 | |||
| NGC 3366 | SB(rs)bc | 38.1 | 2005-02-01 | 707 | |||
| NGC 4746 | Sb sp | 23.7 | 2005-01-31 | 883 | |||
| NGC 4900 | SB(rs)c | 12.0 | 2005-02-02 | 707 |
References
- (1) Albrecht M., Krügel E., Chini R., 2007, A&A 462, 575
- (2) Alonso-Herrero A., Colina L., Packham C. et al. 2006, ApJ 652, L83
- (3) Benford D.J., 1999, Thesis, California Institute of Technology
- (4) Boulanger F., Perault M, 1988, ApJ 330, 964
- (5) Brandl B.R., Bernard-Salas J., Spoon H.W.W., et al., 2006, ApJ 653, 1129
- (6) Buchanan C. L., Gallimore J.F., O’Dea C. P., Baum S.A., Axon D.J., 2006, ApJ132, 401
- (7) Chini R., Krügel E., Kreysa E., 1992, A&A 266, 177
- (8) Chini R., Krügel E., Lemke R., Ward-Thompson D., 1995, A&A 295, 317
- (9) Clavel J., Schulz B., Altieri B. et al. 2000, A&A, 357, 839
- (10) Corbett E. A., Norris R. P., Heisler C. A., et al., 2002, ApJ 564, 650
- (11) Dopita M. A., Pereira M., Kewley L.J., Capaccioli, M., 2002, ApJS 143, 47
- (12) Dunne L., Eales S., Edmunds M., et al., 2000, MNRAS 315, 115
- (13) Evans A.S., Becklin E.E., Scoville N.Z., et al., 2003, AJ 125, 2341
- (14) Galliano E., Alloin D., Pantin E., Lagage P. O., Marco O., 2005a, A&A 438, 803
- (15) Galliano E., Alloin D., Pantin E., Lagage P. O., 2005b, MNRAS 363, L1
- (16) Genzel R., et al., 1998, ApJ 498, 579
- (17) Gorjian V., Werner M.W., Jarrett T.H., 2004, ApJ 605, 156
- (18) Giuricin G., Tamburini L., Mardirossian F., Mezzetti F., Monaco P., 1994, ApJ 427, 202
- (19) Hameed S., Devereux N., 2005, AJ 129, 2597
- (20) Hao L., et al., 2005, ApJ 625, L75
- (21) Haas M., Siebenmorgen R., Pantin E., et al., 2007, A&A 473, 369
- (22) Helou G., Soifer B.T., Rowan-Robinson M., 1985, ApJ 298, L7
- (23) Hill T. L., Heisler C.A., Sutherland R., Hunstead R. W., 1999, AJ 117, 111
- (24) Hill T. L., Heisler C. A., Norris R. P., Reynolds J. E., Hunstead R. W., 2001, AJ, 121, 128
- (25) Horst H., Smette A., Poshak G., Duschl W. J., 2006, A&A 457, 17
- (26) Horst H., Poshak G., Smette A., Duschl W. J., 2007, A&A in print.
- (27) Hota A., Saikia D. J., 2005, MNRAS 356, 998
- (28) Jaffe W., Raban D., Röttgering H., Meisenheimer K., Tristram K., 2007, in: The Central Engine of Active Galactic Nuclei, ASP Conference Series, Vol. 373, p.439
- (29) Kennicutt R.C. Jr., Armus L., Bendo G., et al., 2003, PASP 115, 928
- (30) Kewley L.J., Heisler C.A., Dopita M.A., et al., 2000, ApJ 530, 704
- (31) Kewley L.J., Heisler C.A., Dopita M.A., Lumsden S., 2001, ApJS 132, 37
- (32) Krabbe A., Böker T., Maiolino R., 2001, ApJ 557, 626
- (33) Krügel E., Chini R., Steppe H., 1990, A&A 229, 17
- (34) Lagage P.O., Pel J., Authier M., et al., 2004, Messenger 117, 12
- (35) Laurent O., Mirabel I. F., Charmandaris V., et al. 2000, A&A, 359, 887
- (36) Maiolino R., Ruiz M., Rieke G.H., Keller L.D. 1995, ApJ 446, 561
- (37) Mason R.E., Levenson N.A., Packham C., et al., 2007, ApJ 659, 249
- (38) Miles J.W., Houck J.R., Hayward T.L., Ashby M.L.N., 1996, ApJ 465, 191
- (39) Mulchaey J.S, Wilson A.S., Tsvetanov Z., 1996, ApJS 102, 309
- (40) Murphy E.J., Braun R., Helou G., et al., 2006, ApJ 638, 157
- (41) Pantin E., Lagage P.-O., Claret A., et al., 2005, Messenger 119, 25
- (42) Perlman E., Mason R.E., Packham C., et al., 2007, ApJ 663, 808
- (43) Rieke G.H., Lebofsky M., 1978, ApJ 220, L38
- (44) Rieke G.H., 1978, ApJ 226, 550
- (45) Risaliti G., Gilli R., Maiolino R., Salvati M., 2000, A&A, 357, 13
- (46) Roche P., Aitken D., Smith C., Ward M., 1991, MNRAS 248, 606
- (47) Roche P.F., Packham C., Telesco C.M., et al., 2006, MNRAS 367, 1689
- (48) Radomski J.T., Packham C., Levenson N. A., et al., 2008, arXiv:0802.4119
- (49) Sanders D.B., Mazzarella J.M., Kim D.-C., et al., 2003, AJ 126, 1607
- (50) Scoville N. Z., Evans A. S., Thompson R., et al., 2000, AJ, 119, 991
- (51) Shi Y., Rieke G.H., Hines D.C., et al., 2006, ApJ 653, 127
- (52) Siebenmorgen R., Krügel E., Chini, 1999, A&A 351, 495
- (53) Siebenmorgen R., Krügel E., Spoon H. W. W, 2004, A&A 414, 123
- (54) Siebenmorgen R., Haas M., Krügel E., Schulz B., 2005, A&A 436, L5
- (55) Siebenmorgen R., Krügel E., 2007, A&A 461, 445
- (56) Soifer, B. T.; Neugebauer, G.; Matthews, K., et al. 1999, ApJ 513, 207
- (57) Soifer, B. T.; Neugebauer, G.; Matthews, K., et al. 2000, AJ, 119, 509
- (58) Soifer, B. T.; Neugebauer, G.; Matthews, K., 2001, AJ 122, 1213
- (59) Spinoglio L., Malkan M.A., Rush B., Carrasco L., Recillas-Cruz E., 1995, ApJ 453, 616
- (60) Spoon H.W.W., Keane, J. V. Tielens, A.G.G.M., et al., 2001, A&A 365, L353
- (61) Spoon H.W.W., Moorwood A.F.M., Lutz D., et al., 2004, A&A 414, 873
- (62) Spoon H. W. W., Marshall J. A., Houck et al., 2007, ApJ 654, L49
- (63) Starck J.L., Murtagh, F., 2002, Astronomical image and data analysis, Berlin: Springer, 2002, ISBN 3540428852
- (64) Stickel M., Lemke D., Klaas U., et al., 2004, A&A 422, 39
- (65) Strickland D.K., Heckman T.M., Colbert E.J.M., Hoopes C.G., Weaver K.A., 2004, ApJS 151, 193
- (66) Sturm E., Rupke D., Contursi A., et al., 2006, ApJ, 653, L13
- (67) Sturm E., Lutz D., Verma A., et al., 2002, A&A, 393, 821
- (68) Thean A., Pedlar A., Kukula M.J., 2000, MNRAS 314, 573
- (69) Weedman D. W., Hao L., Higdon S.J.U., et al., 2005, ApJ, 633, 706
- (70) Werner M.W., Gatley I., Harper D.A., et al., 1976, ApJ 204, 420
- (71) Wold M., Lacy M., Käufl H.U., Siebenmorgen R., 2006, A&A 460, 449
- (72) Whysong D. & Antonucci R.R., 2004, ApJ 602, 116
- (73) Xu C., Klein U., Meinert D., et al., 1992, A&A 257, 47