Measurements of neutrons produced by high-energy muons at the Boulby Underground Laboratory
H. M. Araújoa,b, J. Blockleyc, C. Bungaub,a, M. J. Carsonc, H. Chaganic, E. Dawc, B. Edwardsa,b, C. Ghagd, E. V. Korolkovac, V. A. Kudryavtsevc 111Corresponding author; address: Department of Physics and Astronomy, University of Sheffield, Sheffield S3 7RH, UK, e-mail: v.kudryavtsev@sheffield.ac.uk, P. K. Lightfootc, A. Lindotee, I. Liubarskyb,a, R. Lüscherb, P. Majewskic, K. Mavrokoridisc, J. E. McMillanc, A. St. J. Murphyd, S. M. Palingc, J. Pinto da Cunhae, R. M. Preeceb, M. Robinsonc, N. J. T. Smithb, P. F. Smithb, N. J. C. Spoonerc, T. J. Sumnera, R. J. Walkera, H. Wangf and J. Whiteg
a Blackett Laboratory, Imperial College London, UK
b Particle Physics Department, STFC Rutherford Appleton
Laboratory, UK
c Department of Physics & Astronomy, University of Sheffield, UK
d School of Physics, University of Edinburgh, UK
e LIP–Coimbra & Department of Physics of the
University of Coimbra, Portugal
f Department of Physics & Astronomy, University of
California, Los Angeles, USA
g Department of Physics, Texas A&M University, USA
Abstract
We present the first measurements of the muon-induced neutron flux at the Boulby Underground Laboratory. The experiment was carried out with an 0.73 tonne liquid scintillator that also served as an anticoincidence system for the ZEPLIN-II direct dark matter search. The experimental method exploited the delayed coincidences between high-energy muon signals and gamma-rays from radiative neutron capture on hydrogen or other elements. The muon-induced neutron rate, defined as the average number of detected neutrons per detected muon, was measured as (stat.) neutrons/muon using neutron-capture signals above 0.55 MeV in a time window of 40-190 s after the muon trigger. Accurate Monte Carlo simulations of the neutron production, transport and detection in a precisely modeled laboratory and experimental setup using the GEANT4 toolkit gave a result 1.8 times higher than the measured value. The difference greatly exceeds all statistical and systematic uncertainties. As the vast majority of neutrons detected in the current setup were produced in lead we evaluated from our measurements the neutron yield in lead as neutrons/muon/(g/cm2) for a mean muon energy of about 260 GeV.
1 Introduction
Background from muon-induced neutrons is one of the most important limitations to detector sensitivity for rare event searches and is largely responsible for the existence of the field of physics called ‘Underground Physics’ and of deep underground laboratories across the world.
In WIMP dark matter detectors nuclear recoils of keV energies originating in neutron elastic scattering mimic WIMP-nucleus interactions. For double-beta decay experiments high-energy neutrons (about a few MeV and above) produce background gamma-rays via inelastic scattering while thermal neutrons contribute to the gamma-ray background via neutron capture accompanied by gamma-ray emission. Neutrons at MeV energies and above also mimic neutrino detection in scintillators via inverse beta decay posing a severe threat to low-energy neutrino experiments (reactor and geo neutrinos). Neutrons at sub-GeV and GeV energies, although rare, constitute the background for proton decay and atmospheric neutrino experiments.
Neutrons from radioactivity originate in spontaneous fission (of 238U mainly) and (,n) reactions on low and intermediate Z isotopes (Z30). Their energies are limited to about 10 MeV. Neutrons from cosmic-ray muons have spectra extending to GeV energies. Although the flux of muon-induced neutrons deep underground is far below that from radioactivity, they can be responsible for a significant background component and limit sensitivity of detectors to rare events due to the following reasons. Firstly, neutrons from radioactivity in rock can be well shielded by hydrogen-rich material, while using ultra-pure materials in detector construction reduces the background from all other components. For muons, however, any material in shielding or detector (except hydrogen) is a target for neutron production. Secondly, as muon-induced neutrons have higher energies, it is much more difficult to moderate and/or absorb them. They can travel far from the muon track or their point of origin reaching detectors from large distances and reducing the efficiency of an anticoincidence system. Any high-A material is also a good target for secondary neutron production from primary neutrons. All this makes the measurements and calculation of muon-induced neutron rate an important task for designing and constructing sensitive detectors for rare event searches.
Neutrons are produced by muons via 4 main processes: i) negative muon capture (relevant only to low-energy, stopping muons, or for shallow depths less than 100 m w. e.); ii) direct muon-induced spallation of a nucleus; iii) photoproduction of neutrons or photon-induced spallation (mainly in electromagnetic cascades initiated by muons); iv) hadroproduction of neutrons (mainly in hadronic or nuclear cascades originated by muons). The relative contribution of different processes in different models have been investigated in Refs. [1, 2].
There were many attempts to measure the neutron fluxes produced by high-energy muons in the laboratories at surface (using accelerators) and underground (see, for example, [3, 4, 5, 6, 7, 8, 9, 10, 11, 12]) and more experiments are planned [13]. Reliable simulations of the expected effects have become possible only recently with the appearance of powerful Monte Carlo codes based on advanced theoretical models, such as FLUKA [14] and GEANT4 [15]. Several measurements of neutron yield in liquid scintillator at different depth [3, 4, 5, 6, 7, 8] are in agreement with FLUKA [14] and GEANT4 [15] within a factor of two or better as discussed in Refs. [16, 1, 2]. Three of them carried out at depths more than 50 m w. e. [3, 4, 5] show higher neutron yield than FLUKA and GEANT4 predictions. The LVD experiment [6] reported smaller neutron yield in scintillator than predicted by either FLUKA or GEANT4. Neutron yield in lead has been reported in Ref. [12] as 0.016 n//(g/cm2) for a mean muon energy of about 310 GeV. This value is two (four) times higher than simulations carried out with the FLUKA (GEANT4) code [2]. Significant excess of neutrons in lead over model predictions was observed also in Ref. [10].
The evaluation of neutron yields from the experimental data, however, is not straightforward and requires, in its turn, detailed Monte Carlo simulation of the setup and all physical processes involved. This is difficult to do now for early experiments since not all details of the setups are known. At the time when these experiments were carried out, the theoretical models and computer codes were not developed to the extent that would allow accurate simulations of the expected effects. So any comparison between old data and simulations should be taken with caution. Hence there is an urgent need for new experimental data on neutron yields in different materials, as well as neutron energy spectra, lateral distributions etc. supported by accurate Monte Carlo simulations with widespread multi-purpose codes or toolkits.
In this paper we describe the measurement of the total neutron yield from cosmic-ray muons carried out at the Boulby Underground Laboratory (Boulby mine, North Yorkshire, UK). This is the first experiment with a large mass of lead as a target for which direct measurements and detailed Monte Carlo are compared directly enabling the test of the models. Our results are relevant to many sensitive underground experiments for rare event searches that use or will use lead as a shielding against gamma-rays from rock and hence expect a large background from neutrons produced by muons and their secondaries in lead.
Due to the relatively simple setup, the systematic uncertainties from geometry, trigger effects etc. are reduced to the minimum allowing, for the first time, accurate calculations of the expected neutron rate using GEANT4 version 8.2.
In Section 2 we describe the detector and data acquisition used in the measurements of the muon-induced neutron flux. Section 3 shows our results. Monte Carlo simulations of the detector setup and physical processes are presented in Section 4. We discuss and compare our results to simulations in Section 5. The conclusions are given in Section 6.
2 Detector, data acquisition and data analysis
The measurements were carried out at the Boulby Underground Laboratory at a depth of about 1070 m or 2850 m w. e. The liquid scintillator of an active veto system working also in anticoincidence with the WIMP dark matter detector ZEPLIN-II [17] was used for muon and neutron detection.
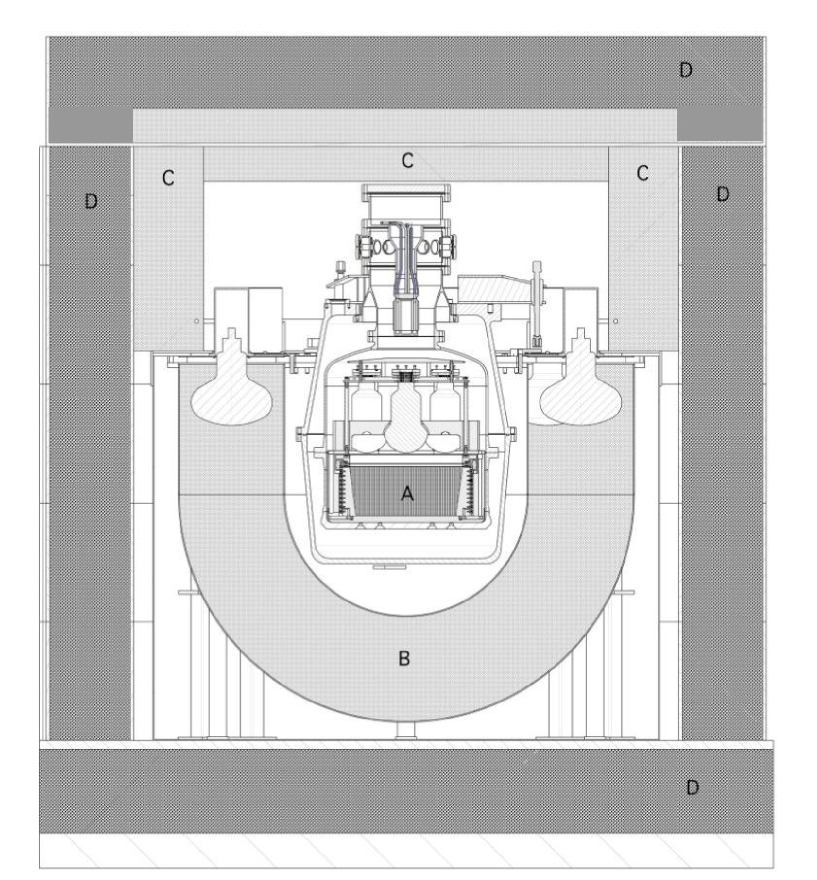
The veto detector (Figure 1) is a hollow structure surrounding the ZEPLIN-II experiment on five sides. The lower part of the detector is hemispherical in shape with an inner radius of 0.35 m and an outer radius of 0.65 m giving a distance between walls of 0.3 m. The upper part is cylindrical in shape with the same inner and outer radii and a height of 0.36 m. The vessel is filled with liquid scintillator based on mineral oil containing approximately 25% of phenyl-o-xylylethane (produced by Elgin). This was chosen primarily for its high flash point due to safety constraints on materials used at Boulby. The scintillator has a density of 0.89 g/cm3, average atomic number of 4.75 and average atomic weight of 8.33. The wavelength of maximum emission is 425 nm and the attenuation length exceeds 2 m. The light output, as specified by the manufacturer, is 57% of that for anthracene. Our calibration carried out using a 60Co gamma-ray source and single photoelectron pulses, revealed a light yield of about 30 photoelectrons per MeV. The volume of the detector is 0.82 m3 giving a total mass of liquid scintillator of 0.73 tonnes. The scintillator is viewed from above by ten 20 cm ETL hemispherical photomultiplier tubes (PMTs). The inner surfaces of the detector are covered in aluminium with a coefficient of reflection greater than 0.9 to maximise light collection. More details about the veto detector and its performance relevant to dark matter searches with ZEPLIN-II can be found in [17].
The veto detector (together with the ZEPLIN-II liquid xenon detector) is surrounded by a ‘castle’ made of lead and designed to shield the ZEPLIN-II dark matter detector from gamma-rays from rock. The thickness of the lead shielding ranges from 15 cm on top to 22.5 cm below the veto and on four sides (Figure 1). The total weight of lead is about 50 metric tonnes making it an excellent target for neutron production.
Another important feature of the setup is the presence of pure and Gd-impregnated wax and polypropylene (about 0.2% of Gd by weight on average) on top of the veto detector under the castle roof. The inner surface of the veto vessel (close to the ZEPLIN-II detector) was also covered with a paint mixed with Gd salt. The purpose of this was to shield the ZEPLIN-II target from neutrons from rock. As we see later, Gd did not help in detecting neutron capture events in the time window used in our measurements. The conclusion may be different for the ZEPLIN-II dark matter detector where the main neutron background is assumed to be originated just around the detector (PMTs, stainless steel vessel etc.).
Part of the data run was carried out without the top (’roof’) lead and wax sections, reducing the total lead target mass by about 12%. This did not have a large impact on neutron production: the neutron event rate was slightly reduced for the time periods without the roof section. The relatively small reduction can be explained by the fact that wax on top of the detector, that could efficiently absorb neutrons, was also removed in those runs together with lead.
All materials of and around the veto detector and their exact locations within the underground laboratory were put into the simulation code based on GEANT4 toolkit [15] as will be described later.
The principle of neutron detection was based on the delayed coincidences between the first, high-energy, pulse from a muon or muon-induced cascade and the delayed second, low-energy, pulse from neutron capture gamma(s). The electronics and data acquisition system were designed for this purpose.
Signals from the ten PMTs were passed through discriminators and a coincident unit. The unit generated a logic pulse if the amplitudes of the analogue pulses from three or more PMTs exceeded an average amplitude of one photoelectron within 150 ns. The logic pulses were used in the off-line analysis to identify ‘true’ pulses and reject noise and other background pulses caused by radioactivity close to a single PMT (for instance on the PMT window) without coincidences with any other PMT.
Analogue signals from all ten PMTs were summed together by an adder and the sum signal was fed into a waveform digitiser sampling at a rate of 500 MHz. The sum pulse was digitised at two different amplitude ranges: 0.5 V and 5 V. The first range was used primarily for low-energy pulses from neutron capture gamma-rays, while the large range was important for identifying muon events. The adder had a range of about 2 V. All pulses with amplitude exceeding this limit were truncated. The gamma-ray spectrum from natural radioactivity extends to a few MeV corresponding to less than 1 V (the energy calibration procedure is described in Section 3). Taking into account the non-uniform light collection, the gamma-ray spectrum extends to almost 2 V in amplitude. The minimum thickness of the scintillator in the vertical direction is 30 cm or 26.7 g/cm2. A muon crossing this thickness of scintillator deposits on average about 50 MeV which is far above the saturation level of the adder. So practically all muon pulses were saturated (truncated) with the exception of some fraction of events with muons cutting edges of the detector or events caused by low-energy secondaries. This feature was used in the selection procedure for muon events.
In the ‘data’ run the trigger to the DAQ was provided by large analogue pulses exceeding about 1.2 V. This corresponded approximately to 10 MeV energy deposition in the detector. The rate of recorded events in the data run was a few events/hour consisting of muons and a tail of gamma events seen at higher energies due to their location close to PMTs. The 5 s and 195 s time periods before and after the trigger pulse, respectively, were digitised allowing for the delayed pulse from neutron capture to be recorded.
The logic pulse, generated by the coincidence unit if at least three PMT hits were above the threshold equivalent to an average amplitude of a single photoelectron, was also recorded on the same waveform 100 ns after the start of the analogue pulse. Only analogue signals accompanied by logic pulses were considered in the off-line data analysis.
Event waveforms were parameterised using the data reduction code similar to those written for the neutron measurements from radioactivity in rock described in Ref. [18] and for the ZEPLIN-II experiment [19]. For each pulse on the waveform, the area (proportional to the charge and, hence, deposited energy), amplitude, width, mean time, full width at half maximum (FWHM) and arrival time were recorded. In addition, the charge in the first 20 ns from the beginning of the pulse and the time during which the amplitude of the pulse exceeded a pre-defined threshold of 1.7 V were calculated. The last parameter was particularly important for identifying muon events since an accurate measurement of the muon energy deposition was impossible due to the adder saturation. (Even without this effect it would be impossible for PMTs and DAQ to cover with equal precision the MeV range relevant for gamma-rays from neutron capture and tens of MeV or higher energy depositions from muons and cascades.)
Only pulses that exceeded 0.02 V in amplitude (equivalent to approximately 200 keV energy deposition) and were accompanied by a logic pulse, were selected for further analysis.
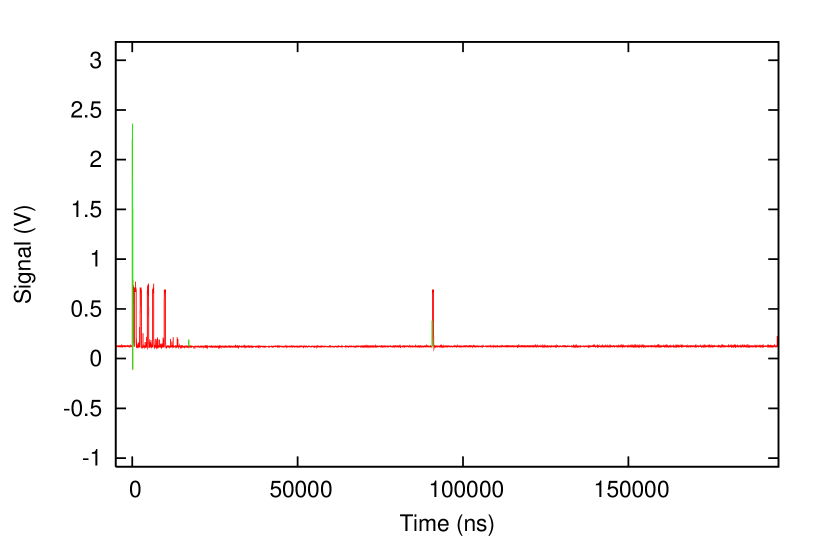
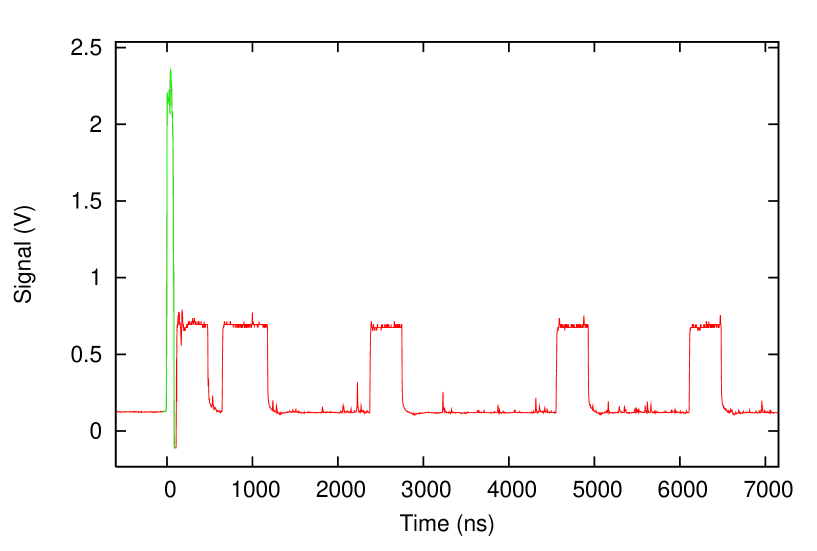
Figure 2 shows a typical waveform for a muon-induced neutron event. Figure 3 displays the time period of about 8 s around the trigger. The muon pulse occurs at a trigger time ns. It is characterised by a nearly flat top part (effect of adder saturation resulting in pulse truncation), large width (both mean time and FWHM) and the presence of many afterpulses during the first 15-20 s after it. Logic pulses are those with a width of about 0.4 s and an amplitude of 0.6 V. As the dynamic range of the PMTs was chosen for the best sensitivity to MeV energy depositions, higher energy muon pulses saturated PMTs resulting in a large number of afterpulses. Some afterpulses from different PMTs coincided in time producing logic pulses. The presence of this ‘forest’ of afterpulses made impossible any analysis of neutron captures that could occur within the first 15 s after a muon. Only delayed pulses in the time period of 15-195 s after the trigger were analysed by the data reduction code. This selection suppresses the detection of gammas from neutron capture on Gd. The two isotopes of Gd have very high neutron capture cross-section and, hence, the small mean time delay for neutron capture, about 15 s for 0.2% of Gd, while the analysis of secondary pulses from neutron capture started only 15 s after the muon signal. A typical pulse from neutron capture gamma-ray(s) is shown in Figure 2 at a time of about 90 s. Due to the large time window and small amplitude of the analogue pulse, only the logic pulse can be seen.
From all pulses found on the waveform in the time window 15-195 s after the muon trigger, only 20 with highest charge were recorded. This had some effect on the number of detected neutrons since simulations showed that multiplicities larger than 20 could also be observed. Hence the maximum detected multiplicity is 20 for 15-195 s time window. This effect will be studied later.
3 Experimental results
3.1 Calibrations
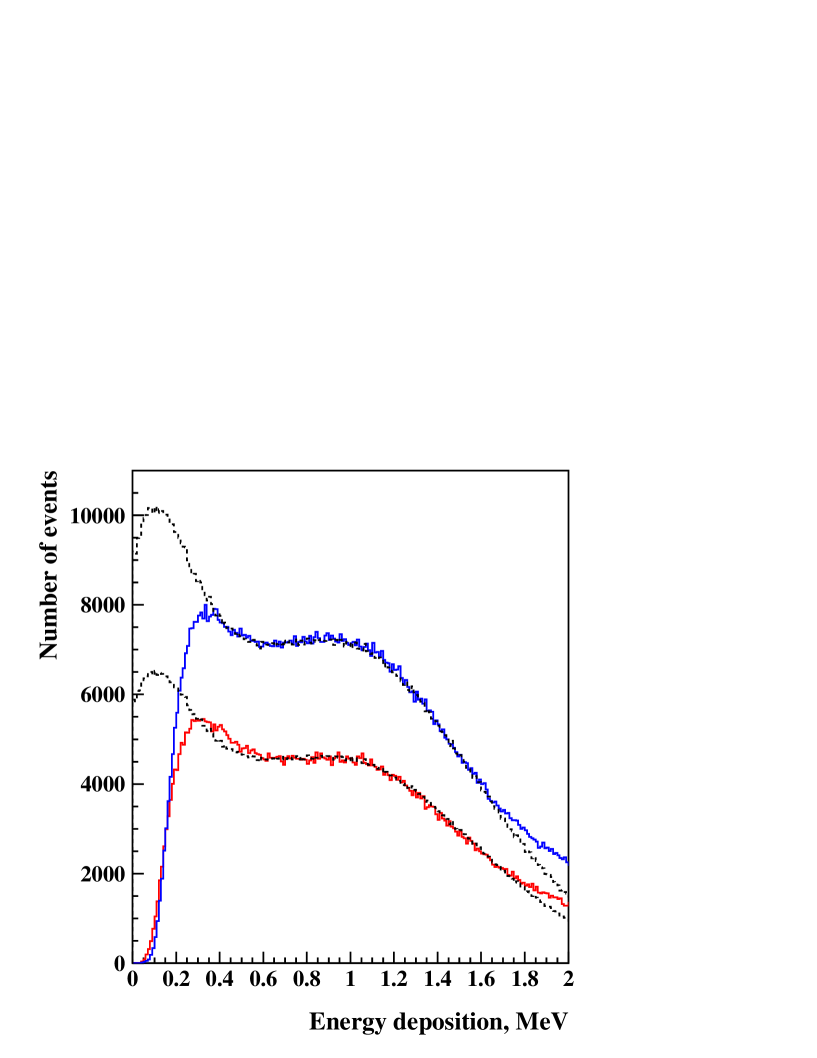
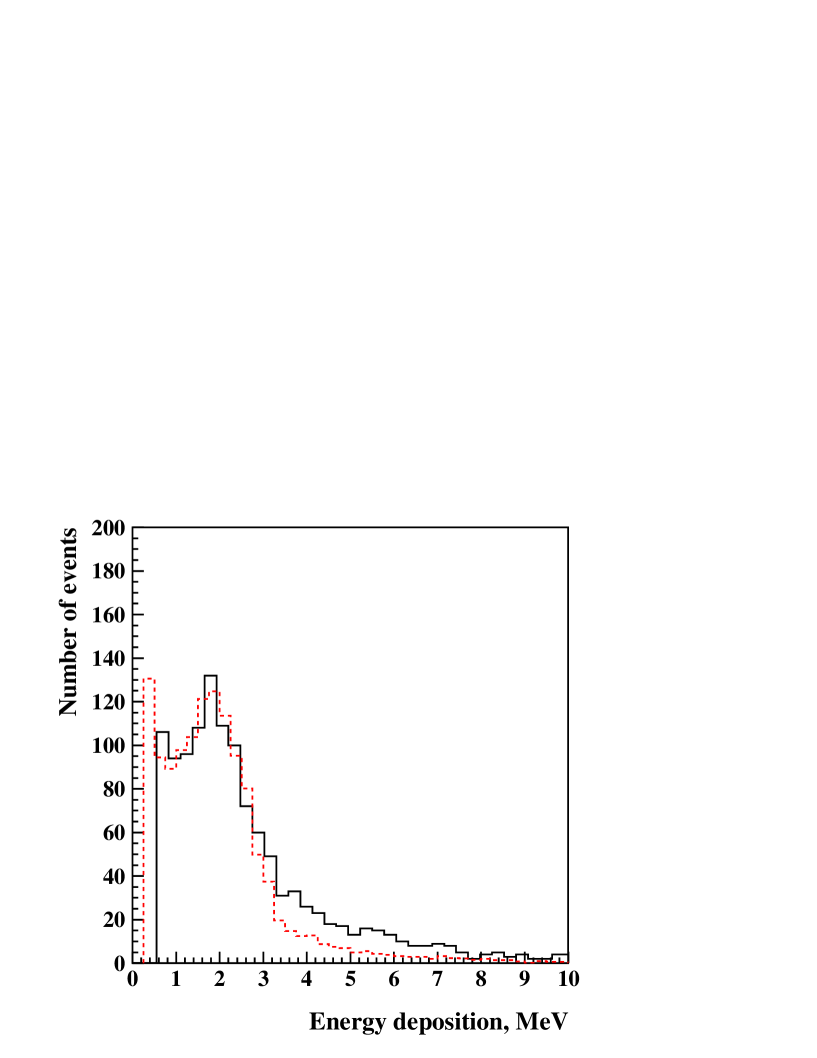
Two types of detector calibration were carried out: energy calibration with a gamma-ray source and calibration with a neutron source. Energy calibrations with 60Co gamma-ray source were performed at the beginning of the long data run and at the end of the experiment. They allowed us to determine the energy scale for events, namely, the conversion from the area of a pulse to the energy deposited in the detector. In the energy calibration run only 1 s of the waveform was recorded since only one pulse without any delayed coincidences was expected from gamma-rays. The amplitude threshold for the DAQ was reduced to about 0.4 V allowing triggering on the logic pulse and detecting analogue pulses with smaller amplitudes. Figure 4 shows the energy spectra of events from 60Co gamma-ray source collected at the beginning and at the end of the data run. No gamma-ray line is seen in the spectra due to poor energy resolution (large non-uniformity of the light collection) of the detector but the shoulders correspond to the combination of the two Compton edges and two full absorption peaks of the 60Co gamma-ray lines at 1.173 MeV and 1.333 MeV.
The dashed histograms show the normalised simulated spectra. The simulations were carried out using the GEANT4 toolkit [15] taking into account the geometry of the veto and surroundings and the position of the 60Co source. The energy depositions of photons in scintillator (through secondary electrons) were recorded. The light collection was not simulated but was taken into account by applying a Gaussian smearing to the energy deposition in each event. The standard deviation (or ) for the smearing was described by the equation: suggested by Birks [20] and used also in the description of the energy calibration results from a small scintillator cell for neutron background measurements at Boulby [18]. The parameters and , as well as the conversion factor (for the data) from the measured pulse area to the energy scale, were determined from a comparison between the measured spectra and simulations.
The two dashed histograms of simulated events differ only by the normalisation factor that determines the vertical scale. They use the same values for the parameters and . The two data sets (solid histograms) are plotted using slightly different pulse area – to – energy conversion factors, namely: 0.36 MeV/(Vns) for the first run and 0.34 MeV/(Vns) for the second run showing good stability of the detector over several months of running. The agreement between simulation and both data sets in the energy range of interest (0.5-1.5 MeV) demonstrates the reliability of the energy calibration and of the simulation model. The difference of 6% in the pulse area – to – energy conversion factors between the two data runs determines the uncertainty in the energy scale. The difference between data and simulations at low energies is due to the energy threshold (not simulated). The difference at high energies is probably due to the strong enhancement of the signal if the energy deposition occurs close to the PMTs and/or to a possibility of detecting energy depositions of two photons from the same decay (not taken into account in simulations). As will be shown later, more reliable energy calibrations, though with larger uncertainty in the energy scale can be obtained directly from the data using the 2.22 MeV gamma-rays from neutron capture on hydrogen.
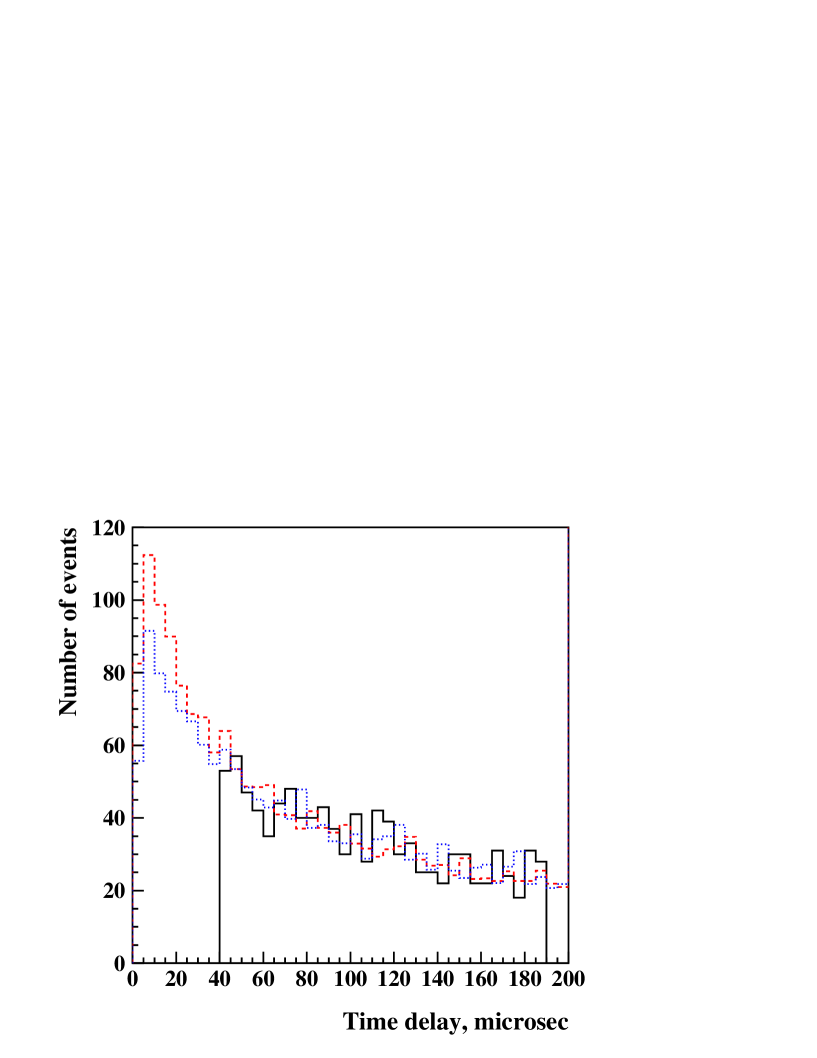
Neutron calibration with an Am-Be source of 0.1 GBq -activity has been carried out before the beginning of the data run. Ideally, the calibration of the experiment with a neutron source would allow the evaluation of detector efficiency to neutrons. The outcomes of calibration carried out in this experiment, however, were limited due to the reasons outlined below. Firstly, neutrons from the Am-Be source have on average lower energies than those produced by cosmic-ray muons. Secondly, neutrons are produced by muons everywhere, while the source position was fixed (on top of the veto detector, just below the castle roof). The neutron capture may thus occur on different materials during the neutron calibration and data runs. Thirdly, the trigger in the neutron calibration run was different from that in the data run. In the data run the high-energy muon energy deposition was the natural trigger, whereas in the neutron calibration run, in the absence of muons, the low-energy trigger from neutron-induced proton recoils was used. Finally, the neutron event rate during the calibration run was a few tens of events per second while the maximum rate handled by the DAQ (with almost 100% dead time) was about 20 Hz (in any run that recorded 200 s waveform for each event). Hence, the main aims of the neutron calibration were: i) to demonstrate that the experiment is sensitive to neutrons; ii) to show that the Monte Carlo models are accurate enough in describing neutron transport and detection by comparing measured and simulated time delay distributions of neutron-capture signals.
We point out that similar restrictions to calibration accuracy apply to other experiments that measured muon-induced neutron flux and calibrated their detectors using neutron sources.
Figure 5 shows measured and simulated time delay distributions between the pulses in the events relative to the trigger pulse in the neutron calibration run. Simulation of this run was carried out using GEANT4 taking into account the geometry of the setup, position of the source, neutron interactions and capture. The initial energy spectrum of neutrons from Am-Be source was calculated using the SOURCES4 [21] code. Two free parameters were used to tune the simulated distribution to match the data: (i) the normalisation constant or the total number of neutrons; (ii) the flat ‘background’ component that was seen in the data but was not simulated. The natural background during the calibration run was small and was not responsible for the flat component of the time delay distribution. Instead, the flat component was due to random coincidences between either proton recoil pulses from two neutrons or gamma-ray pulses from two neutron captures occurring because of the high event rate. The good agreement between measured and simulated time delay distributions gives evidence for the reliability of the GEANT4 toolkit to model neutron interactions and capture at MeV and sub-MeV energies.
The expected time delay distribution is not purely exponential since neutron capture occurred on several spatially separated targets (hydrogen, Gd, copper, steel, lead etc.). For this reason, only the comparison between data and Monte Carlo is shown without any fit.
3.2 Selection of muon events and capture gamma-ray pulses
The data on muon-induced neutrons were collected from August 2006 until April 2007. The veto detector was running in parallel with the ZEPLIN-II experiment. Time periods when the ZEPLIN-II detector (together with the veto system) was exposed to the calibration sources were excluded from the data analysis. The total live time of the experiment was 204.8 days.
Muons were selected as follows: (i) trigger pulse area higher than 50 Vns corresponding to an energy threshold of about 14 MeV (assuming proper reconstruction of the muon energy deposition, i.e. no saturation of PMTs or DAQ); (ii) FWHM greater than 40 ns; (iii) time during which the pulse amplitude exceeded 1.7 V, greater than 10 ns. Only events with a trigger pulse area exceeding 70 Vns satisfy all selection criteria rising the energy threshold to about 20 MeV (assuming no saturation). (In the pulse area – to – energy conversion above we used the more reliable energy calibration using the 2.22 MeV gamma-rays from neutron capture on hydrogen in the data run that will be described below.) This allows rejection of all background gamma-rays keeping more than 90% of muons [22, 23]. It also excludes a significant number of events when low-energy secondaries associated with muons are detected. More details on muon flux simulations and muon detection efficiency can be found in Refs. [22, 23]. During the experiment 10832 muons were detected translating to a rate of per day in agreement with previous measurements [22]. Comparing the measured rate with the Monte Carlo predictions gives the total muon flux at Boulby as ( (stat) (syst)) cm-2 s-1. The systematic error of the muon flux is due to the uncertainty in the energy scale. The above value is slightly smaller than reported in Ref. [22] mainly due to the more accurate three-dimensional Monte Carlo of muon transport in the vicinity of and in the detector (with the account of all interactions). In Ref. [22] a one-dimensional simplified model was used.
The small reduction in the muon flux compared to previous measurements [22] is equivalent to a small increase in the estimated depth (column density) of the Boulby laboratory where the experiment was carried out. The vertical depth reconstructed from the present observations (assuming flat surface relief above the lab) is m w. e. (see Ref. [22] for details on the depth reconstruction procedure). Note that the present measurements of the muon flux have been carried out in a new laboratory area at Boulby located about 200 m from the ’old’ lab where previous experiment [22] was performed. The muon flux reported here and in Ref. [22] for the Boulby Underground Laboratory is defined as the flux through a sphere with unit cross-sectional area. This definition may be different from those used for some other underground laboratories.
Secondary, delayed, pulses were selected using the following criteria: (i) energy higher than 2 Vns or 550 keV; (ii) presence of logic pulse; (iii) time delay relative to the muon pulse from 20 ns to 190 ns.
3.3 Results
The measured and simulated energy spectra of delayed pulses are shown in Figure 6. The energy scale for the measured spectrum was chosen to achieve the best visual agreement with the position of the simulated peak that corresponds to a combination of full absorption and Compton edge of 2.22 MeV gamma-rays from neutron capture on hydrogen – the main target for neutron capture in this experiment. When the energy calibration from the 60Co run is used, the peak appears at the energy of about MeV. For neutron data, this peak serves as an independent and more accurate energy calibration. This is due to different positions of gamma-induced events within the detector in the calibration and data runs. In the gamma calibration run, the source was located between the veto detector and the main ZEPLIN-II target, close to the bottom of the veto where the light collection was unfavourable. In the data run, neutrons from muons were captured evenly in the detector volume. Hence the peak in the spectrum at around 2 MeV provides an alternative and, to a certain extent, more reliable energy calibration. Superimposing this spectrum onto the simulated one, taking into account the smearing of energy deposition due to finite energy resolution, provides the pulse area – to – energy conversion factor. This conversion is shifted by about 20% relative to the 60Co calibration data due to the different location of energy depositions as explained above. Using the peak from neutron capture, the energy thresholds for neutron capture gammas was determined as MeV, and that for muons as MeV. The uncertainty in the energy resolution and the statistical uncertainty in the peak position are responsible for the error in the conversion factor. This will be converted later on to the systematic uncertainty in the neutron yield. This error also gives the systematic uncertainty in the muon flux.
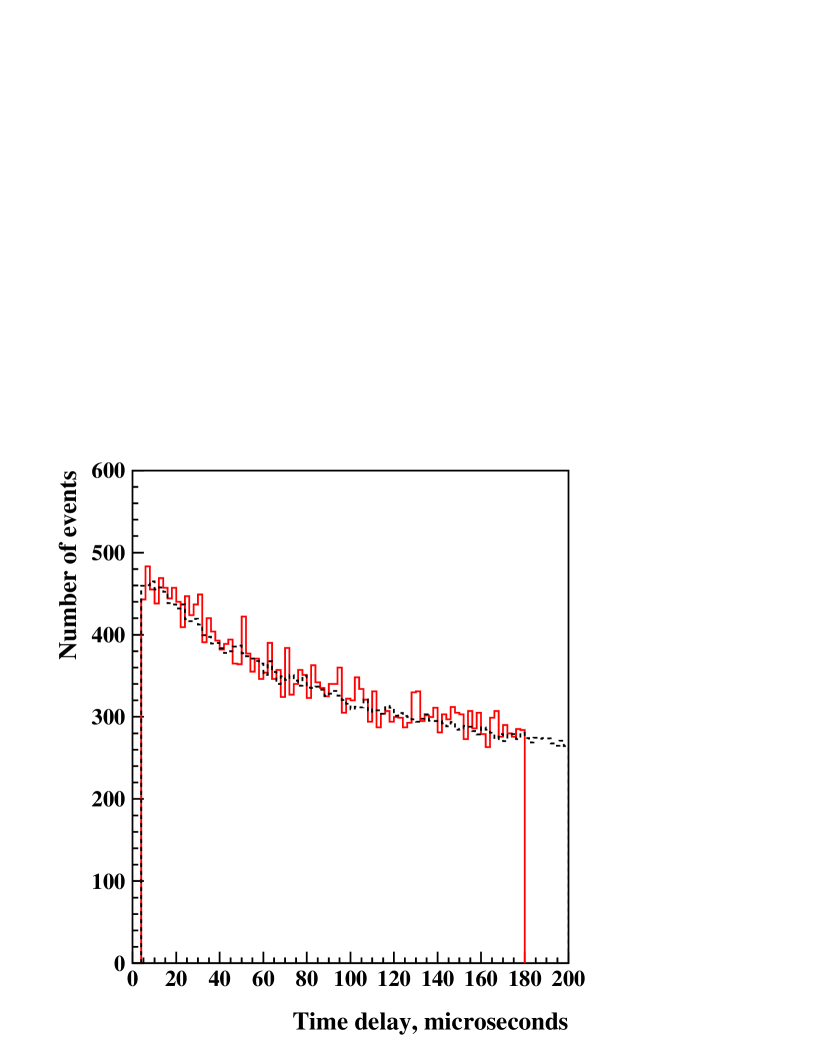
The time delay distribution of pulses in the events relative to trigger (muon) pulses is presented in Figure 7 together with the simulations. Both experimental data sets (with roof section on and off, hereafter called ’roof-on’ and ’roof-off’) were combined together. Details of the simulations will be described below. Only the time window 40-190 s after the muon trigger is shown for experimental data. We neglected all events in 0-20 s time window because of the large number of afterpulses. In addition we did not consider events that occur at 20-40 s after the trigger. This is because the neutron capture at that time may happen with a non-negligible probability on Gd (about 18% according to our simulations as described below) which is difficult to simulate accurately due to two reasons. Firstly, Gd loading and its distribution within wax is not known precisely. Secondly, gammas from neutron capture on Gd are not described accurately enough in the GEANT4 model framework. To avoid ambiguities in the data interpretation, we restricted the time window to 40-190 s after the trigger (11% probability of capture on Gd according to our simulations). Neutron capture on Gd was included in our simulations but the reduced time window allowed us to minimise possible errors associated with aforementioned uncertainties. We do not expect a significant change in the neutron rate even if captures on Gd were not accurately simulated.
The total number of secondary (delayed) pulses with energy deposition greater than 0.55 MeV in the time window of 40-190 s after the muon trigger was measured as 1037 whereas the number of muon triggers was 10832 giving the rate of pulses/muon.
A similar graph for gamma events (small energy deposition, small FWHM and no truncated amplitude) is shown in Figure 8. The distribution is flat proving that the delayed pulses in gamma events are due to rare random coincidences whereas the quasi-exponential shape of delayed pulses in muon events is due to neutron captures.
Random coincidences between gamma background pulses should also be present in muon events with the same rate as in gamma-induced events. The distribution shown in Figure 7 is in fact the sum of an exponential (or several exponentials) due to neutron capture and a flat background component due to random background coincidences. Gamma-induced events allow us to determine the flat background component or the rate of background pulses in muon events. The number of background events in 40-190 s time window after the gamma trigger (Figure 8) is 351 for 21461 gamma triggers giving a rate of background pulses of per event. So the true rate of neutron pulses in muon events is the difference between the total rate of secondary pulses in these events and the rate of pulses due to random background coincidences (flat component). Hence the neutron rate, defined as the average number of detected neutrons per detected muon, is obtained as neutrons/muon in 40-190 s time window. The threshold for energy deposition from neutron capture gammas was 0.55 MeV. The error is purely statistical. Systematic uncertainty is mainly due to the uncertainty in the pulse area – to – energy conversion and will be added to the predicted neutron yield.
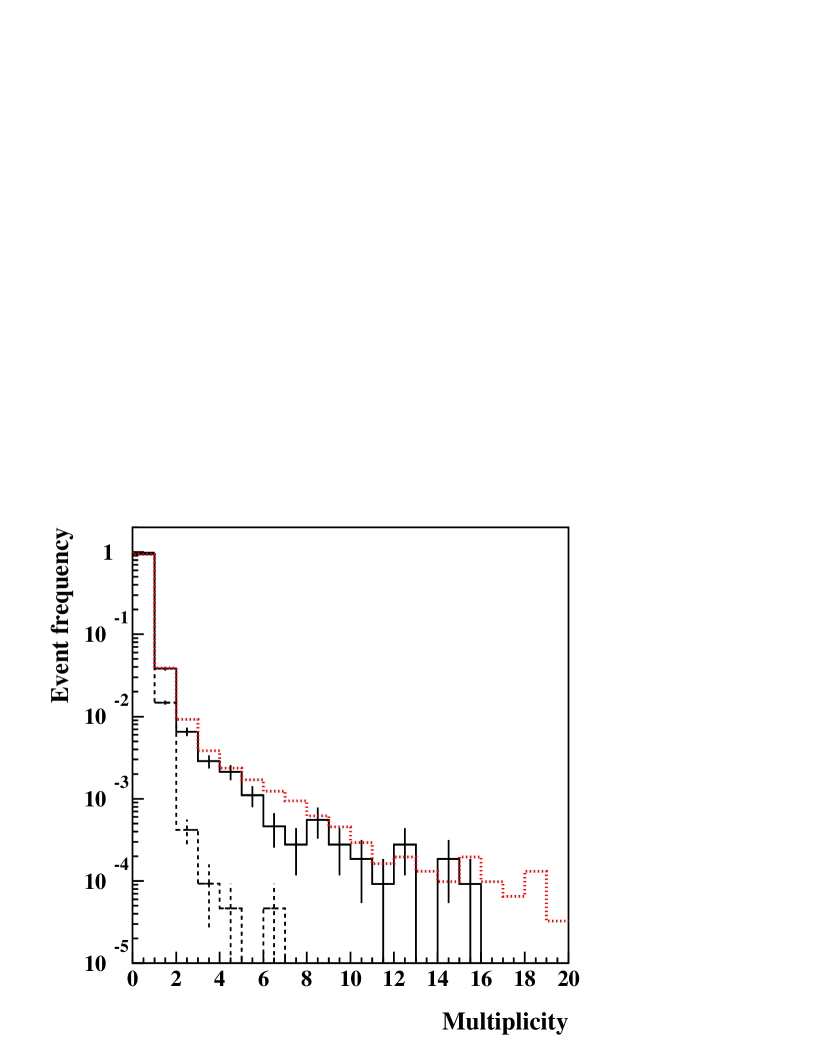
Figure 9 shows multiplicity distributions for both types of events (muons – solid histogram, and gammas – dashed histogram), namely the number of events as a function of the number of delayed pulses in an event. Both distributions are normalised to the total number of events of a particular type. There is a bigger fraction of muon events with non-zero secondary (neutron) multiplicity, than the fraction of gamma events (non-zero multiplicity is due to random coincidences). Large neutron multiplicity is expected in some muon events due to enhanced neutron production in lead, proving the neutron origin of delayed pulses. Measured distribution has a maximum multiplicity of 16. This number is smaller than the maximum multiplicity cut described in Section 2, since in the final analysis the reduced time window of 40-190 s was used compared to data reduction procedure (15-190 s).
For about 40% of the exposure the detector was running without the roof of the castle reducing the lead target mass for neutron production and the mass of Gd-loaded wax for neutron moderation and capture. The two sets of runs (roof-on and roof-off) were analysed separately to estimate the effect of the roof. The random background event rates were determined separately from corresponding time distributions of gamma events. Because of the absence of the roof section of the ’castle’ (shielding) the mean number of secondaries per gamma event with roof off was almost twice that number with roof on. After subtraction of random background component the neutron rates for two sets of runs were obtained as: neutrons/muon (roof-on) and neutrons/muon (roof-off).
4 Monte Carlo simulations
Measurement of the neutron rate using liquid scintillator at Boulby is hard to interpret without the full Monte Carlo that had been developed using GEANT4 toolkit. The presence of several potential targets for neutron production and neutron capture requires a detailed model of the detector, its surroundings and physics processes. Similar considerations are true for any other experiment with similar goals. The main advantage of our measurements is in the use of a single detector with well controlled energy threshold and systematics that makes its simulation a relatively easy task compared to larger modular detectors.
The modeling of the muon-induced neutrons has been carried out in two stages. In the first stage, muons were sampled using the muon generator MUSUN [1] according to their energy spectrum and angular distribution at the Boulby Underground Laboratory. These distributions were obtained by propagating muons from the surface through the Boulby rock using the code MUSIC [24]. The calculated absolute muon flux was normalised to the present muon flux measurements which, as mentioned above, agree well with earlier work [22]. The mean muon energy at Boulby was calculated as GeV. Muons were sampled on the surfaces of a rectangular parallelepiped that surrounded the main experimental hall of the underground laboratory where the detector was placed. The distance from the surface of parallelepiped to the cavern walls was 7 m on four sides, 10 m above and 5 m below the detector. This ensured that high-energy neutrons produced in rock far away from the laboratory hall and the detector could still reach it and be detected (for more discussion about neutron production by muons see Ref. [2]). Two million muons were generated in this way and their parameters (energy, position, direction cosines and sign) were recorded and passed to GEANT4 on the second stage.
Neutron production, transport and detection were simulated using GEANT4 [15] version 8.2. The laboratory hall, lead and wax shielding, Gd, veto and ZEPLIN-II detector were included in the simulations. Detailed description of the simulations, various validation tests and comparison with other simulation work will be presented in a separate paper [23]. Here we present only the results important for the interpretation of the experimental data.
The physics models and particle production thresholds (’cuts’) were essentially those described in Ref. [2], although other configurations were studied as described in Ref. [23]. All hadronic and electromagnetic processes were taken into account in the simulations. The hadronic interactions were simulated using the quark-gluon string model above 6 GeV, an intra-nuclear binary cascade model at lower energies and a pre-equilibrium de-excitation stage below 70 MeV. Neutron interactions below 20 MeV were treated using high-precision data-driven model. The production thresholds (‘cuts’) considered in these simulations were a few tens of keV for gammas and 1 MeV for electrons and positrons in all materials. No thresholds were applied to neutron tracking.
Muon parameters were read from the MUSUN output file and passed to GEANT4 for further muon transport. Stochastic muon interactions and continuous energy loss due to ionisation were simulated. All muons and secondary particles produced by the muons and in muon-induced cascades (showers) were transported and their energy depositions in the veto detector and interaction times were stored in memory. Finally, for each muon event we recorded the energy depositions for different time bins covering 0–1 s (10 bins), 1–200 s (199 bins) and 200–500 s (30 bins). This allowed us to select events imposing the same cuts as for real data sets and plot distributions in a similar way as for the data run for direct comparison.
In total, about 120 million muons were sampled, each of the pre-recorded muons was sampled about 60 times, but transported differently using different random numbers. This corresponded to a run time of about 960 days. The statistics are about 4.7 times that for real data.
5 Discussion
Comparison between data and simulations is shown in Figures 6, 7, 9. Reasonable agreement between measured and simulated spectra of delayed gammas, shown in Figure 6, allowed us to establish the energy scale and evaluate the threshold for muons and delayed gammas. We estimated the uncertainty in the energy scale as about 20% that leads to an uncertainty in the energy threshold for delayed gammas of about 0.1 MeV. Changing the pulse area – to – energy conversion or energy resolution by this factor destroys the agreement in the peak shape and position. This does not exceed the shift in the energy scale if the 60Co spectrum is used for energy calibration, confirming the scale of the systematic uncertainty. The uncertainty in the energy threshold for muons may be a little higher since a saturation effect can suppress slightly the measured energy deposition from muons. We estimated the total systematic uncertainty in the energy scale for muons as about 25%. This is consistent with agreement between muon rates reported here and in Ref. [22] where the suppression of energy deposition for muons occured at much higher energies. Large suppression of muon energy deposition at threshold, leading to higher effective energy threshold, would manifest itself in a smaller muon rate measured in the present experiment. Systematic uncertainties in energy scales for muons and delayed gammas were converted into the uncertainty in the simulated neutron rates and will be reported below.
Figure 7 shows the simulated time delay distributions compared to the experimental data described above. Two sets of simulations (roof-on and roof-off) are plotted separately to show good agreement in shape at 40-190 s used for data analysis. At small time delays a visible difference is due to the presence of Gd in the roof shielding in the run with the roof section resulting in the enhanced capture of neutrons on Gd at small times.
The same energy thresholds for muon and delayed gamma energy depositions were applied to the simulated events as for data. The energy resolution was chosen to match the energy spectrum of delayed gammas (see Figure 6). As for the neutron calibration run, tuning of simulated spectra was done using two free parameters: i) the total number of neutrons; ii) the flat component due to random background coincidences (not simulated). The second parameter is bound by standard deviations from the measured background rate based on gamma-induced events (see Section 3). Figure 7 shows good agreement between measured and simulated shapes of the time delay distribution. Note that the absolute normalisation was chosen to reach good visual agreement and hence no conclusion about absolute neutron rate can be drawn based on this figure.
The rate of simulated pulses from neutron capture gammas in 40-190 s can be directly compared to the measurements. This does not require any assumption about the shape of the time delay distribution other than a general agreement between measured and simulated distributions (shown in Figure 7). Measured and simulated neutron rates are compared in Table 1 for the two runs separately and combined together. Only statistical errors are shown in the table. Systematic uncertainty is mainly due to the 20% uncertainty in the energy scale as discussed above. This was converted into the uncertainty of 0.009 neutrons/muon in the simulated neutron rate in the 40-190 s time window with a threshold of 0.55 MeV for delayed pulses. Table 1 shows a factor of 1.8 difference between measured and simulated neutron rates for both runs, GEANT4 predicting higher neutron rate than measured in the present experiment.
Figure 9 shows the simulated neutron multiplicity distribution (runs with roof-on) compared to the data (all runs). A smaller rate of events is observed for almost all neutron multiplicities. No more than 20 pulses on each waveform were recorded in the data run. Since a restricted time window of 40-190 s was used in the analysis, the effective multiplicity cut was found to be 16 delayed pulses (see Figure 9). Taking the fraction of simulated events with multiplicity larger than 16 we estimated the fraction of missed neutrons if the maximum multiplicity cut of 16 was applied, as less than 2%. This is smaller than the statistical error of the measurements and does not affect the results.
A smaller observed neutron rate compared to simulations can be due to two main factors: i) smaller neutron yield than predicted in GEANT4 models; ii) enhanced absorption of neutrons or gammas before neutrons or neutron capture gammas can reach the detector. The second argument is highly unlikely because of the following reasons. Firstly, the measured time delay distribution matches well the simulated one for the time window chosen. The shape of the time delay distribution depends on the neutron capture cross-section and, hence, is affected by the geometry and neutron capture models. Good agreement between data and simulations proves that the neutron capture and secondary gammas are described reasonably well by the GEANT4 models. Secondly, a similar agreement in shape was seen in the neutron calibration data proving again a good model for neutron capture and gamma transport and detection. Finally, neutron transport at MeV and sub-MeV energies was simulated with GEANT4 and MCNPX [25] and they were found to be in good agreement. Hence, the most probable explanation of the observed deficit of muon-induced neutrons lies in the GEANT4 model(s) involved in neutron production.
The ratio of roof-off / roof-on neutron rates is consistent with unity for both data (within two standard deviations) and simulations. Lead in the roof section contributes about 12% to the total mass of lead. Lead is responsible for about 91% of neutrons in the run with roof-on and about 90% of neutrons in the run with roof-off (results from our simulations). The fact that neutron rates are similar in both sets of data despite a 12% difference in lead mass can be explained by the presence of Gd-loaded wax in the roof section for runs with roof-on. This enhances neutron moderation and capture above the detector preventing neutrons (gammas) being detected in scintillator in runs with roof-on. Thus, enhanced neutron production in lead in the roof section was compensated by the efficient absorption of these neutrons before they can reach the scintillator. Since lead contributes about 90% to the detected neutron rate, we can conclude that GEANT4 probably overestimates the neutron yield in lead. This result is somewhat surprising since GEANT4 was found to underproduce neutrons relative to FLUKA Monte Carlo [2].
Alternative GEANT4 hadronic models result in similar neutron yields. For the most widespread GEANT4 models the difference is within 20% [23, 26]. Recently developed CHIPS models [27] predict even higher flux of neutrons and, hence, are probably inconsistent with the present measurements. More detailed studies will follow [23].
The time window of 40-190 s used in the data analysis contains about 42% of the total number of neutrons according to the simulations (41% with roof section and 44% without roof section), assuming a well known geometry. Hence, the total neutron rate for an infinite time window can be evaluated as neutrons/muon for the simulated geometry. This figure is still geometry dependent. For practical use this figure has to be converted to the neutron yield in a specific material, defined as the average number of neutrons produced by a muon along 1 g/cm2 of its path. The most reliable and quasi model independent way of doing this is based on the following assumptions: 1) The geometry, neutron moderation and capture are described correctly in GEANT4; this is proven by the time delay distributions of data and calibration neutrons and by the agreement reached in Ref. [25] for MeV and sub-MeV neutron transport; 2) Most neutrons (about 90%) detected in our scintillator are produced in lead - this follows from simulations; 3) The ratio of measured-to-simulated neutron rates per detected muon is thus the same as for raw neutron yields in lead. Using the fact that the measured neutron rate is 1.8 times smaller than GEANT4 predictions, and the calculated neutron yield in the same model in lead is neutrons/muon/(g/cm2) for a muon energy of 260 GeV, we found the yield in lead, reconstructed from our measurements, to be neutrons/muon/(g/cm2), for a mean muon energy of about 260 GeV. This value is 3.6 times smaller than the expected neutron yield from FLUKA simulations [2].
Although our lead target and detector are of relatively small size, the fractional contribution of physical processes to the measured neutron rate does not differ much from contributions of these processes to the total neutron yield (see, for instance, [1, 2] for discussion), allowing us to convert our measured rate to the total neutron yield as described above. Our simulations show that 2.2% of detected neutrons are coming from the muon spallation process, 63% were initiated by photons or electrons and 34.8% were produced by hadrons either via capture or hadron inelastic scattering. Although most neutrons detected in our scintillator were produced in lead, cascades could be originated also in the rock around the setup, thus increasing the fraction of detected neutrons from photons and hadrons.
The hypothetical contribution of a muon-induced neutron background for dark matter searches was checked using data from the ZEPLIN-II science run [17, 28] with 225 kgdays exposure. ZEPLIN-II was operated in coincidence with the active veto system described here. The data did not contain any neutron-induced nuclear recoil event in the target (ZEPLIN-II) in coincidence with a large muon signal in the active veto showing that for detectors with a few kilograms of target mass this background is not a severe threat at a depth of about 3 km w. e.
6 Conclusions
The first measurements of the muon-induced neutron flux at the Boulby Underground Laboratory were presented. The experiment was carried out with an 0.73 tonne liquid scintillator. The delayed coincidence method was used to detect a muon (the first pulse in an event) and gamma-rays resulted from neutron capture on hydrogen or other elements (secondary, delayed, pulses). The muon-induced neutron rate was measured as (stat.) neutrons/muon using neutron-capture signals above 0.55 MeV in a time window of 40-190 s after the muon trigger. Accurate Monte Carlo simulations of the neutron production, transport and detection in a precisely modeled laboratory and experimental setup were carried out using the GEANT4 toolkit. The simulations gave a rate of (stat.)(syst.) neutrons/muon for the same selection criteria. The simulated result is 1.8 times higher than the measured value and the difference largely exceeds all statistical and systematic uncertainties. As the vast majority of neutrons detected in the current setup were produced in lead we evaluated from our measurements the total neutron yield in lead as neutrons/muon/(g/cm2) for mean muon energy of about 260 GeV.
7 Acknowledgments
This work has been supported by the ILIAS integrating activity (Contract No. RII3-CT-2004-506222) as part of the EU FP6 programme in Astroparticle Physics. We acknowledge the financial support from the Particle Physics and Astronomy Research Council (PPARC, currently Science and Technology Facility Council – STFC), the US Department of Energy (grant numbers DE-FG03-91ER40662 and DE-FG03-95ER40917), the US National Science Foundation (grants PHY-0139065 and PHY-0653459) and from Fundação para a Ciência e Tecnologia (project POCI/FP/81928/2007). We are grateful to the Nuffield Foundation for the support of J. Blockley through Undergraduate Research Bursary (grant URB/34132/2007). We also wish to thank Cleveland Potash Ltd for assistance.
References
- [1] V. A. Kudryavtsev, N. J. C. Spooner and J. E. McMillan, Nucl. Instrum. & Meth. in Phys. Res. A, 505 (2003) 688.
- [2] H. M. Araújo, V. A. Kudryavtsev, N. J. C. Spooner and T. J. Sumner. Nucl. Instrum. & Meth. in Phys. Res. A, 545 (2005) 398.
- [3] L. B. Bezrukov et al. Yad. Fiz., 17 (1973) 98 [Sov. J. Nucl. Phys., 17 (1973) 51].
- [4] R. I. Enikeev et al. Yad. Fiz., 46 (1987) 1492 [Sov. J. Nucl. Phys., 46 (1987) 883].
- [5] M. Aglietta et al. (LSD Collaboration). Nuovo Cimento C, 12 (1989) 467.
- [6] M. Aglietta et al. (LVD Collaboration). Proc. 26th Intern. Cosmic Ray Conf. (Salt Lake City, USA), 2 (1999) 44; hep-ex/9905047.
- [7] F. Boehm et al. Phys. Rev. D, 62 (2000) 092005.
- [8] R. Hertenberger, M. Chen, and B. L. Dougherty. Phys. Rev. C, 52 (1995) 3449.
- [9] H. Menghetti (for the LVD Collaboration), Proc. of the 5th Intern. Workshop on the Identification of Dark Matter (Edinburgh, UK, 6–10 September 2004), p. 471.
- [10] V. Chazal et al. Nucl. Instrum. & Meth. in Phys. Res. A, 490 (2002) 334.
- [11] G. V. Gorshkov et al. Sov. J. Nucl. Phys., 18 (1974) 57.
- [12] L. Bergamasco, S. Costa and P. Picchi. Il Nuovo Cimento A, 13 (1973) 403.
- [13] R. Hennings-Yeomans and D. S. Akerib. Nucl. Instrum. & Meth. in Phys. Res. A, 574 (2007) 89.
- [14] A. Fassò, A. Ferrari and P. R. Sala. Proceedings of the MonteCarlo 2000 Conference (Lisbon, October 23–26, 2000), Ed. A.Kling, F.Barao, M.Nakagawa, L.Távora, P.Vaz (Springer-Verlag, Berlin, 2001), p. 159; A. Fassò, A. Ferrari, J. Ranft and P. R. Sala, ibid. p. 995.
- [15] S. Agostinelli et al. (GEANT4 Collaboration). Nucl. Instrum. & Meth. in Phys. Res. A, 506 (2003) 250.
- [16] Y.-F. Wang et al., Phys. Rev. D, 64 (2001) 013012.
- [17] G. J. Alner et al. (ZEPLIN-II Collaboration). Astroparticle Phys., 28 (2007) 287.
- [18] E. Tziaferi et al. Astroparticle Phys. (2007), 27 (2007) 326.
- [19] G. J. Alner et al. (ZEPLIN-II Collaboration). Nucl. Instrum. & Meth. in Phys. Res. A, 587 (2008) 101.
- [20] J. B. Birks, Theory And Practice of Scintillation Counting, Pergamon Press (1964).
- [21] W. B. Wilson et al., SOURCES-4C: A Code for Calculating (alpa,n) Spontaneous Fission and Delayed Neutron Sources and Spectra, American Nuclei Society/Radiation Protection and Shielding Division (2002).
- [22] M. Robinson et al. Nucl. Instrum. & Meth. in Phys. Res. A, 511 (2003) 347.
- [23] A. Lindote et al., in preparation.
- [24] P. Antonioli, C. Ghetti, E. V. Korolkova, V. A. Kudryavtsev and G. Sartorelli. Astroparticle Phys., 7 (1997) 357; V. A. Kudryavtsev, E. V. Korolkova and N. J. C. Spooner, Phys. Lett. B, 471 (1999) 251.
- [25] R. Lemrani et al. Nucl. Instrum. & Meth. in Phys. Res. A, 560 (2006) 454.
- [26] M. Bauer, J. Jochum and S. Scholl. Proc. 5th Intern. Workshop on the Identification of Dark Matter (Edinburgh, UK, 6-10 September 2004), ed. by N. J. C. Spooner and Vitaly Kudryavtsev (World Scientific, Singapore, 2005), 494.
- [27] M. V. Kossov. European Physical J. A, 14 (2002) 377.
- [28] G. J. Alner et al. (ZEPLIN-II Collaboration). Phys. Lett. B, 653 (2007) 161.
| Roof-on | Roof-off | Ratio | Combined | |
|---|---|---|---|---|
| Data | ||||
| Simulations |