Star formation in the hosts of high-z QSOs: Evidence from Spitzer PAH detections
Abstract
We present Spitzer rest-frame mid-infrared spectroscopy of twelve z2 mm-bright type 1 QSOs, selected from unlensed and lensed QSO samples and covering a range of AGN optical luminosities L to 1047 erg s-1. On top of the AGN continuum, we detect PAH emission from luminous star formation in nine objects individually as well as in the composite spectrum for the full sample. PAH luminosity and rest frame far-infrared luminosity correlate and extend the similar correlation for lower luminosity local QSOs. This provides strong evidence for intense star formation in the hosts of these mm-bright QSOs, sometimes exceeding 1000yr-1 and dominating their rest frame far-infrared emission. The PAH-based limit on star formation rates is lower for luminous z2 QSOs that are not preselected for their mm emission. Partly dependent on systematic changes of the AGN dust covering factor and the dust spectral energy distribution of the AGN proper, the spectral energy distributions of mm-faint high-z QSOs may be AGN dominated out to rest frame far-infrared wavelengths. Towards the most luminous high-z QSOs, there is a flattening of the relation between star formation and AGN luminosity that is observed for lower redshift QSOs. No QSO in our sample has a PAH-measured star formation rate in excess of 3000 yr-1.
1 Introduction
Studies of the evolution of galaxies and active galactic nuclei (AGN) are drawing an increasingly detailed picture of their global evolution from redshifts above 6 to the present. The cosmic star forming density as well as the number density of AGN rise and fall over cosmic time, with a maximum in the ‘quasar epoch’ at redshifts around 2. Less is known about the connection of star formation and nuclear activity in individual high redshift objects, and the controlling physical processes. A related basic observational goal is to quantify both AGN luminosity and star formation in an as wide as possible set of galaxy populations, a task that is posing considerable technical difficulties for some types of objects.
A particularly interesting population are the luminous AGN that are traced by optically selected QSOs. Evolutionary connections between intense starburst events and QSOs have been proposed early on (e.g. Sanders et al., 1988; Norman & Scoville, 1988) and naturally suggest that the luminous AGN phase coincides with or follows after a period of intense star formation. While still limited in spatial resolution and requiring simplifying assumptions, increasingly advanced models of these processes now become available. They combine galaxy merging, gas transport, star formation, accretion and feedback processes (e.g. Springel et al., 2005). In turn, such scenarios are part of recent global modes of galaxy and merger evolution (e.g. Granato et al., 2004; Hopkins et al., 2006).
Indications have been obtained for intense star formation events in the host of high redshift QSOs. Perhaps the most important is the detection of submm or mm continuum (rest frame far-infrared) from dust in part of the high-z QSO population. If heated by star formation, this emission indicates high star formation rates similar to those in submillimeter galaxies (e.g. Omont et al., 2003; Priddey et al., 2003; Barvainis & Ivison, 2002). Large molecular gas reservoirs sufficient to sustain intense star formation have been detected in CO (see summaries in Solomon & Vanden Bout, 2005; Greve et al., 2005), and in some of the brightest systems also in tracers of dense molecular gas (Barvainis et al., 1997; Solomon et al., 2003; Carilli et al., 2005; Riechers et al., 2006; Gracía-Carpio et al., 2006; Guélin et al., 2007). Finally, the [CII] 157m fine structure line was detected in a few high-z quasars (Maiolino et al., 2005; Iono et al., 2006) at a ratio to the rest frame far-infrared emission similar to the ratio in local ULIRGs, consistent with massive star formation. While these observations indicate a plausible picture of massive star formation in some QSO hosts, they need independent support, in particular to better discriminate between star formation and AGN heating of the observed rest frame far-infrared continuum. We have hence initiated a program using the mid-infrared ‘PAH’ emission features as tracers of star formation in the hosts of high-z QSOs.
Because of their presence in star forming environments with a wide range of physical conditions but absence close to powerful AGN, the main mid-infrared PAH emission features at 6.2, 7.7, 8.6, and 11.3m have been used extensively as extragalactic star formation indicators. The calibration factor between PAH luminosity and star formation rate depends on average physical conditions in the interstellar medium of the galaxy probed. This is indicated both in the relatively weaker PAH in galaxies with intense interstellar radiation fields (as measured by the large grain dust temperature from their SEDs, Dale et al., 2001), and in the sublinear increase of PAH emission with P hydrogen recombination line emission, that is observed in spatially resolved studies of nearby galaxies (Calzetti et al., 2007). For the specific case of star formation indicators for QSO hosts, the associated uncertainty is outweighed by several advantages. PAH emission from starbursts is very luminous and thus less easily outshone by the powerful AGN. Unlike other popular star formation indicators like H or mid-infrared 24m continuum, it will not be quickly overwhelmed by strong AGN emission in the very same tracers. It is also less sensitive than e.g. the optical [OII] 3727Å line to the significant internal obscuration that is typical for starburst regions.
In Schweitzer et al. (2006) and Netzer et al. (2007) we have applied these techniques to local z0.3 Palomar-Green (PG) QSOs, detecting PAH emission in many objects and concluding that likely most of their –1012 far-infrared luminosity is due to star formation. Comparing average spectra and SEDs of groups of QSOs that are differing in their level of far-infrared emission, we were able to derive an infrared SED for the pure AGN, after subtraction of host star formation.
Several spectroscopic studies have shown that Spitzer-IRS spectroscopy with modest integration times of at most a few hours per source can successfully detect the PAH emission of the most luminous z2.5 star forming events, which approach infrared luminosities of 1013 and star formation rates around 1000/yr. Such detections have been obtained for submillimeter galaxies (SMGs) (Lutz et al., 2005; Valiante et al., 2007; Menéndez-Delmestre et al., 2007; Pope et al., 2008) as well as for a subset of bright Spitzer 24m selected galaxies (e.g. Weedman et al., 2006; Yan et al., 2007). Substantially longer integrations exceeding 10 hours in an IRS spectral order have been demonstrated to be able to detect yet fainter PAH emission at similar redshifts with a peak of the rest frame 7.7m feature of 0.4mJy or less (Teplitz et al., 2007). Probing PAH emission to these levels would be highly interesting for a complete sample of luminous z2.5 QSOs but expensive in observing time. Systematic difficulties arise in detecting PAH features on a strong AGN continuum that additionally has structure due to silicate emission. The silicate emission is strong in regions of the spectrum where the main PAH complexes are weak, and thus tends to wash out the PAH-induced structure, as demonstrated for some local PG QSO spectra in Schweitzer et al. (2006).
In this paper, we hence focus as an important first step on measuring PAH emission and inferred star formation in a modest size sample of twelve z=1.8 to z=2.8 QSOs that all have detected (sub)mm emission. If this mm emission is due to host star formation, its associated PAH emission will be detectable with IRS in modest integration times by analogy to the SMGs at similar redshift. In Lutz et al. (2007) we have presented first results for the brightest object in our sample, the Cloverleaf (H1413+117). Here we present the full mm-bright sample and discuss in section 4.2 implications for the high redshift QSO 1 population as a whole.
Throughout the paper we adopt an , and km s-1 Mpc-1 cosmology. When converting IR luminosities to star formation rates we adopt for consistency with much of the previous work the Kennicutt (1998) value which is based on a 0.1-100 Salpeter IMF. For a more realistic Chabrier or Kroupa IMF star formation rates would be a factor 1.6 smaller. Our sample includes lensed sources. For these, we present fluxes or flux densities as observed, but luminosities, star formation rates and masses corrected for the adopted lensing magnification.
2 Sample and Observations
We have selected from the literature z2 Type 1 radio quiet QSOs with robust () and consequently bright submm or mm dust continuum detections. The sample includes lensed as well as unlensed QSOs and is summarized in Table Star formation in the hosts of high-z QSOs: Evidence from Spitzer PAH detections. Sources have been chosen from the surveys of (sub)mm emission in z2 QSOs by Omont et al. (2003) and Priddey et al. (2003), the lensed QSO submm survey of Barvainis & Ivison (2002), and one target each from Guilloteau et al. (1999) and Knudsen et al. (2003). One of the targets (SMMJ04315+10277, Knudsen et al. (2003)) was first reported in a submm survey and may be intermediate in properties between optically selected QSOs and typical submm selected galaxies. The other targets are selected from the mentioned studies of optically selected QSOs solely on the basis of a bright and robust (sub)mm detection and will provide a view of the rest frame far-infrared bright part of the general z2 unobscured QSO population. Our unlensed targets have AGN rest frame optical luminosities in the range 1046 to 1047ergs s-1, some of the lensed QSOs are intrinsically an order of magnitude less luminous and overlap with the highest luminosity local sources studied with similar methods by Schweitzer et al. (2006) and Netzer et al. (2007).
For targets in Omont et al. (2003) the optical luminosities were adopted from the rest frame blue absolute magnitudes in this reference, converting to our adopted cosmology. In the other cases we used published near-infrared photometry (Priddey et al., 2003, and 2MASS point source catalog), and the assumption of a rest frame optical/UV continuum (Vanden Berk et al., 2001).
We obtained low resolution (R) mid-infrared spectra of the QSOs using the Spitzer infrared spectrograph IRS (Houck et al., 2004) during the period July 2006 - October 2007. The IRS LL slit is wide enough to include all images of the lensed sources. For each target, 30 cycles of 120 sec integration time per nod position were taken in the LL1 (19.5 to 38.0 m) module and 15 cycles in the LL2 (14.0 to 21.3 m) module, leading to effective on-source integration times of 2 and 1 hours, respectively. We start from the pipeline processed basic calibrated data (version 14.4 to 16.1 for different sources), subtracting individually data for the same data collection event within the data collection sequences of the two nod positions. We use own deglitching routines identifying outliers from the default bad pixel masks, by identifying points discrepant by more than a multiple of the local noise from their spectral neighborhood, and by visual inspection of the 2D frames, finally replacing them with values representative of their spectral neighborhood. We coadded the images for each cycle, checking pixel per pixel for outlying values in the stack, and subtracted residual background derived from a first order spatial fit to source-free regions. SMART (Higdon et al., 2004) and SPICE (optimum extraction, for the weak continuum source SMMJ04315 only) were used for extraction. We compared the independent spectra from the two nod positions before averaging, finding no mismatches that would be indicating mispointings or other serious problems with the data. Before combining the segments of the spectrum observed in the different modules into the final spectrum, the segment observed in the LL2 module was multiplied with an object-dependent scaling factor (within a few % of 1) in order to provide best match in the overlapping wavelength range.
3 Results
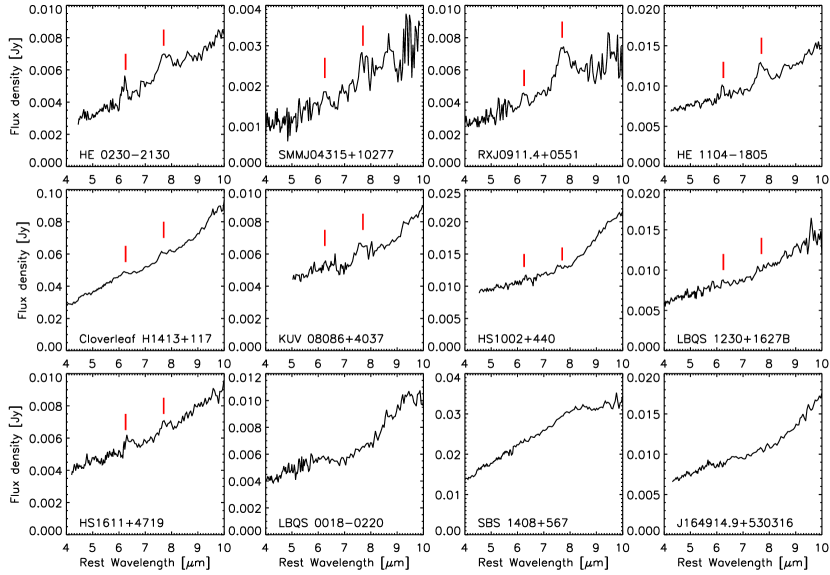
Figure 1 shows the spectra of all our targets, and Fig. 3 a composite derived from all sample objects. The main spectral features are the ones also seen in the spectra of local PG QSOs (e.g. Siebenmorgen et al., 2005; Hao et al., 2005; Schweitzer et al., 2006; Hao et al., 2007; Netzer et al., 2007): A strong AGN continuum with superposed silicate emission at m, and aromatic ‘PAH’ emission features at 6.2, 7.7, 8.6m at varying strength relative to the local continuum. An unusual individual spectrum is the one of SBS 1408+567 with convex continuum, a smooth broad emission feature around 8m, but no unambiguous identification of PAH emission. This broad feature is weaker relative to the continuum but has similarity with the 8m feature in the mid-infrared spectrum of the well known Type 1 AGN and ULIRG Mrk 231 (Rigopoulou et al., 1999; Spoon et al., 2002; Weedman et al., 2005; Armus et al., 2007) which may originate from a combination of silicate emission and absorption. PAH 7.7m may also contribute to some extent to this feature.
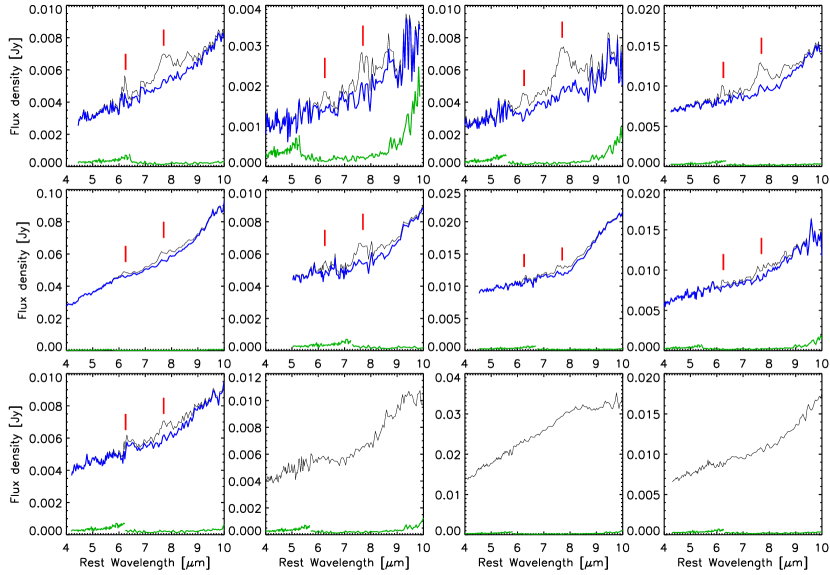
In this paper, we focus on analysis of the PAH emission and its implications for star formation in the QSO hosts. Given the S/N of the spectra and the variations in slope and shapes of continuum and silicate emission in AGN, we do not attempt to derive independent fluxes for the various PAH features. Informed by the spectra of local QSOs and supported by the average spectrum of Fig. 3, we quantify the overall level of PAH emission by decomposing the QSO spectra into a scaled and resampled starburst template (based on the ISO-SWS spectrum of M82, Sturm et al., 2000) at the nominal redshift of the QSO, and the underlying AGN emission which consists of a dust continuum and silicate emission that is turning up beyond 8m. Results of this decomposition are shown in Figure 2. The combination of AGN continuum and silicate emission varies smoothly with wavelength over the range of interest. The first signature of PAH in such spectra that is already visible at modest S/N then is the strongest 7.7m feature and its short wavelength steep flank, while its longer wavelength side is often less pronounced, due to the combined presence of 8.6m PAH and the upturn of silicate emission. The strength of the starburst component in the decomposition is adjusted to produce a smooth residual AGN emission at the locations of the 6.2 and 7.7m features, in particular to remove the steep short wavelength flank of the 7.7m feature. Given the S/N of the data we do not attempt to derive PAH feature ratios by multi-feature fits, but obtain from the simple template a more robust characterisation of the overall level of PAH emission which we represent by the flux of the brightest (7.7m) feature. These PAH 7.7m fluxes (Table 2) are measured in the scaled starburst template resulting from the decomposition, by fitting Lorentzian features for the PAHs plus an underlying residual continuum. PAH 7.7m fluxes listed in Table 2 can thus be directly compared to the results for local QSOs presented by Schweitzer et al. (2006).
We list in Table 2 the measured noise per resolution element over the rest frame 6.5–8m region of the actual spectra, defined as RMS around a linear fit to the data after subtraction of the scaled PAH template and its associated feature structure. By quoting the noise measured in this way from the spectra, we implicitly include possible noise contributions for stronger continua, that may arise for example due to more difficult outlier identification and fringing. This noise may be conservatively overestimated if the continuum is slightly curved over this range. Noise 0.2mJy per spectral sample as obtained for some of our weaker continuum targets is in good agreement with the nominal IRS sensitivity for our observing parameters, as implemented in the Spitzer Science Center SPEC-PET tool.
For the 9 sources for which we report PAH detections in Table 2, the peak height of PAH emission in the starburst component obtained from the decomposition is required to be at least 3 times the measured local noise. These significances of 3–13 for the PAH emission effectively reflect the significance of the short wavelength flank of the 7.7m feature. At longer wavelengths, systematic variations in shape of underlying continuum and in particular the strength and detailed shape of the onset of AGN silicate emission at m start to become more and more limiting, preventing reliable use of these wavelengths to verify or improve the formal significance. Several of the targets (SMMJ04315+102177, KUV0806+4037, HS1002+4400, LBQS1230+1627B) show PAH with peak height that is for the individual sources just above the peak/noise=3 detection limit. In combination with the possibility that the mentioned uncertainties on AGN continuum and silicate shape affect to a lesser extent also the short flank of the 7.7m PAH, we estimate that individual PAH fluxes for these weak PAH detections can be uncertain at the 30–50% level. We caution that they should not be used for analyses going significantly beyond the modest accuracy requirements of the luminosity analyses presented below.
Upper limits are estimated analogously, for the PAH template scaled to a level where the features would remain visibly detectable on top of the continuum and the silicate feature. The IRS spectra of the sources with PAH nondetections are still consistent with the presence of PAH emission at peak feature fluxes similar to the sources with detections. Again, the main limitation is systematic, due to the strong and structured underlying continuum and silicate emission in these targets. In the spectrum of LBQS 0018-0220, for example, inspection of Fig. 1 shows that the 7-8m region of the spectrum, observed with good S/N, may represent either PAH emission partly filling in the region before an upturn of silicate emission, or be due to variations in shape/slope of this feature, which is strong for LBQS 0018-0220, and the underlying continuum. Such variations are observed in local AGN (e.g. Hao et al., 2005; Schweitzer et al., 2006; Netzer et al., 2007). We list in Table 2 PAH upper limits considering this possiblity rather than only reflecting the detector noise.
We will compare below the PAH emission of high-z QSOs with the rest frame far-infrared emission. Partly, this is possible by simply using the rest frame m continuum that can be obtained from the published (sub)mm photometry with minimal extrapolation. For other purposes and for comparison with the local QSO population we need to extrapolate to the rest frame far-infrared peak which is constrained by direct observations for very few high redshift QSOs only. We do so by assuming that the detected (sub)mm emission reflects a rest frame T=40K, emissivity index =1.5 greybody spectrum. These parameters are in reasonable agreement with the dust temperature 36K suggested for the submillimeter galaxy population by Chapman et al. (2005) and with 40-60K suggested by Beelen et al. (2006) for high-z QSOs, from the combination of 350m photometry with longer wavelength observations. For three QSOs overlapping with our sample (KUV 0806+4037, HS 1002+4400, SBS 1408+567), Beelen et al. (2006) find 32K, 38K, and 35K respectively, and the FIR-warmer QSOs in their small sample may include objects with a smaller ratio of host FIR/submm to AGN emission. Similarly, our simple extrapolation to rest frame 60m for H1413+117 (the Cloverleaf) is in good agreement with the observations of Benford (1999) and Rowan-Robinson (2000). At redshift z2.4, changing the adopted temperature by 5K will change the estimated rest frame 60m flux by 60% and 45%, respectively. This is the dominant source of uncertainty in the estimated rest frame 60m emission, since the original (sub)mm measurements for our IRS sample are S/N5 by sample definition. Using the T=40K =1.5 assumption we extrapolate to the rest frame FIR peak of this component for all our sources, which we express as m) for consistency with the local QSO work of Schweitzer et al. (2006). These 60m luminosities are listed in Table 2. For sources with published independent 850m and 1.2mm photometry we have averaged results from the two possible extrapolations.
4 Discussion
4.1 Consistent evidence for luminous starbursts from PAH and rest frame far-infrared
Comparison of the PAH detections and limits to the rest frame far-infrared emission of the sample QSOs, and comparison to other populations is the key to testing the hypothesis that both PAH and far-infrared trace intense starbursts in the hosts. We do such comparisons first in directly observed quantities, and then using PAH luminosities in combination with FIR luminosities derived with the greybody extrapolation described above.
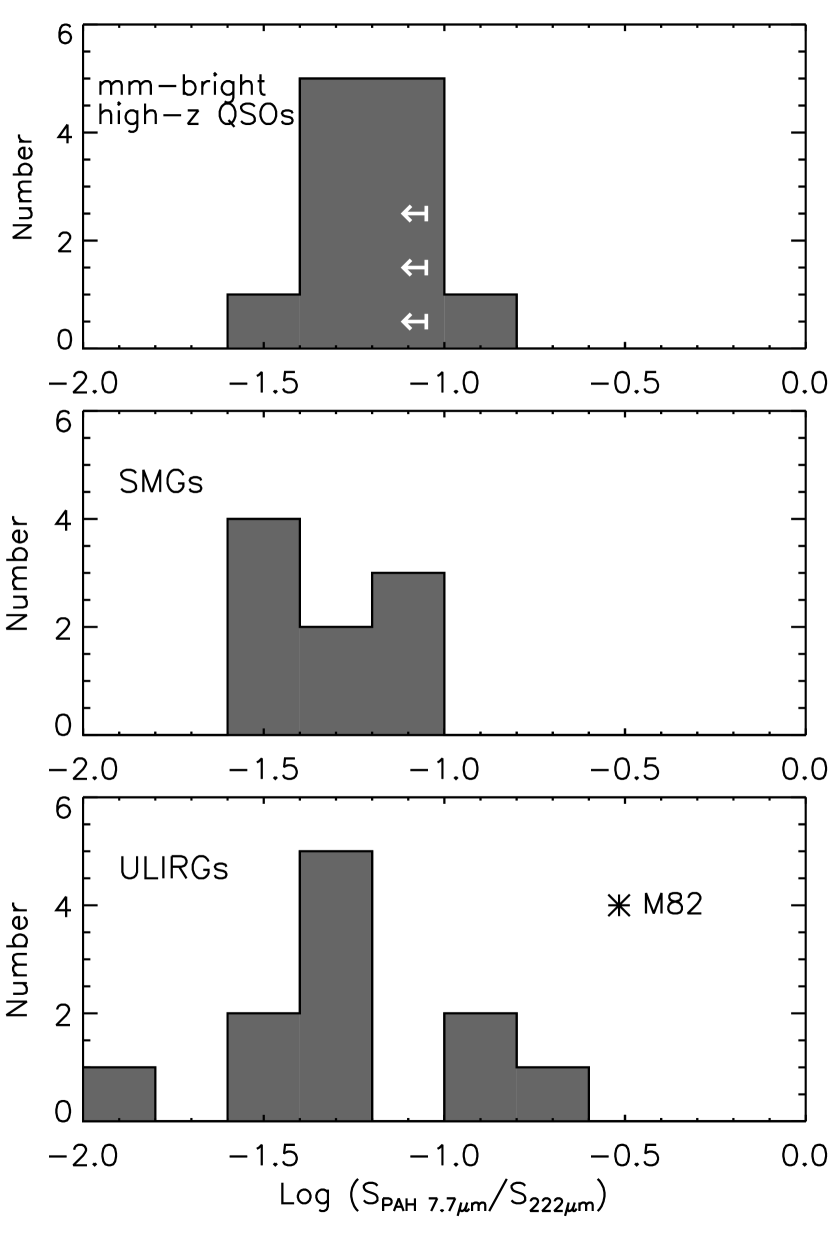
Fig. 4 shows a comparison of the PAH 7.7m peak flux density with the flux at rest frame wavelength 222m. The latter corresponds to an observed wavelength of 850m for z2.8, the specific redshift chosen for consistency with previous work on SMGs (Lutz et al., 2005; Valiante et al., 2007). This is a simple diagram based on directly observed quantities, and has minimal sensitivity to SED assumptions for the extrapolation from the observed submm/mm point to rest frame 222m. The distribution of the ratio of continuum-subtracted PAH peak flux density and rest frame FIR continuum is very similar for our mm-bright QSOs, for the submillimeter galaxy sample of Valiante et al. (2007), and for local ULIRGs. The median log() is -1.14, -1.32 and -1.26 for the QSOs, SMGs, and ULIRGs, respectively, and the distribution for the QSOs can be drawn at 25% probability from the same distribution as either the SMGs or the ULIRGs, according to a two-sided Kolomogorov-Smirnov test.
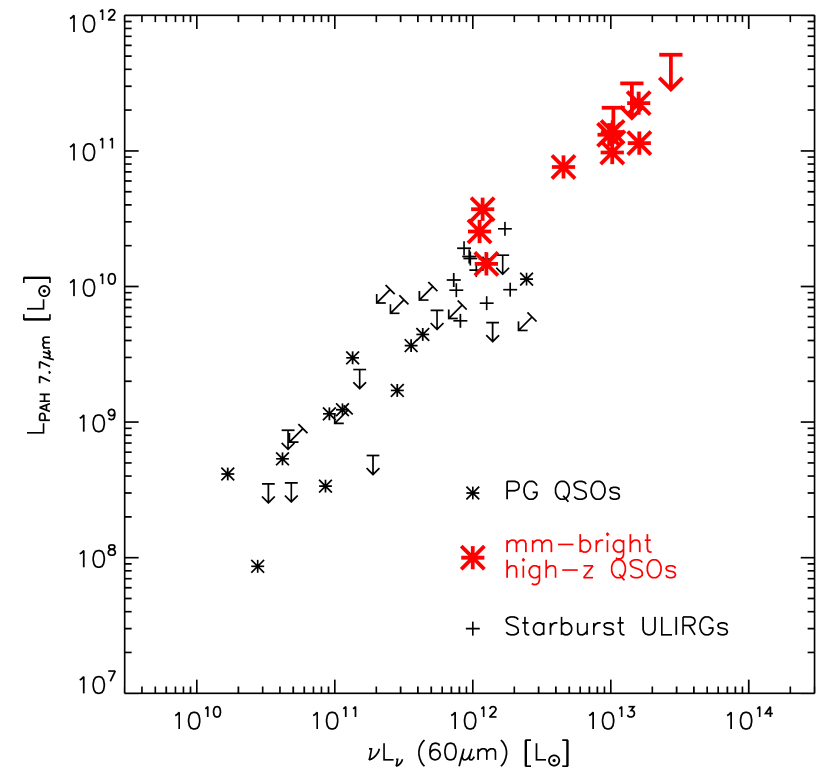
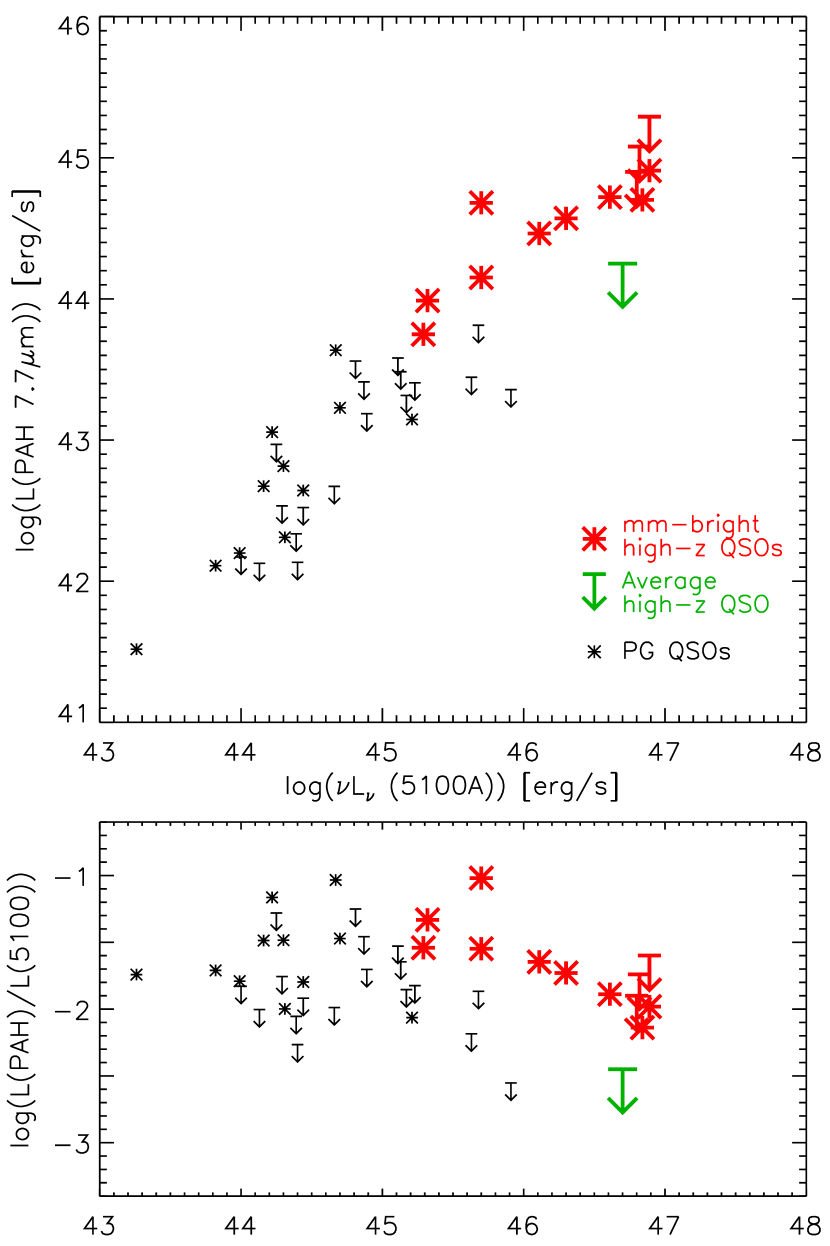
Moving from observed quantities to PAH and far-infrared luminosities, Fig. 5 shows that the mm-bright high-z QSOs extend the relation between these luminosities found for local PG QSOs by Schweitzer et al. (2006) by an order of magnitude towards higher luminosities, and that the relation for the QSO population crosses the locus for star-forming ULIRGs. The PAH and FIR data of the mm bright QSOs agree with a scenario where these two tracers are jointly originating in starbursts in the hosts. These starbursts reach SMG-like luminosities of in the most luminous (unlensed) targets of our sample.
Individual PAH-based star formation rates can be derived for our sample and are listed in Table 2. Concerning the calibration factor applied, the similarity of the PAH/FIR ratio in our sample objects and ULIRGs permits us to use the ratio L(PAH)/L(FIR) 0.013 derived for the starburst-like ULIRGs in Schweitzer et al. (2006), in combination with the calibration of FIR-based star formation rates by Kennicutt (1998). Because of the changes of PAH/FIR with galaxy properties discussed above, it is worth recalling that the resulting assumes ULIRG-like physical conditions in the interstellar medium of the galaxy observed. PAH based star formation rates for our high-z sample range from about 200 to 3000 /yr. As was found for local QSOs and their far-infrared emission (Schweitzer et al., 2006), use of the PAH diagnostic provides strong support for massive star forming events in the mm bright QSOs, at yet an order of magnitude larger luminosities.
Molecular gas CO emission has previously been searched for in six of our targets, detecting five (Table 2, all gas masses based on the conversion factor 0.8 /(K km s-1 pc2) of Downes & Solomon (1998) and our adopted cosmology). Another target (HE 1104-1805) has been searched for CO (Barvainis et al., 2002), but the nondetection may not be meaningful given the narrow bandwidth of this CO search, which may miss the target CO line for plausible uncertainties of the optical input redshift. Consistent with their intense star formation, the QSO hosts are gas-rich systems (molecular gas mass of a few 1010). Despite the large gas masses, gas exhaustion times M(H2)/SFR are short and range from 107 to years, where measured.
4.2 From mm-bright QSO1s to the unbiased QSO1 population
The previous section has discussed properties of the mm-bright part of the z2 luminous QSO1 population only. As an indication of the significance of this selection, we note that we actually observed 6 mm-bright QSOs out of the combined samples of Omont et al. (2003) and Priddey et al. (2003), which in total contain 83 distinct objects. We discuss the properties of our objects in the context to these two samples, the 1.7z3 objects among the lensed sample of Barvainis & Ivison (2002), and the local PG QSOs, in order to elucidate implications for the complete and unbiased population of luminous z2 QSO 1s.
Figure 6 shows the QSO PAH luminosity as a function of AGN rest frame optical luminosity. The mm bright QSOs clearly extend to higher luminosity the relation for local PG QSOs already discussed by Netzer et al. (2007), with a possible saturation (flattening of the relation) at the largest AGN luminosities. An extension to individual PAH detections or significant limits for the full population including mm-faint QSOs would be extremely difficult even with Spitzer capabilities. Substantial insight can already be gained, nevertheless, by adding to Fig. 6 the limit on PAH emission set by Maiolino et al. (2007) for the average of a similar redshift QSO1 sample that is not mm preselected. Unlike their average spectrum, the individual spectra from the Maiolino et al. (2007) sample are of insufficient S/N to put a limit on PAH emission that is meaningful for our analysis. Compared to mm bright QSOs from our sample of similar AGN luminosities, the limit of PAH emission for the not mm-biased average spectrum is clearly lower, by a factor 3 compared to our PAH detections. The corresponding average SFR limit is 700.
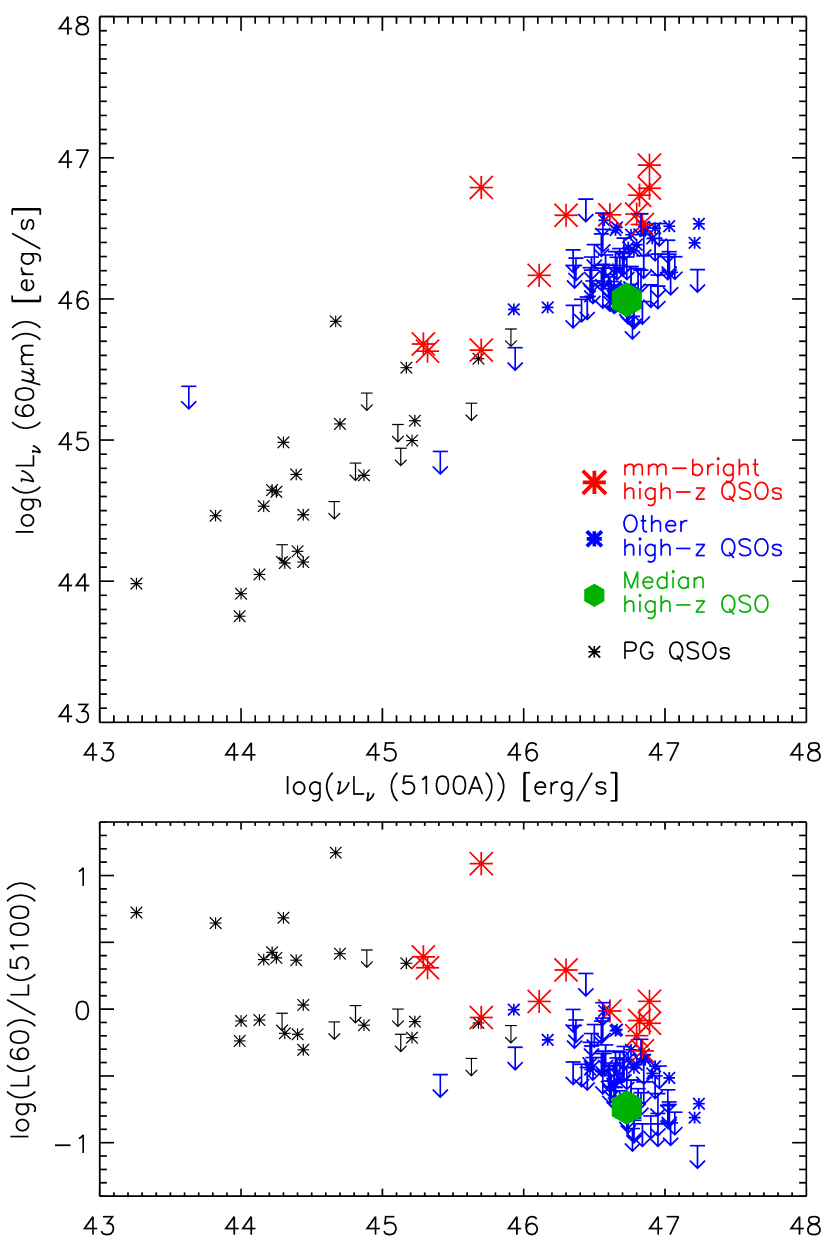
In an analogous way, Fig. 7 compares the QSO far-infrared luminosity, for which a larger number of individual measurements is available, to the AGN rest frame optical luminosity. This diagram also reminds that the z2 mm-bright QSOs, having LL5100 i.e. L0.1 LBol, are far from being extreme infrared excess objects and resemble in this property the average local QSO. In relation to the AGN luminosity, the strongest IR emission for the high-z QSOs in this diagram is for SMMJ04315+1027, which was originally detected at submm wavelengths. In this diagram, the bulk of the SMG population would extend from the location of SMMJ04315+1027 to the left, because of the typically modest luminosity of the AGN they are often hosting (e.g. Alexander et al., 2005; Valiante et al., 2007). As concerns the relation of mm bright QSOs to the total QSO population, we obtain a similar result as from the PAH data. Again, the mm-bright QSO studied here extend the relation for local QSOs and represent the far-infrared bright end of a distribution in LFIR/L5100 among the z2 QSOs. Considering only the Lerg s-1 QSOs, the mm bright QSOs have median LFIR=1046.6erg s-1, a factor of 4 larger than the median for the full population. The specific value of this factor should be considered tentative only, since the distribution for the full population is based on (sub)mm photometric points of typically low individual significance.
The PAH spectroscopy presented for mm bright high-z QSOs here, and for local QSOs in Schweitzer et al. (2006) and Netzer et al. (2007), has provided strong support for a star formation origin of the rest frame far-infrared emission in these systems. This conclusion has been derived for QSOs with LL5100, however, and needs to be critically reviewed for the even more AGN dominated objects at the mm-faint end of the high-z QSO population. In Netzer et al. (2007), we have presented a host-subtracted intrinsic AGN SED for local PG QSOs which is very broadly characterised by (5100Å)(6m)(60m), with considerable scatter between individual objects. This intrinsic SED drops significantly towards the rest frame far-infrared, but in combination with the properties of the high-z QSOs (Fig. 7) would imply that the mm-faint end of the z2 QSO population in fact may contain almost ‘pure’ AGN without strong host star formation. The AGN-heated dust could already provide the observed weak rest frame far-infrared emission. A caveat to be noted here originates from recent evidence for systematic changes in the mid-infrared to optical SEDs of luminous high-z QSOs compared to their local low-luminosity analogs (Maiolino et al., 2007; Treister et al., 2008), and from the possible detection of high-z AGN without hot dust (Jiang et al., 2006). We defer a detailed analysis of the AGN-heated dust in our sample to a future paper, but note that the larger PAH equivalent width of our average spectrum compared to the local PG average (Fig. 3) is in support of these results, given that it is combined with similar or lower ratio of PAH and 5100Å continuum in our sample compared to locally (Fig. 6). These results suggest a lower mid-infrared AGN continuum luminosity in relation to the optical AGN luminosity, and thus smaller AGN dust covering factors. They imply changes of the intrinsic AGN SED for luminous high-z QSOs compared to the Netzer et al. (2007) intrinsic SED for local QSOs, likely weakening the AGN-related 60m emission along with the weakening of the rest frame mid-infrared AGN dust emission. This decrease of AGN rest frame 60m emission would reduce again the part of the total far-infrared continuum directly ascribed to the AGN and perhaps suggest a noticeable host contribution even in mm-faint high-z QSOs. Firmly establishing the nature of the weak rest frame far-infrared emission at the mm-faint end of the z2 QSO population will hence require a more complete SED characterisation over the full rest frame infrared range.
4.3 A flattening relation of starburst and AGN luminosity
For local QSOs with L to 1046erg s-1, we have found clear correlations of the star formation indicators PAH and far-infrared continuum with AGN optical luminosity (Netzer et al., 2007), that are approximately linear over this luminosity range. The high-z QSOs extend the AGN luminosity range by another order of magnitude. The relation of PAH (star formation) and AGN luminosity is flattening at Lerg s-1 (Fig. 6). This is not yet unambiguous from the comparison of our mm-bright sample alone with the local PG QSOs. There may be a slight flattening, and the slope of a linear fit in Log(LPAH) vs. log(L5100) is 1.01 for the PAH detections among the local PG QSOs, versus 0.92 adding the high-z PAH detections to the sample, but these changes are not yet significant. The effect becomes clear by inclusion of the PAH upper limit which has been derived for the sample of Maiolino et al. (2007) that is not selected to be mm-bright (Fig. 6). In agreement with mm continuum based studies, our PAH spectroscopy does not find evidence for star formation rates above 3000yr-1 (starburst luminosities much larger than 10). This saturation occurs at luminosities similar to the upper end of the luminosity range spanned by the submm galaxy population, a limit that is often related to the star formation rate in a maximal starburst that is converting much of its gas into stars over just a few dynamical times (e.g. Tacconi et al., 2006). In support of this view, a slower than linear increase (or saturation at high AGN luminosities) is also inferred for the relation of cold gas mass and AGN luminosity, from a synopsis of CO measurements for high-z/high-L QSOs (Maiolino et al., 2007b).
Local PG QSOs are found in a region of the fundamental plane for elliptical galaxies and spheroids that is hosting moderate mass ellipticals with corresponding black hole masses , and accreting efficiently at an Eddington ratio 0.25 (Dasyra et al., 2007). Relative to the host star formation rate, their AGN growth rates are more than an order of magnitude larger than needed to explain the locally observed BH mass to bulge mass relation under the assumption of coeval growth (Netzer et al., 2007). The increased L(AGN)/L(SF) for the high-z QSOs and in particular the mm-faint ones places them in a yet more pronounced phase of AGN growth proceeding much more rapidly than host growth. The failure up to now to identify matching extreme star forming events also in other galaxies and surveys indicates this is not just due to a time delay between AGN and host growth, but must reflect intrinsically different durations of the AGN growth and host growth phases.
5 Conclusions
In the context of quantitatively constraining the coexistence of star formation and AGN activity in different classes of high redshift galaxies, we have used Spitzer-IRS mid-infrared spectroscopy to detect PAH emission in the spectra of nine out of twelve mm-bright z2 radio quiet QSOs, with optical luminosities L to 1047 erg s-1. The detections provide strong support for the presence of intense star formation up to 3000yr-1 in their hosts, that is dominating their rest frame far-infrared emission. The typical luminous z2 QSO that is not preselected for mm emission has lower star formation rate 700yr-1 and the mm-faint part of this population may include objects that are AGN dominated out to rest-frame far-infrared wavelengths, due to luminous AGN but at best modest level of star formation. Toward the high luminosity and redshift QSOs, there is a flattening in the relation between starburst and AGN luminosity that is observed for local PG QSOs, and no object in our sample has a PAH-measured star formation rate above 3000yr-1.
References
- Alexander et al. (2005) Alexander, D.M., Bauer, F.E., Chapman, S.C., Smail, I., Blain, A.W., Brandt, W.N., Ivison, R.J. 2005, ApJ, 632, 736
- Armus et al. (2007) Armus, L., et al. 2007, ApJ, 656, 148
- Barvainis et al. (1997) Barvainis, R., Maloney, P., Antonucci, R., Alloin, D. 1997, ApJ, 484, 695
- Barvainis & Ivison (2002) Barvainis, R., Ivison, R. 2002, ApJ, 571, 712
- Barvainis et al. (2002) Barvainis, R., Alloin, D., Bremer, M. 2002, A&A, 385, 399
- Beelen et al. (2006) Beelen, A., Cox, P., Benford, D.J., Dowell, C.D., Kovács, A., Bertoldi, F., Omont, A., Carilli, C.L. 2006, ApJ, 642, 694
- Benford (1999) Benford, D. 1999, PhD Thesis, California Institute of Technology
- Calzetti et al. (2007) Calzetti, D., et al. 2007, ApJ, 666, 870
- Carilli et al. (2005) Carilli, C.L., et al. 2005, ApJ, 618, 586
- Chapman et al. (2005) Chapman, S.C., Blain, A.W., Smail, I, Ivison, R.J. 2005, ApJ, 622, 772
- Dale et al. (2001) Dale, D.A., Helou, G., Contursi, A., Silbermann, N.A., Kolhatkar, S. 2001, ApJ, 549, 215
- Dasyra et al. (2007) Dasyra, K.M., et al. 2007, ApJ, 657, 102
- Downes & Solomon (1998) Downes, D., Solomon, P. 1998, ApJ, 507, 615
- Gracía-Carpio et al. (2006) Gracía-Carpio, J., García-Burillo, S., Planesas, P., Colina, L. 2006, ApJ, 640, L135
- Granato et al. (2004) Granato, G.L., de Zotti, G., Silva, L., Bressan, A., Danese, L. 2004, ApJ, 600, 580
- Greve et al. (2005) Greve, T.R., et al. 2005, MNRAS, 359, 1165
- Guélin et al. (2007) Guélin, M., et al. 2007, A&A, 462, L45
- Guilloteau et al. (1999) Guilloteau, S., Omont, A., Cox, P., McMahon, R.G., Petitjean, P. 1999, A&A, 349, 363
- Hainline et al. (2004) Hainline, L.J., Scoville, N.Z., Yun, M.S., Hawkins, D.W., Frayer, D.T., Isaak, K.G. 2004, ApJ609, 61
- Hao et al. (2005) Hao, L., et al. 2005, ApJ, 625, L75
- Hao et al. (2007) Hao, L., et al. 2007, ApJ, 655, L77
- Higdon et al. (2004) Higdon, S.J.U., et al. 2004, PASP, 116, 975
- Hopkins et al. (2006) Hopkins, P.F., Hernquist, L., Cox, T.J., Di Matteo, T., Robertson, B., Springel, V. 2006, ApJS, 163, 1
- Houck et al. (2004) Houck, J.R., et al. 2004, ApJS, 154, 18
- Iono et al. (2006) Iono, D., et al. 2006, ApJ, 645, L97
- Jiang et al. (2006) Jiang, L., et al. 2006, AJ, 132, 2127
- Kennicutt (1998) Kennicutt, R.C. 1998, ARA&A, 36, 189
- Knudsen et al. (2003) Knudsen, K.K., van der Werf, P.P., Jaffe, W. 2003 A&A, 411, 343
- Lutz et al. (2005) Lutz, D., et al. 2005, ApJ, 625, L83
- Lutz et al. (2007) Lutz, D., et al. 2007, ApJ, 661, L25
- Maiolino et al. (2005) Maiolino, R., et al. 2005 A&A, 440, L51
- Maiolino et al. (2007) Maiolino, R., Shemmer, O., Imanishi, M., Netzer, H., Oliva, E., Lutz, D., Sturm, E. 2007, A&A, 468, 979
- Maiolino et al. (2007b) Maiolino, R., et al. 2007, A&A, 472, L33
- Menéndez-Delmestre et al. (2007) Menéndez-Delmestre, K., et al. 2007 ApJ, 655, L65
- Netzer et al. (2007) Netzer, H., et al. 2007, ApJ, 666, 806
- Norman & Scoville (1988) Norman, C., Scoville, N.Z., 1988, ApJ, 332, 124
- Omont et al. (2003) Omont, A., Beelen, A., Bertoldi, F., Cox, P., Carilli, C.L., Priddey, R.S., McMahon, R.G., Isaak, K.G. 2003, A&A, 398, 857
- Pope et al. (2008) Pope, A., et al. 2008, ApJ, 675, 1171
- Priddey et al. (2003) Priddey, R.S., Isaak, K.G., McMahon, R.G., Omont, A. 2003, MNRAS, 339, 1183
- Riechers et al. (2006) Riechers, D.A., Walter, F., Carilli, C.L., Weiss, A., Bertoldi, F., Menten, K.M., Knudsen, K.K., Cox, P. 2006, ApJ, 645, L13
- Rigopoulou et al. (1999) Rigopoulou, D., Spoon, H.W.W., Genzel, R., Lutz, D., Moorwood, A.F.M., Tran, Q.D. 1999, AJ, 118, 2625
- Rowan-Robinson (2000) Rowan-Robinson, M. 2000, MNRAS, 316, 885
- Sanders et al. (1988) Sanders, D.B., Soifer, B.T., Elias, J.H., Madore, B.F., Matthews, K., Neugebauer, G., Scoville, N.Z. 1988, ApJ, 325, 74
- Schweitzer et al. (2006) Schweitzer, M., et al. 2006, ApJ, 649, 79
- Siebenmorgen et al. (2005) Siebenmorgen, R., Haas, M., Krügel, E., Schulz, B. 2005, A&A, 436, L5
- Solomon et al. (2003) Solomon, P., Vanden Bout, P., Carilli, C., Guélin, M. 2003, Nature, 426, 636
- Solomon & Vanden Bout (2005) Solomon, P.M., Vanden Bout, P.A. 2005, ARA&A, 43, 677
- Springel et al. (2005) Springel, V., Di Matteo, T., Hernquist, L. 2005, MNRAS, 361, 776
- Spoon et al. (2002) Spoon, H.W.W., Keane, V., Tielens, A.G.G.M., Lutz, D., Moorwood, A.F.M., Laurent, O. 2002, A&A, 385, 1022
- Sturm et al. (2000) Sturm, E., Lutz, D., Tran, D., Feuchtgruber, H., Genzel, R., Kunze, D., Moorwood, A.F.M., Thornley, M.D. 2000, A&A, 358, 481
- Tacconi et al. (2006) Tacconi, L.J., et al. 2006, ApJ, 640, 228
- Teplitz et al. (2007) Teplitz, H.I., et al. 2007, ApJ, 659, 941
- Treister et al. (2008) Treister, E., Krolik, J.H., Dullemond, C. 2008, ApJ, in press (arXiv 0801.3849)
- Valiante et al. (2007) Valiante, E., et al. 2007, ApJ, 660, 1060
- Vanden Berk et al. (2001) Vanden Berk D.E., et al. 2001, AJ, 122, 549
- Venturini & Solomon (2003) Venturini, S., Solomon, P.M. 2003, ApJ, 590, 740
- Weedman et al. (2005) Weedman, D.W., et al. 2005, ApJ, 633, 706
- Weedman et al. (2006) Weedman, D.W., Le Floc’h, E., Higdon, S.J.U., Higdon, L.J., Houck, J.R. 2006, ApJ, 638, 613
- Weiß et al. (2003) Weiß, A., Henkel, C., Downes, D., Walter, F. 2003, A&A, 409, L41
- Yan et al. (2007) Yan, L., et al. 2007, ApJ, 658, 778
| Name | z | RA | DEC | Ref. | log() | |
|---|---|---|---|---|---|---|
| J2000.0 | J2000.0 | erg/s | ||||
| LBQS 0018-0220 | 2.596 | 0:21:27.30 | 2:03:33.0 | 1.0 | 46.82 | |
| HE 0230-2130 | 2.162 | 2:32:33.10 | 21:17:26.0 | 14.5 | B02 | 45.29 |
| SMMJ04315+10277 | 2.837 | 4:13:27.26 | +10:27:40.5 | 1.3 | K03 | 45.70 |
| KUV 0806+4037 | 1.795 | 8:12:00.54 | +40:28:13.0 | 1.0 | 46.30 | |
| RXJ0911.4+0551 | 2.793 | 9:11:27.61 | +5:50:54.1 | 20.0 | B02 | 45.32 |
| HS 1002+4400 | 2.097 | 10:05:17.43 | +43:46:09.3 | 1.0 | 46.84 | |
| HE 1104-1805 | 2.305 | 11:06:33.40 | 18:21:23.0 | 10.8 | B02 | 45.70 |
| LBQS 1230+1627B | 2.735 | 12:33:10.40 | +16:10:52.0 | 1.0 | 46.89 | |
| SBS 1408+567 | 2.583 | 14:09:55.57 | +56:28:26.5 | 1.0 | 46.89 | |
| H1413+117 | 2.558 | 14:15:46.27 | +11:29:43.4 | 11.0 | V03 | 46.11 |
| HS1611+4719 | 2.35 | 16:12:39.90 | +47:11:57.0 | 1.0 | 46.61 | |
| J164914.9+530316 | 2.26 | 16:49:14.90 | +53:03:16.0 | 1.0 | 46.89 |
References. — Lensing magnifications are adopted from: B02: Barvainis & Ivison (2002), K03: Knudsen et al. (2003), V03: Venturini & Solomon (2003). Throughout the paper, we present fluxes or flux densities as observed, but luminosities, masses, and star formation rates corrected for these adopted magnifications.
| Name | Peak (PAH7.7) | NoiseaaMeasured noise per spectral sample in the rest frame 6.5–8m range | F (PAH7.7) | L (PAH7.7) | SFR (PAH) | M (H2) | |
|---|---|---|---|---|---|---|---|
| mJy | mJy | W cm-2 | erg s-1 | erg s-1 | yr-1 | 1010 | |
| LBQS 0018-0220 | 1.9 | 0.27 | 2.3 | 12.0 | 543 | 4200 | 3.5bbHainline et al. (2004) |
| HE 0230-2130 | 1.7 | 0.21 | 2.3 | 0.6 | 48 | 197 | |
| SMMJ04315+10277 | 0.8 | 0.20 | 0.8 | 4.8 | 615 | 1680 | 13.3bbHainline et al. (2004) |
| KUV 0806+4037 | 1.1 | 0.30 | 1.7 | 3.7 | 392 | 1300 | |
| RXJ0911.4+0551 | 2.7 | 0.21 | 3.0 | 1.0 | 43 | 340 | 0.5bbHainline et al. (2004) |
| HS 1002+4400 | 1.1 | 0.35 | 1.6 | 5.0 | 337 | 1760 | |
| HE 1104-1805 | 2.8 | 0.36 | 3.8 | 1.4 | 43 | 496 | |
| LBQS 1230+1627B | 1.2 | 0.28 | 1.4 | 8.1 | 609 | 2840 | 2.4ccGuilloteau et al. (1999) |
| SBS 1408+567 | 3.0 | 0.32 | 3.6 | 19.6 | 888 | 6840 | 6.6bbHainline et al. (2004) |
| H1413+117 | 5.1 | 0.75 | 6.1 | 2.9 | 147 | 1020 | 4.0ddWeiß et al. (2003) |
| HS1611+4719 | 1.0 | 0.19 | 1.2 | 5.3 | 394 | 1840 | |
| J164914.9+530316 | 1.5 | 0.24 | 2.0 | 7.9 | 399 | 2780 |