Test and Developments of Crystals for a High-Resolution Electromagnetic Calorimeter for PANDA
Abstract
The particle beam facility called GSI, located in Darmstadt (Germany), will within a few years be upgraded with a new complex of accelerators. At the new storage ring HESR, the PANDA experiment aims to study antiproton induced reactions. The electromagnetic calorimeter will constitute a major part of the experimental set-up. The detector will be used to detect photons and is planned to consist of thousands of scintillating crystals.
In this thesis, the energy resolution of crystals and its dependence on the incoming energy has been investigated. The crystals used were first prototype crystals of a new generation, characterized by a higher light yield. Two crystal types with different shape and light yield, manufactured by suppliers in China and Russia, were used.
An experiments were performed on two arrays of crystals. Photon beams of eight different energies, ranging from 64 MeV to 715 MeV, were directed into the center crystals. Due to the development of electromagnetic showers the energy was deposited over all nine crystals. Photo Multiplier Tubes were used to read out the response of the scintillators.
The energy peaks obtained in the experiment were not entirely symmetric. The general line shape of the experimental energy response was a Gaussian with an asymmetric tail towards lower energies due to energy losses. From this line shape one can get a measure of the width, sigma, of the peak. In this thesis, the sigma value was obtained using three different methods:
-
1.
FWHM (Full Width Half Maximum)
-
2.
Two Gaussian method
-
3.
Right side fit
All three methods result in different energy resolutions and the goal was to determine which method describes the course of events most accurately.
The FWHM method is used whenever one is dealing with non-Gaussian distributions. The second method is a method in which the asymmetric energy peak is represented by two different Gaussian distributions. This method reproduces more accurate the line shape of the energy peaks due to the energy losses caused by the wrapping material and the statistical fluctuations of the amount of energy escaping the limited detector volume. The right side fit is a method where only the right side of the peak is fitted with a Gaussian function and the tail on the left side of it is completely ignored.
The real energy resolution does not depend on what method is used in describing it. It is however important to find a theory that well describes the energy resolution of the crystals used in the experiments.
Calculations showed that using the two Gaussian method delivered the lowest sigma value and also the lowest energy resolution. The FWHM method gave the largest sigma value and also the largest energy resolution. The right side fit gave an energy resolution with values between the two other methods, thus this method was chosen to describe the crystals. Error bars were estimated from the other two approaches. The obtained energy resolution for the Russian crystals, , was much better than the resolution for the Chinese crystals, . It actually came close to what was described in the Conceptual Design Report (CDR). However, the energy resolution mentioned in the CDR, , was obtained for a significantly larger crystal array containing most of the shower. This response function was determined at a moderate operating temperature of +8 degrees C, while the measurements for this thesis were performed at -25 degrees C. The present result may be limited by a significantly thicker layer of dead material between the crystal elements. Therefore the use of the signal peak method might be justified to estimate the overall light output of the crystal array. Separating the expected contribution due to energy losses may very well be reasonable, due to the limited transversal dimensions of the crystal array.
Some simulations were as well performed. These showed that the showers spread beyond the nine crystals used in the experiment. This was especially noticeable when incoming photons with a high energy were used.
Chapter 1 Introduction
PANDA is an international collaboration. The acronym stands for antiProton ANihilation DArmstadt and the objective for this collaboration is to increase the understanding of the strong force. The facility, at which the research is conducted, is located at GSI (Gesellschaft für Schwerionen) in Darmstadt, Germany.
Over 30 years ago, the GSI laboratory was founded; the goal was to build a research facility for nuclear physics and related areas. The construction of a new heavy-ion accelerator soon attracted scientists from all over Europe, and since the upgrade 15 years ago, GSI has evolved into an international research centre using beams of heavy-ions up to en energy of 2 AGeV.
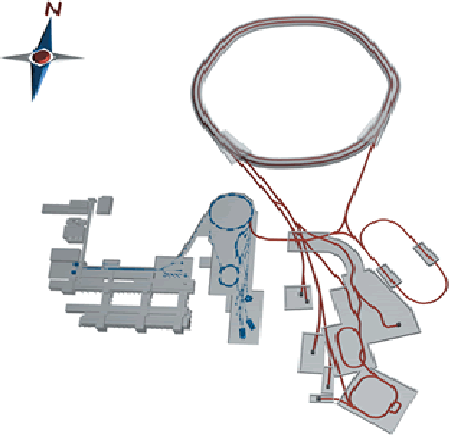
Today there are plans for a major new research facility at GSI. The new facility will provide a range of particle beams from proton and antiproton beams to ion beams up to Uranium. The extension will mainly consist of a new 100/200 Tm double-ring synchrotron referred to as SIS100/200 and storage rings for collecting and cooling the beam as well as for phase space optimization and experiments.
Research with antiprotons, hadron spectroscopy and hadronic matter will be conducted in the new facilities to gain a greater knowledge of the strong force. When colliding protons and antiprotons into each other, particles with gluonic degrees of freedom are produced. Studies of these particles, such as precision measurements of the mass, width and decay branches of charmonium aim to seek answers to questions like “Where does the mass of a nucleon come from?”.
Charmonium will be studied carefully at GSI since the coupling constant of this meson is not too large and relativistic problems are considered to be manageable. Another interesting property of charmonium is that the mass of the charm quark is large enough to motivate the use of perturbative QCD (Quantum Chromo Dynamics) and still small enough to keep the non-perturbative corrections. The reaction chain in which the charmonium hybrid state is created, will eventually end with only photons and electrons as the final products, as shown below.[1]
The reaction chain described above ends with seven gammas, one electron and one positron. The gammas can only be detected using an Electromagnetic CALorimeter (ECAL) of nearly 4 solid angle coverage. As charged particle detectors must be positioned closer to the target than the electromagnetic calorimeter, the radius for this detector grows considerably and thousands of scintillator crystals will be needed. The electrons and positrons can be detected using either an ECAL or a charge sensitive detector. It is required that the ECAL has a high resolution and a sufficiently fast response to detect all particles created in the decay chain.
My role in the PANDA-project has been to perform measurements on Chinese and Russian crystals in Germany to investigate their energy resolution and to determine if the crystals match the desired energy resolution of .
This report treats both the physics behind the experiment and the connection to the research pursued at GSI in Darmstadt. Firstly, the reader will be guided through the theory and background to the experiments. The reader will be introduced to the PANDA experiment as well as the reason to, and function of, electromagnetic calorimeters. The preparations in Giessen and the measurements in Mainz will be presented in chapters 5 and 6, as well as the experimental set-up, methods used and the obtained results. Finally, a summary and outlook will be presented.
Chapter 2 Theoretical Background
2.1 Fundamental Building Blocks
The matter in nature is made up of two fundamental groups of building blocks. These non-excited elementary particles all have spin 1/2 and are called fermions. The fermions are either leptons or quarks. In total, six leptons and six quarks have been found. According to their properties, these have been classified in three generations, or flavours. The leptons are called , , , , and . The first three leptons carry the charge -e while the last three, called the neutrinos, have no charge. Each lepton has the same flavour, or belongs to the same generation, as its corresponding neutrino. In addition to these leptons there exist six antiparticles. They are called , , , , and . The charged leptons interact via both the electromagnetic force and the weak force, while the neutral leptons interact weakly.
The six quarks occur in flavours consisting of two particles, just like the leptons. The quarks are called up-, down-, strange-, charm-, top- and bottom quarks. Each generation consists of a quark with charge and a quark with charge .[2]
A single quark has never been found, this phenomenon is called confinement. Instead, the quarks stick to each other in formations called hadrons. Hadrons consisting of two quarks are called mesons, hadrons consisting of three quarks are called baryons.
To ensure that the quarks obey the Pauli principle, one must have a way to discern them quark from another. The quarks have therefore been allotted colour charges. They carry either red, blue or green colour, while the antiquarks carry anti-red, anti-blue or anti-green.
The interaction binding the quarks into hadrons is called the strong interaction and the mediator of this force is the gluon. The gluons couple to the colour charge carried by the gluons in the same way as the electromagnetic force couples to the charge of particles. The gluons carry colour and anticolour simultaneously.[4]
2.2 Particle Interactions
Particles interact via something called mediators. A mediator is a particle that is exchanged in the interaction process. To depict the interactions in a pedagogical way, Feynman diagrams are often used. These are diagrams showing both time and space and each symbol in this diagram corresponds to a certain matrix element. There are certain rules connected to Feynman diagrams. The time axis usually runs upwards, while the space axis runs from left to right. Different kinds of lines characterize different particles in the interaction process. Straight lines correspond to wave functions of fermions, while antiparticles are depicted having arrows pointing backwards in time. Photons have wavy lines, heavy vector boson have dashed lines and gluons have corkscrew-lines.
The particles interact at the point called the vertex. If more than three particles meet, the points are called vetices. At this point energy, momentum and electric charge must be conserved. Here, particles not being present in the initial state often show up. These are called virtual particles and do not have to satisfy the energy conservation law since they live for a very short period of time.
For each vertex there is a transition amplitude that contains a factor . is a dimensionless strength parameter which is independent of the particle types involved in the process, though it depends on what interaction is taking place. The value for the strong interaction is 1, while the values for the weak and electromagnetic forces are and 1/137 respectively.[3] If there are three vertices in an interaction process, the probability for this interaction to take place is .[4]
2.3 Quantum Electrodynamics and Quantum
Chromodynamics
Quantum ElectroDynamics, or QED, is the quantized, relativistic theory of electrons and positrons in interaction with the electromagnetic field. The electromagnetic force acts on large distances and the mediator responsible for this interaction is the spin-1 boson called the photon.
Quantum ChromoDynamics, QCD, is the theory of the quark (and gluon) interaction and it focuses on the strong force. This force, acting between quarks, is much stronger than the electromagnetic force and it also acts on much smaller distances. The particles responsible for the interaction are in this case the eight massless spin-1 bosons called gluons. These interact with the quarks in the nuclei.[5]
2.4 Standard Model
The four elementary interactions known are the strong force, the weak force, the electromagnetic force and gravitation. The electromagnetic force and the weak force have been combined into what is called the electroweak force and one is working on a theory on how to combine the remaining two. The standard model is a name for the existing model of elementary particles and their interactions. It comprises both the theory of the electroweak interaction and quantum chromodynamics.
The force mediators are the gluons, the photons, the vector bosons and and possibly the graviton which has not yet been discovered. Since the gluons couple to colour and carry colour as well as anticolour, the gluons couple to themselves.[5]
2.5 Gluons and Quarks
Gluons attract other gluons because of the colour (or anticolour) they carry. Instead of spreading out in space like the electric field lines between charges, the gluons are “trapped” in something called a flux tube that links the quarks. The harder one tries to separate the quarks, the stronger the field in between them gets. It would simply take an infinite amount of energy to completely separate the quarks. The only known way to break the gluon flux tube is to take the energy stored in the field and create two new coloured quarks.[6]
Coloured objects are never seen in nature, this applies to both quarks and gluons and the phenomenon is called confinement. Combinations e.g. of many gluons should on the other hand be possible to observe. These could consist of many gluons combining to colour neutral particles e.g. a blue/anti-red and a red/anti-blue gluon.
Three jet events in electron-positron annihilations are a strong indication for their existence. In such annihilation processes two new quarks that spread in opposite directions are (thought to be) created. As the quark and antiquark “escape” each other, new mesons and baryons are created as jets. Therefore an odd number of jets must originate from gluons.
Gluons seem to be able to emit other gluons as well.
2.6 Exotic Particles
Exotic particles is a name for hadrons other than mesons and baryons, including particles with excited gluonic fields. The particles with exotic gluonic fields are either so-called glueballs or hybrids. The glueballs consist only of gluons, while the hybrids consist of excited gluons as well as quarks.[15]
2.6.1 Glueballs
The glueball is thought to have a very small radius - in the range of m, a hadron has a diameter of approximately m.[16] Since no free coloured objects exist, glueballs must be colour neutral objects. The glueball is predicted to consist of at least two gluons carrying for instance blue/anti-red and red/anti-blue colour. Another option is three gluons combining to a so-called white object. The three gluons making up the glueball would then be for instance red/anti-blue, green/anti-red and blue/anti-green. There is nothing preventing more complex formations to exist either. Glueballs may also consist of more than a two or three gluons as long as the resulting particle is colour neutral.
The existence of glueballs has not yet been proven though several models predict them. Calculations using QCD are not easy to perform (but have been done) and thus massive simulations using the most modern model, called lattice QCD, have to be conducted. Using lattice QCD simulations, time-space is regarded as a grid, called a lattice. In these simulations quarks and antiquarks are connected by lines. The results from these simulations show that gluons actually do turn up.[6]
Glueballs with exotic quantum numbers (quantum numbers that are forbidden for ordinary mesons and fermion-antifermion systems) are called oddballs. Since they cannot mix with mesons they should be easier to identify than glueballs.
2.6.2 Hybrids
The hybrids are made up of both quarks and excited gluons. An example of this mixing could possible be a quark carrying red colour, an anti-blue antiquark and a blue/anti-red gluon. This results in a “white” particle.
When using lattice QCD to find indications of hybrids, one has found an interesting property of the meson. This property occurs if the lines linking the quarks and antiquarks in the simulation program are not stretched out enough. What happens is that a slack in the line between the particles arise and the configuration may start to spin like a jumping rope. In these situations one can think of an extra gluon being attached to the meson. This increases the energy and the hybrid will be more energetic than the original meson.
The detection of the charmonium hybrids in the decay channel discussed in chapter 1 is one of the prime objectives of PANDA. This hybrid consists of a charm quark, an anticharm quark and gluonic excitations.
Chapter 3 Future Experiments at GSI
Three very interesting things to study in the research area of hadron physics are: confinement, the creation of mass and the search for new forms of matter. The fact is that only about 2 of the nucleon mass is made up of quark masses. The rest must be connected to the kinetic energy and the interaction energy of the quarks making up the nucleus.
To fully understand the three phenomena mentioned above, physicists need a greater understanding of the strong force. They plan to collide protons with antiprotons and thereby create new, short-lived particles. One possibility is to create charmonium, a meson consisting of a charm quark and an anticharm quark. Scientists thereby hope to gain some understanding to the strong force and find evidence of the existence of glueballs and hybrids.[7]
3.1 Future Upgrade of the GSI Facility
Today, the facility at GSI consists of a LINAC (LINear ACcelerator), a heavy-ion synchrotron SIS18 and an Experimental Storage/cooling Ring (ESR). The new facility will have two separate synchrotron accelerator rings, both with a circumference of about 1100m. The new facility will as well be complemented by three additional storage rings; the CR (Collector Ring), the NESR (New Experimental Storage Ring) and the HESR (High-energy Storage Ring).
The new detectors needed at GSI have to be of top quality to identify the correct masses, nuclear charges, energies, momentum, angles etc. The detector for the proton-antiproton collisions must be designed to accept as many as annihilations per second and simultaneously allow for triggering on rare events with very low cross-section.
For complete information on e.g. spectroscopy measurements and the reconstruction of invariant masses from neutral and charged decay products, a nearly full coverage of the solid angle is required. For particle identification it is as well very important to have excellent energy and angular resolution, both in the case of charged particles and for photons.[1]
3.2 Charmonium in the PANDA collaboration
The reason for studying charmonium, instead of any other meson, in the PANDA collaboration is that the charmonium states are very narrow and separated. The cross-sections for the prediction of these states are high, the relativistic effects are small and perturbative methods can be applied. By analogy one can say that the charmonium is “the positronium of QCD” [9]. By that one means that both positronium (the bound state of an electron and a positron) and charmonium are systems consisting of a particle and its antiparticle, the difference is the force acting between them.[4]
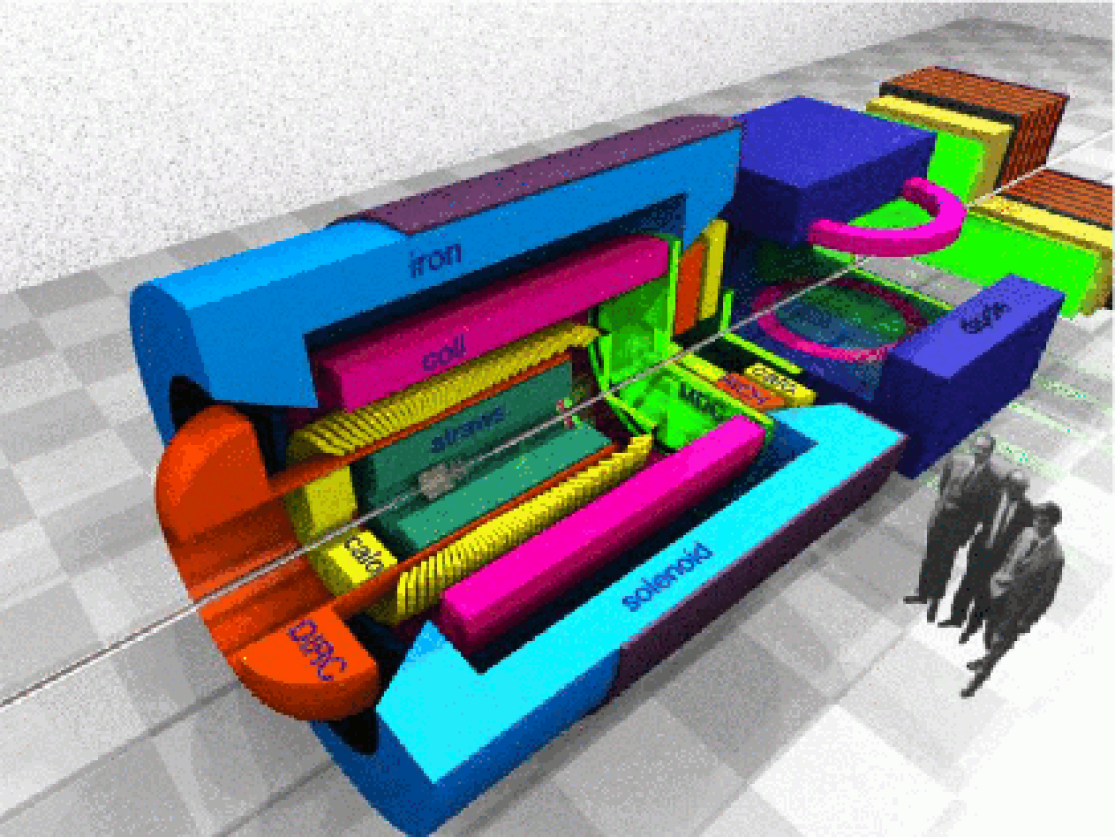
Charmonium states often end up in an electron-positron final state. These states are sometimes accompanied by photons and to detect these photons, a new and powerful electromagnetic calorimeter is needed. An illustration of the proposed PANDA detector (including an electromagnetic calorimeter) labeled “calo” in yellow in figure 3.2.
Chapter 4 Electromagnetic Calorimeter
4.1 Principles of an Electromagnetic Calorimeter
ECALs are used to detect and measure the energy and impact point of photons, electrons and positrons with energies above 100 MeV. The detection principle is based on registering the total absorption of the electromagnetic shower [5], which comprises secondary particles created in bremsstrahlung and pair production processes inside the detector.
Calorimeters can be constructed as homogeneous devices or in a sampling mode, when only part of the shower energy is detected in active detectors and the major part just absorbed in high density material. The optimum resolution can be obtained for homogeneous calorimeters using liquid noble gases or high density and fast scintillation crystals. The ECAL of PANDA is supposed to be built with scintillating crystals covering all showers. The close arrangement of crystals will detect the full energy of the cascade created by an incoming photon.
The crystals produce visible wavelength photons when incoming photons excite the detector material. The produced light can then be converted into electrical signals using photo sensors such as photo multiplier tubes or avalanche photo diodes.
The ECAL detects both the energy and the momentum of the particle. The resolution of the momentum measurements decreases linearly with the momentum of the particle while the energy resolution increase as a function of .
To identify the detected particle, mass and charge are in most cases sufficient. The momentum is obtained by deflecting the particle in a magnetic field and reconstructing the track in a position sensitive detector volume consisting of straw tubes or gas detectors such as a TPC (Time Projection Chamber). The mass is usually obtained by additional measurements.[4]
4.2 Energy Losses
In general, the interaction of the incoming photons with the detector material depends strongly on the energy of the incoming photons. If the incoming photons have a high energy, this interaction process will generate secondary particles which themselves generate new particles.
A shower or a cascade will be formed in cases where the incoming photon energy is high. Initially, a phenomenon called pair production will occur and when the energy has decreased, processes like the photoelectric effect and Compton scattering will take over. The shower process spreads in all directions but prominently in the longitudinal one [2].
4.2.1 Bremsstrahlung
The shower is generated by high-energy electrons or photons which lose energy due to bremsstrahlung when the particle interacts with the detector material and photons are emitted.
Translated into English “Bremsstrahlung” becomes braking
radiation.
Bremsstrahlung occurs as particles are accelerated and
slowed down by the electric field from the nuclei in
matter.[2]
The amount of energy lost in bremsstrahlung depends on the mass and charge of the particle according to equation 4.1 [13].
| (4.1) |
is the lost energy, E is the energy of the particle and is the distance traveled by the particle. At medium energies only electrons and positrons have such low mass that the cross-section becomes significantly large.
4.2.2 Shower Process
Pair production is the interaction process between incoming particles and matter that requires the highest energy [2]. In this process the incoming photon converts into an electron-position pair. Bremsstrahlung then occurs and the newly formed electron (or positron) will be deviated and a photon will be emitted.
This shower, or cascade process, continues until the critical energy of the particles is reached. At this electron energy, the cross-section of bremsstrahlung becomes similar to that of pure ionization. Therefore, no further secondary photons are generated and the shower is stopped. The critical energy depends on the proton number (atomic number) Z of the detector material.[14] A material with a high Z-value, such as lead tungstate, corresponds to a low critical energy.
| (4.2) |
At energies below a few MeV, losses are dominated by the photoelectric effect and Compton scattering. In the photoelectric effect, the photon is absorbed by the atom as a whole and an electron carrying the energy is emitted. In Compton scattering the photon scatters off from an atomic electron. The photoelectric effect and Compton scattering are both processes in which the photons lose energy by collisions with the atomic electrons. This in turn causes ionization of the atoms in the material.
Concerning the performed experiments in Mainz, pair production was the dominant interaction process for the incoming high energy photons, while the photoelectric effect and the Compton scattering were dominant in the end of the shower processes.
4.3 Radiation Length
In connection to the showers, the radiation length should also be mentioned. The radiation length is physically described as the distance over which the energy of an incoming electron decreases by a factor of [18]. For a photon, this distance can be said to correspond to the distance over which there is an approximate probability of 54% for a -ray to perform pair production.
The radiation length has an asymptotic value for each material at sufficiently high energies and is given by equation 4.3.[2]
| (4.3) |
In 4.3, m represents the mass of an electron, c is the speed of light, is Planck’s constant divided by , Z is the atomic number, is the coupling constant and is the density of atoms per in the material.
The radiation length for crystals is approximately 0.9cm [19]. Materials with a high Z-value have a short radiation length. This is a desired property since it decreases the calorimeter depth and reduces the overall dimensions of the detector. This is particularly important if all components have to be installed inside a superconducting solenoid, such as in case of PANDA.
4.4 Electromagnetic Calorimeter at GSI
Di-electrons ( pairs) and photons will be detected with an electromagnetic calorimeter made of crystals. The PANDA electromagnetic calorimeter will consist of four parts: the barrel, the backward endcap, the forward endcap and the forward spectrometer. The inner part of the barrel will have a diameter of 50cm and it will contain more than 9000 crystals. Both endcaps will consist of approximately 4-5000 crystals. The final geometry and granularity has not been fixed yet. Simulations however suggest a minimum depth of 20cm and a typical cross-section of 2cm, similar to the Moliere radius of the crystals. The Moliere radius is quantity that describes the electromagnetic interaction properties. It is often used when describing the transversed dimensions of electromagnetic showers in a material [11].
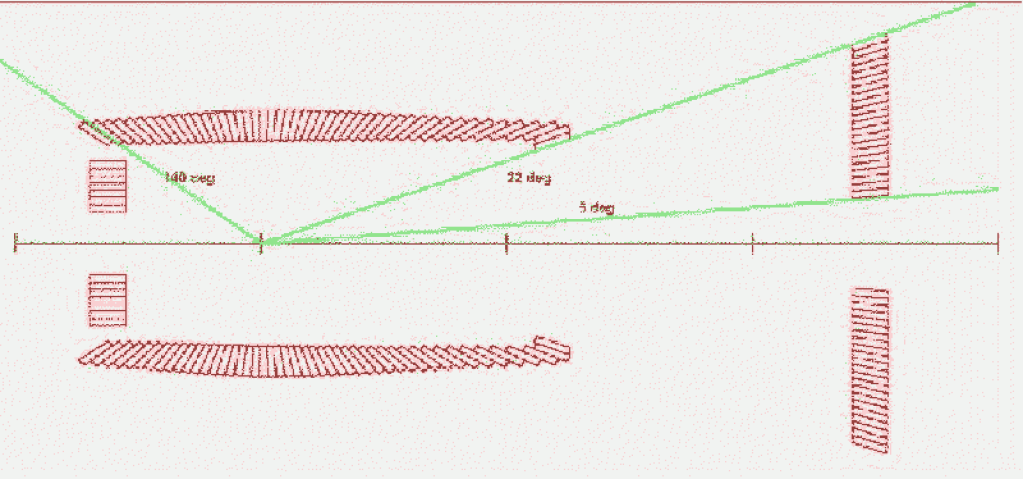
The forward spectrometer is located 7 meters downstream of the target. It will have an approximate area of 3 .[10]
4.5 Crystal Properties
The crystals have some very attractive features: they are fast scintillating crystals with a short decay time 10ns, a short radiation length (0.9cm) and a Moliere radius of 2.2cm. The short decay time allows experiments at high count rates and a fast digitization even for developing low level trigger information [12].
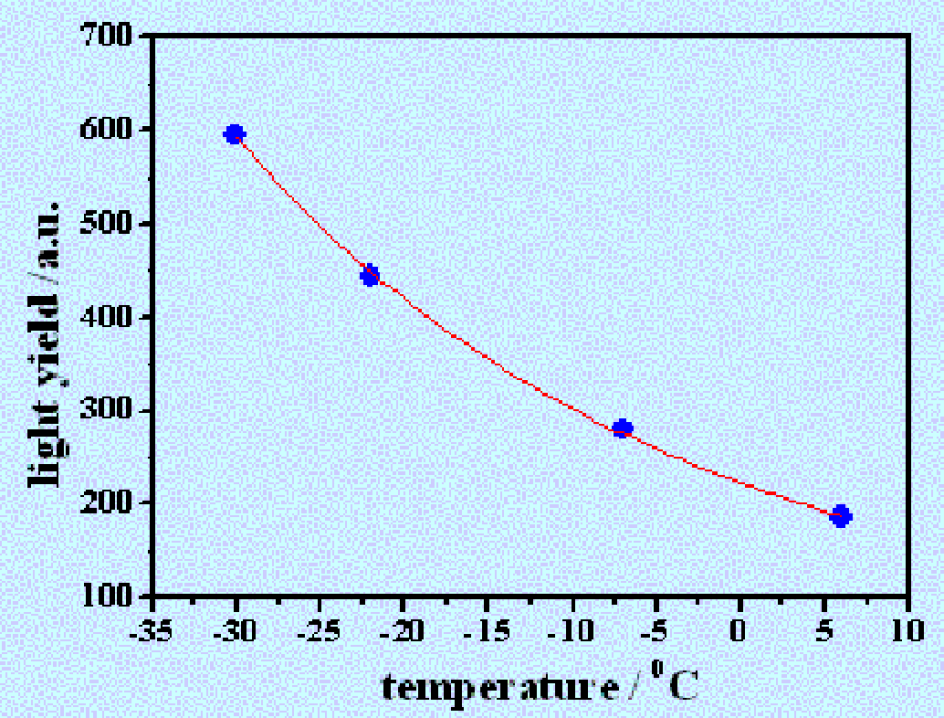
However, the luminescence yield correspond to only approximately 1% of NaI(Tl) crystals. Due to thermal quenching, the luminescence yield can be significantly increased by operating the crystals well below room temperature.
The energy resolution of the crystals, , is proportional to where N is the number of detected photons. Due to the possibilities to increase the light yield of the crystals, a detailed research program has been started to significantly improve it.
An envisaged high granularity enhances the detector resolving power with respect to position reconstruction and a minimized pile-up probability. The crystals are in addition very compact since their radiation length is short. This is a desired feature since a lot of money and space can be saved by building smaller detectors.
The crystals used in the measurements in Mainz were grown by the company SIC at Shanghai, China and the Bogoroditsk Techno-Chemical Plant, Russia. The Chinese crystals were tapered and had a length of 12cm, foreseen as prototypes for the proposed Photon Ball at COSY, Jülich, Germany. As a rule of thumb, the crystals should have a length of 15-20 radiation lengths and the dimensions of these crystals may therefore indicate bad results. The light yield of the Chinese crystals was approximately 10 photoelectrons/MeV. The second array consisted of recently grown crystals from SIC as well as Bogoroditsk. Both kinds had the same dimensions, and a significantly improved light yield. The Russian samples were produced with improved growing technology and delivered a light yield nearly twice as much as the mass produced crystals delivered for the CMS calorimeter at CERN.
| Property | Chinese | Russian |
|---|---|---|
| Length [cm] | 12 | 15 |
| Forward Dimension [] | ||
| Backward Dimension [] | ||
| Decay time [ns] | 20 | 20 |
| Light Yield [phe/MeV] | 10 | 20 |
Chapter 5 Preparatory Measurements in Giessen
5.1 Crystal Preparation
Normally, the crystals do not need any special preparation apart from attaching the read-out devices at the back of each crystal. However, in this case two different types of crystals were used. The older Chinese crystals had already been wrapped individually in various materials and in order to have as similar set-ups as possible, it was decided that also the new Russian crystals were to be wrapped in the same way. This individual wrapping procedure is something that increases the dead material in the detector and worsens the energy resolution and this should be avoided in the final construction of the electromagnetic calorimeter.
Firstly, the crystals were wrapped in eight layers of Teflon sheet (total thickness approximately 0.1mm) as a diffuse reflector. Secondly, they were covered by an Aluminum foil (0.15mm), which in addition to its reflectivity provides an almost light tight coverage of the crystal.
The photo multipliers (Philips XP1911) were for electrical insulation covered with a thin Kapton foil and a -metal shield against low magnetic fields. Additional wrapping with black tape minimizes leakage of direct light from outside.
Before attaching the PMT to the crystal, the side of the crystal that would later be in contact with the PMT was cleaned using methanol. The optical coupling was performed with Baysilone silicon oil of high viscosity. The complete detector was assembled by a black plastic shrinking tube, which provides sufficient mechanical stability as well as makes the detector light tight.
5.2 Experimental Set-Up
5.2.1 Crystal Set-Up
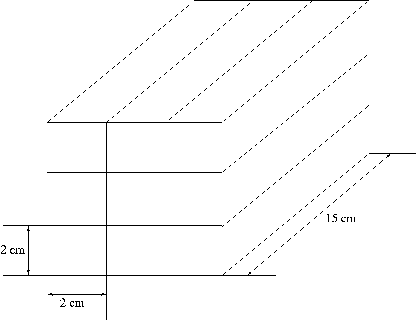
In total 18 crystals were arranged in two sets of 3x3 crystals, as shown in figure 5.1.
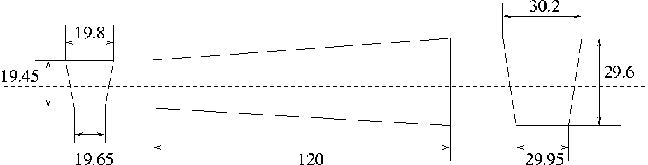
One of the arrays consisted of older crystals grown by SIC, China. They were tapered and had the dimensions shown in figure 5.2.
In the second array, consisting of Russian as well as Chinese crystals, the five samples of -II from Bogoroditsk were arranged like a cross and the four SIC crystals were put in the corners.
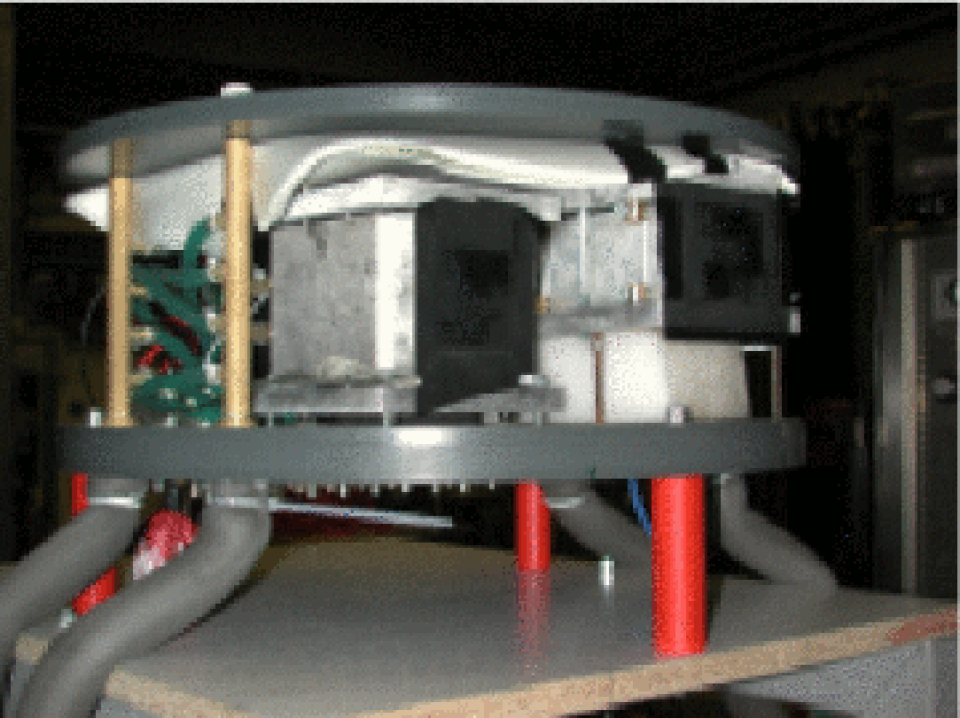
A block of metal surrounded the two sets of crystals. Through this block, cooling liquid circulated to enable measurements at low temperatures (-24 deg C) and to keep the crystals at a constant temperature with a variation 0.1 degrees. The cooling of the crystals is very important since the light yield is temperature dependent. In fact, the light yield for crystals improves by approximately 2-3% for each lowered degree [22]. Five different Platinum-resistive thermo sensors were integrated into the set-up to control the cool-down phase, the reached final temperature and the stability.
The crystals were mounted on a table that could be moved by remote control both horizontally and vertically to direct the beam into any of the crystals elements. At the time of the measurements, the crystals were surrounded by nitrogen gas to prevent formation of ice on the electronic equipment.
5.3 The Muon Test
In Giessen, the equipment and crystals were checked for failures to ensure that everything would work during the beam time in Mainz. Beside the use of low energy gamma sources, a simple way to check the equipment is to try and detect cosmic muons. The muons are minimum ionizing particles which means that they travel through mediums with a minimum and constant loss of ionizing energy, approximately 13 MeV/cm for [20]. Due to the constant energy deposition, these particles are advantageous to use even for absolute energy calibration of an electromagnetic calorimeter at lower or medium energies.[21].
Muons are very fast traveling particles, produced in air showers in the atmosphere and have a large range into the Earth. They will sometimes cross one, or maybe several of the uppermost detector crystals (top layer) and then continue through one or several of the bottommost (bottom layer) depending on the direction of the trajectory.
By connecting logic signals which indicate a muon transition, from the top and the bottom layer crystals in an logic AND-circuit, one can select such events for the trigger. The measurement is performed by creating such a trigger and recording events as list mode data. The layout of the electronics scheme, based on commercially available NIM- and CAMAC-electronics, as well as the trigger generation are shown in figure 5.4. A valid coincidence trigger enables the start of the energy and time measurement relative to the trigger reference, and offline true coincidences are selected among the crystals.
The used Data Acquisition System DAX was developed based on the TAPS (Two Arms Photon Spectrometer) read-out system. In parallel it stores the data of all detectors event-wise on disk and generates the relevant spectra of the ADC as well as TDC information.
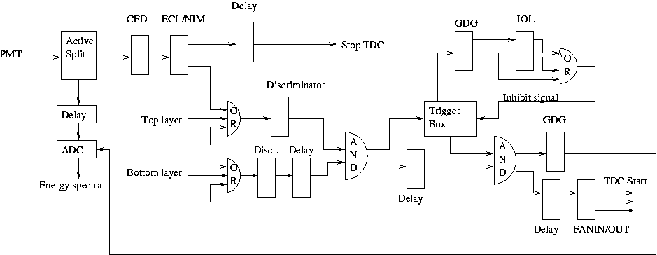
The PMTs (Philips XP1911) attached to the crystals, were supplied with high voltage -1500V. The anode signals were connected to an Active Split, which distributes the incoming signal into two or more identical ones. In this case two outputs were used.
One output without any applied shaping is passively delayed by coaxial cables for 500ns before being fed into the charge sensitive CAMAC Analog to Digital Converter, ADC (LeCroy 2249W).
The other signal from the Active Split continues to a Constant Fraction Discriminator (CFD) to generate a timing reference. A CFD gives an output if the input signal is above a certain level, the time of this output is independent of the amplitude for a given rise time of the input signal. To adapt the output to the NIM based electronics the delivered ECL signal has to be converted in an ECL/NIM converter. One of the two outputs is delayed in an active module for 390ns to serve as a stop signal in the Time to Digital Converter (TDC), to make sure that it comes after the start signal, which is the event trigger. The other signal acts as an input signal to a logic OR, together with the two other signals from the top layer crystals.
The following discriminator is used to adjust the logic output of the OR to an appropriate width. The lower row of crystals in the array was handled in a similar way to generate an OR information as well. A short additional logic delay is used to make sure that always the bottom row triggers and determines the time in case of a coincidence of both rows in the AND module.
The AND has two outputs. One of these outputs is actively delayed and connected to a second AND. The second output is sent through a trigger box, which selects acceptable events gated by an inhibit signal generated in the crate controller. It considers the conversion time in the ADC, the dead-time due to data transfer or the general busy status. The accepted event is transfered to the crate controller via the IOL-box (Input Output Latch-box), which is located in the CAMAC crate. In order to correlate the accepted event trigger with the original AND a second overlap is required in the circuit finally.
This second AND has two outputs. One of them enters a Gate and Delay Generator (GDG), which provides the appropriate delay and width of a NIM signal to gate the charge sensitive ADC correlated with the corresponding analog signal. The second output is connected to an active delay and then to a FANIN/FANOUT unit. The identical outputs provide the start signal to the TDC.
The test at the laboratory has been used to verify that all detectors and electronic channels have been properly functioning. In addition, it has been possible to adjust roughly the photo multiplier bias based on the recorded dynamic range of the energy spectra. The most probable energy deposition of the cosmic muons amounts to approximately 25-30 MeV.
Chapter 6 Measurements at MAMI in Mainz
6.1 Mainz Microtron
The energy resolution measurements were conducted at MAMI (MAinz MIcrotron) in Mainz, Germany. It is an 855 MeV electron beam facility that is being used to study nuclear and hadronic systems from an electromagnetic point of view. The facility is being upgraded at the moment and will deliver electrons up to an energy of 1.5 GeV by the end of 2005. The quality of the beam is outstanding with respect to the emittance, reliability and stability.[17]
In the experiments conducted at MAMI, the same crystal set-up as in Giessen was used. The difference was a fast plastic scintillator paddle, sized and 10mm thick, that was mounted in front of the crystal arrays. It was used to identify charged electrons or positrons that may have been created upstream by pair production of bremsstrahlung photons in the air. The signals from the paddle were directly used in anti-coincidence mode with the trigger signal of the crystal array to make sure that only events due to photons were recorded. The plastic scintillator has due to its low Z-material a very low probability for interaction with high energy photons corresponding to 0.1% . The electronic read-out equipment was very similar to the overall scheme for the test with cosmic muons. Only the generation and selection of the event has been modified.
Each tagger channel delivered a logic timing signal. The selected eight channels corresponding to photon energies distributed over the full energy range up to approximately 800 MeV were fed into an OR unit after refreshing the signal in a discriminator unit. The event condition requires a coincidence between the tagger-OR and the trigger signal of the crystal module to be tested. The timing of the coincidence was adjusted in such a way that the crystal determines the time and therefore guarantees the time relation for energy and time measurement. The beam intensity was reduced to a value to keep the count rate in the investigated crystal well below 20 kHz to minimize pile-up as well as not to limit the resolution in the AC-coupled charge sensitive ADC.
The program of the measurement covered the relative calibration as well as the final response measurement of both arrays. The calibration was performed by shooting the direct photon beam, which has a diameter of 5mm at the detector position, into each individual crystal to roughly adjust the dynamic range in the ADC. The adjustments were made with an appropriate photo multiplier voltage to store calibration data for the energy deposition of the selected eight photon energies in the exposed crystal. The remote controlled table allows for positioning of each crystal, with high precision, into the beam axis. After the calibration a long data run was taken with the beam hitting the central detector of each array to measure the shower distribution. All measurements have been performed at an operating temperature of -24 degrees C.
6.2 Experimental Set-Up
6.2.1 Tagging the Photon Energy
The photon beam used in the experiments is generated from an electron beam hitting a radiator. When hitting the radiator, bremsstrahlung occurs and the electrons emit photons. The electrons are deflected by a strong magnetic field of a dipole magnet; electrons with higher energy are bent less than electrons with a lower energy. Electrons of the same momentum (or the same energy) will cross the so called focal point of the magnet system irrespectively of the angle in which they scatter. There are different focal points for different values of the momentum and these points are located along a plane called the focal plane, in which a ladder of nearly 300 small scintillation detectors are located. By recording the responding tagger module in coincidence with the response of the bremsstrahlung photon observed in the test detector, one knows the exact photon energy. The typical uncertainty of 1-2 MeV is given by the momentum coverage of the individual tagger element in the focal plane.
In this experiment eight different energies of the tagged photons in the interval of 63 to 715 MeV were selected. The energies used were: 63.82 MeV, 105.60 MeV, 269.85 MeV, 313.14 MeV, 420.26 MeV, 520.78 MeV, 656.19 MeV and 714.53 MeV.
6.2.2 Energy Deposits in the Crystals
The nine crystals used are arranged in two arrays of crystals. When directing the photon beam towards a crystal, the photons initiate an electromagnetic shower that spreads over the neighboring modules.
The energy deposits in the surrounding crystals depend on the photon energy and can be reduced due to the dead material such as Teflon, tape and plastics between the crystals. The final goal therefore has therefore been to measure the energy depositions in the nine crystals simultaneously.
6.3 Analysis of the Experimental Data
In oder to deduce the line shape of the detector matrix, the energy deposit in each crystal due to the shower has to be summed-up event-wise. This means that for each event, one has to find the amount of energy deposited in crystal number 1, crystal number 2 and so on. To be able to do this, a relative calibration must first be performed to ensure that a certain channel number in one crystal corresponds to the same channel number in all other crystals.
To be able to completely analyze the data and obtain a result for the energy resolution, three different measurements had to be done: the pedestal determination, the calibration procedure and the final response measurement. The pedestal is the channel number in the digitized energy spectra, which corresponds to a photon energy equal to zero. This information is needed for the relative as well as absolute calibration. The pedestal measurements, unlike the other measurements, requires no beam.
6.3.1 Pedestal Measurement
The pedestal marks the zero point energy for each digitized spectrum of the crystal response. Using a charge sensitive ADC, the pedestal corresponds to the integral over the noise along the adjusted gate width. The experimental gate width was adjusted to 600ns in spite of the fast response delivering at least 95% of the scintillation light within 100ns. However, since the data acquisition system had to be located outside the experimental area, 30m of coaxial cables had to be used to transfer the analog signals. In addition, the adjustment of the coincidence with the tagger channels as well as all the additional logic decision required a passive delay of 500ns, achieved with coaxial cables as well. As a consequence, the long cables caused a strong damping of the signal amplitude and a significant increase of the effective signal width.
The pedestals are different for each detector channel. These pedestal events have been generated by triggering the data acquisition with uncorrelated pulser signals leading to a random integration over the noise. To get the position of this pedestal, a histogram of the energy data was created. Since the histogram shows a narrow, symmetric pedestal peak the mean value can be taken as the position of the pedestal. Alternatively, a Gaussian curve could have been fitted to each peak to determine the position.
6.3.2 The Response Measurement
During the response measurement the photon beam was directed into the central crystal of both arrays, recording the data from the eight neighboring crystals as well simultaneously. The energy information, the time information and the tagger information were recorded and stored event-wise. The time information delivers the relative time of response of the neighboring crystals to separate off-line random coincidences.
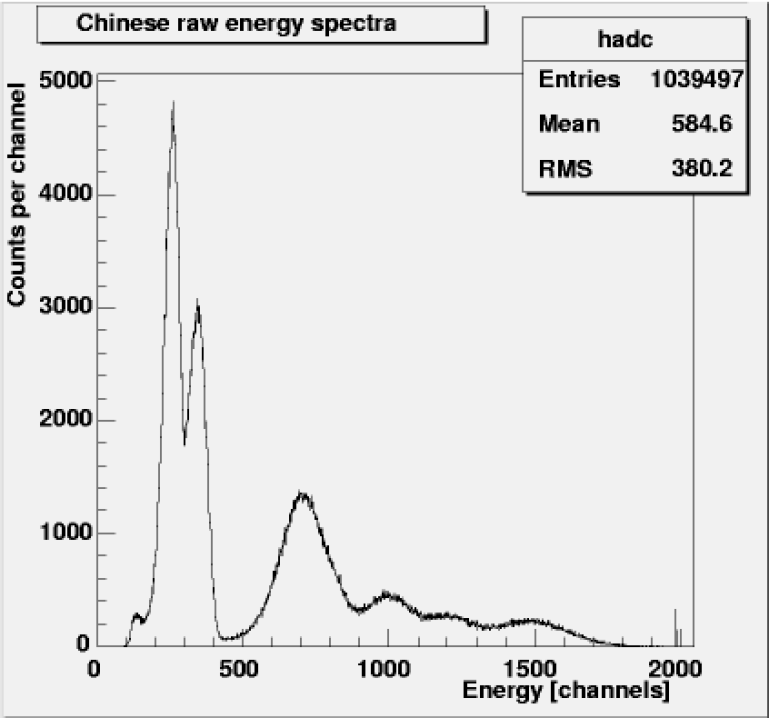
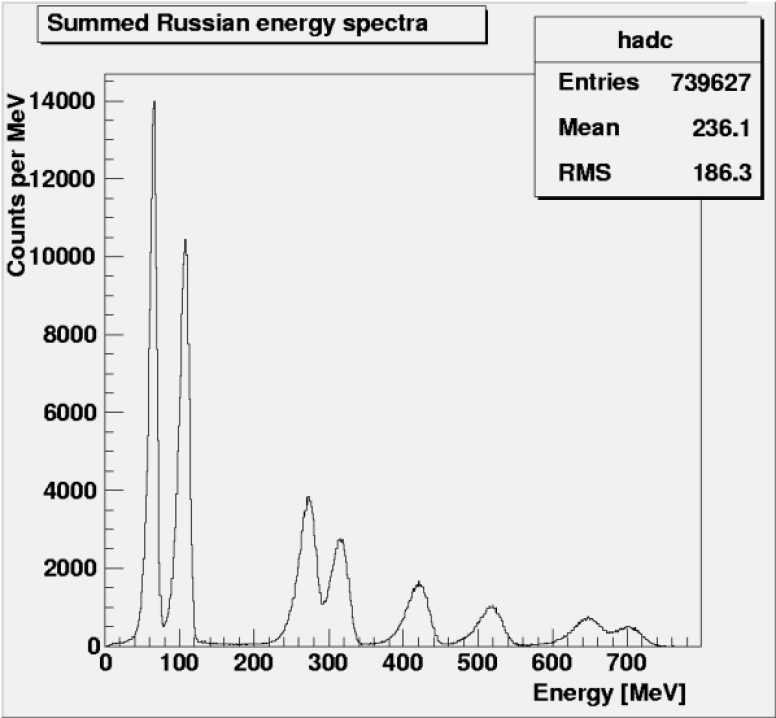
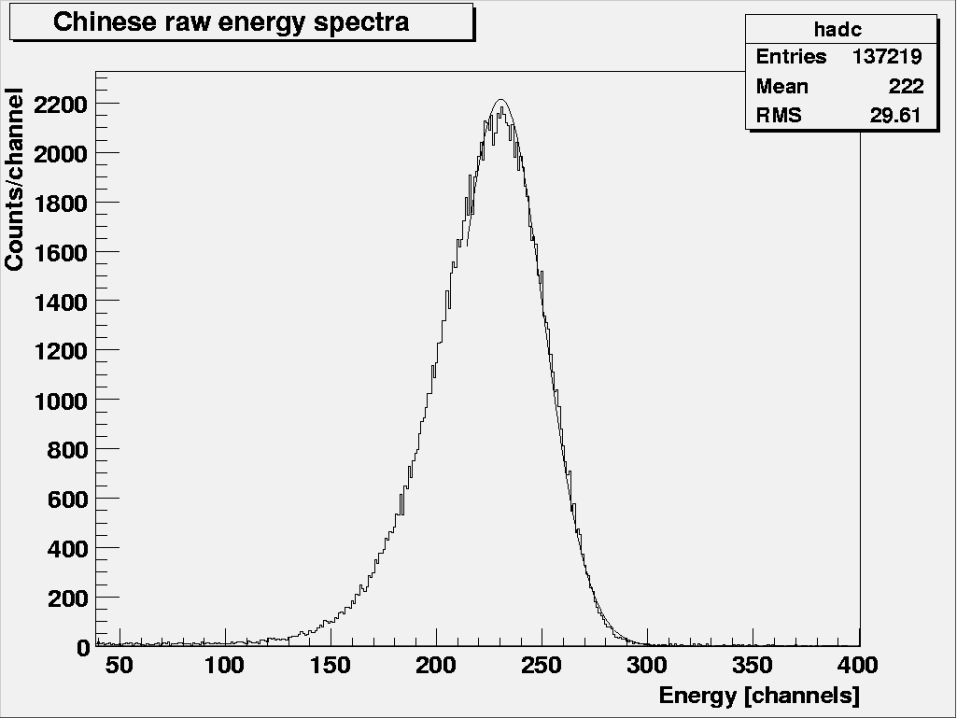
The total energy spectrum of the center crystal shows eight energy peaks since the beam is directed into that crystal; one peak for each tagger used in the measurement. The eight other spectra show only low energy deposit according to the fraction of the showers reaching these crystals. In 6.1(a) and 6.1(b) the eight tagger peaks are shown for the center crystal. These spectra will in the future be referred to as the raw energy spectra.

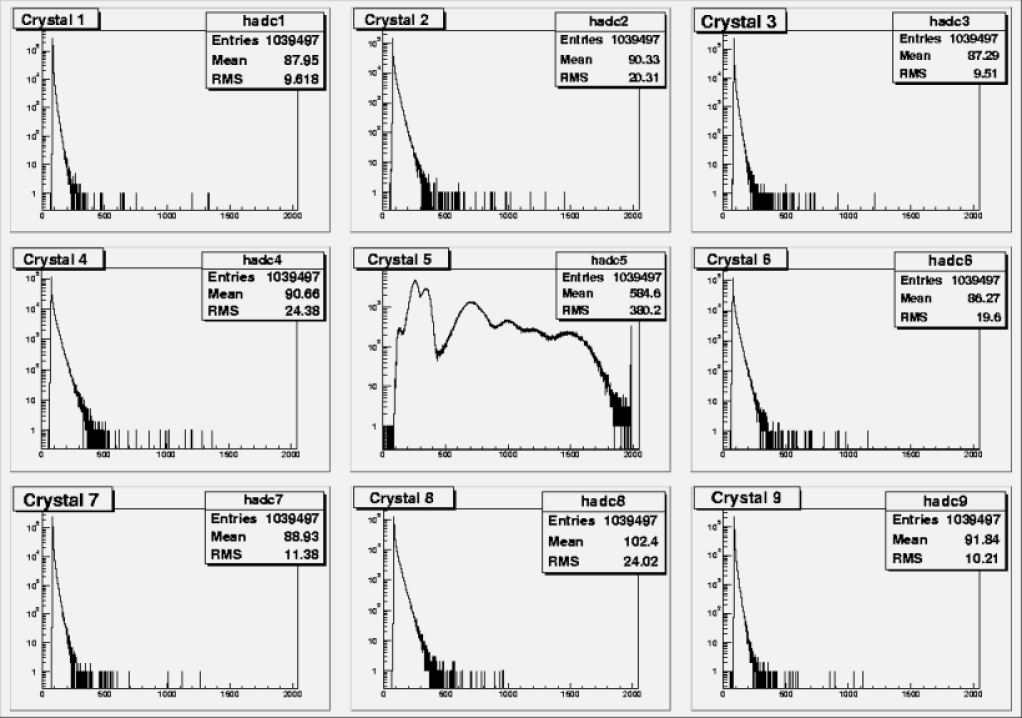
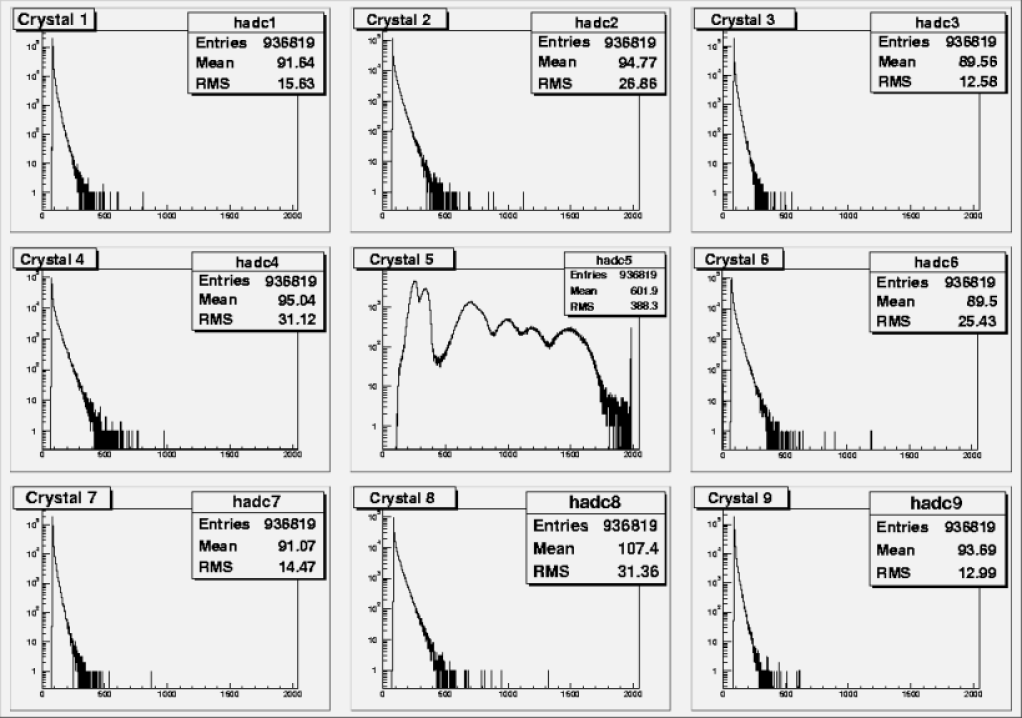
The spectra 6.2(a) and 6.2(b) illustrate the shower deposition into the crystal arrays. Again, all eight selected photon energies are superimposed.
6.3.3 Relative Calibration
The aim of the relative calibration is to put all peak positions for all crystals at the same channel number, without knowing the absolute energy. For this purpose, the absolute calibration must be performed based on known reference values.
If all possible tagger channels would have been picked in the experiment, a continuum would have been seen. Since only eight tagger channels were selected, eight structures are seen in the energy spectra. The locations of all eight peaks have to be determined in the calibration process. Since the peaks overlap in the total energy spectrum, they must first be separated. The separation is performed using a method referred to as “separation of peaks”. In this method, the eight peaks in the energy spectrum are separated and instead of having one spectrum with eight peaks, one will have eight different spectra with eight different peaks. The separation of the peaks can be done for each tagger energy separately by requiring a coincidence with one particular tagger channel. This information has been stored as well in the list mode data event-wise by using each tagger information as a stop signal in the eight time measurements using the accepted event as a start. The peak positions in these eight individual energy spectra are determined by fitting Gaussian functions.
The relative calibration method does not rely on the knowledge of how much of the photon energy is deposited in the crystal or into its neighbor, since all nine elements should show an identical response if the photon beam is directed towards it center. The center crystal acts as a reference since the total shower will later on be added to its response. By comparing the eight different peak locations, with pedestals subtracted, to the corresponding ones in the center crystal, eight calibration factors can be deduced which should be identical within statistical errors. The mean value is finally used as normalization factor for the relative adjustment.
6.3.4 Adding Energy Deposits Event-Wise
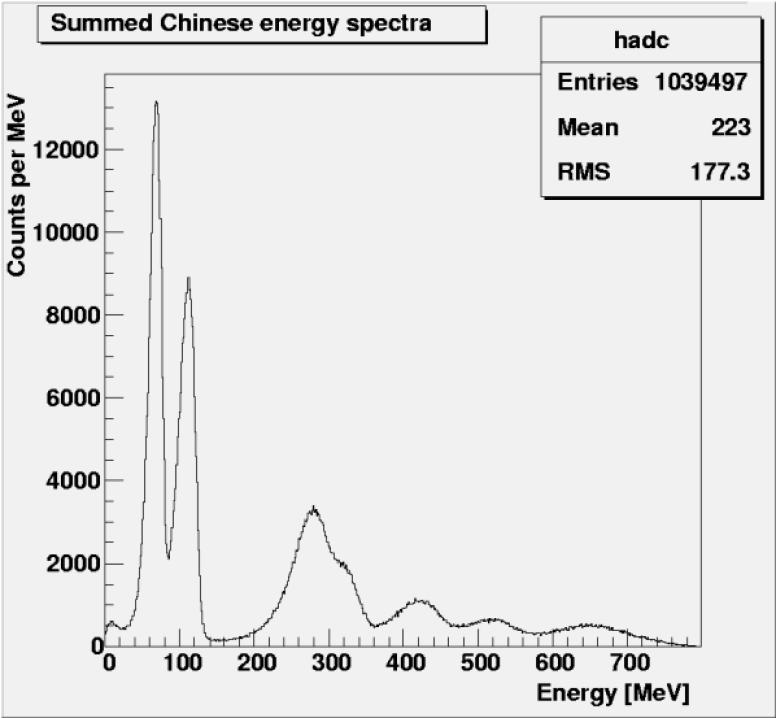
The raw energy spectra taken from the 18 crystals show broad peaks which partly overlap each other. By adding the energy contributions from the eight surrounding crystals event-wise to the spectrum of the center crystal, a more complete picture of the event is obtained. The summed spectra have a much better energy resolution due to the added energy and the processes in the crystals are described more properly than before.
The obvious difference between the raw spectrum and the summed spectrum is, as expected, that the peaks are narrower since the photon statistics has increased. Decreasing this uncertainty also decreases the width of the peaks. Summing up the energy deposits causes the counts in the tail of the peak to shift from lower energies to higher energies. This further reduces the width of the peak.
The second observation is that the peaks have been slightly shifted to higher energies. This effect comes directly from the adding of energy. A peak corresponding to a high energy will of course be shifted to the right in the energy spectrum. These higher energies come much closer to the actual photon energy, but since the set-up is not perfect and energy is lost in the material between the crystals, the incoming photon energies are still higher.
The third observation when comparing the raw and summed energy spectra is that the peaks are separated to a greater extent after the summation compared to before the summation. Even if the peaks are not completely separated this is not really a problem in calculating the energy resolution due to the available tagger information. In the Russian energy spectrum of a single crystal one could distinguish six peaks and after summing the spectra all eight peaks were visible. For the Chinese crystals only seven peaks were seen after the summation and this is an improvement compared to the raw spectrum where only three peaks and a continuum were seen. The Russian crystals obviously have a much better energy resolution since the peaks are narrower and since all eight peaks are visible. That this is not the case for the Chinese crystals is probably due mainly to three things; the light yield of the crystals, their short length and their tapered shape. The light yield of the Chinese crystals is only about 10 photoelectrons per MeV compared to about 20 for the Russian crystals. The shorter length of the crystal will cause an increased energy leakage and therefore a larger contribution to the resolution due to the statistical fluctuations of the shower. In addition, the strongly tapered shape will on one hand favor light collection at the larger endface. However, the shape can impose a non-linear light collection along the symmetry axis which contributes significantly to the constant term in the energy resolution. Of course, since all crystals were individually wrapped in several layers of Teflon, aluminum foil and shrinking tape, there is a substantial amount (about 0.4-0.5 mm for each crystal) of dead material between the crystals which worsens the energy resolution.
Looking closer on the peaks, one can see that they are not as symmetric and Gaussian-shaped as would be expected. This effect is due to the wrapping material and also to the fact that the showers may spread out of the crystals and into the metal block or the surrounding environment (nitrogen in this case). These two factors, or loss mechanisms, influence the amount of detected energy; more losses means less detected energy. The energy losses cause high energetic photons to be interpreted as low energetic photons by the crystals. The result is a shift of the peaks to lower energies and a tail on the left, low-energetic side of the peaks, is formed.
In neither of the two summed spectra, the peaks were completely resolved and to clearly see the low energy tail, the peaks had to be separated. A total separation is a very important feature when treating the peaks. One must therefore first go through the separation procedure using coincidence with the taggers before the peaks can be analyzed and fitted with appropriate distributions.
6.3.5 Calibration According to Incoming Energy
After having performed the relative calibration all peak positions for all crystals are identical. The peak positions in energy are not known, though. To perform an absolute calibrations, simulations would be needed since one does not know how much energy is lost in the wrapping material or is leaking out of the detector. In the present case one can simply calculate a conversion factor from channels to the true incident energy, which however does not take into account the true energy deposition. The calibration factor is obtained by the ratio of the incoming energy in MeV and the detected channel number for this peak, see equation 6.1. This has been done for the experiments in Mainz.
However, one should consider that the ratio between incident and deposited energy does not have to be constant since the shower leakage to the rear will increase with increasing photon energy. Nevertheless, this does not seem to be a large effect since one sees in 6.4(a) and 6.4(b) that it does not cause a large deviation from linearity.
| (6.1) |
f is the so-called conversion factor that the counts in the spectrum will be multiplied with in order for them to be expressed in MeV rather than in channels. is the incoming photon energy (in MeV) corresponding to a specific peak, and is the detected peak position in channels. The detected peak position is strongly dependent on what fit one chooses to use in order to obtain the peak positron and on which interval one applies the fit on. However, this conversion factor will not affect the obtained relative energy resolution , since it is not dependent on what unit they are expressed in as long as they are expressed in the same unit.
Conversion factors are calculated for each peak in the summed spectra. Finally the average value of these conversion factors are used to change the scale from channels to MeV.
| Property | Chinese | Russian |
|---|---|---|
| Conversion factor | ||
| from channels to | 0.4007 | 0.3949 |
| energy [MeV/ch] |
This factor can be regarded as a preliminary conversion factor from channels to MeV. It neglects energy losses but can be still considered as a good relative measure. To perform an absolute calibration, one would need computer simulations to see how much energy is lost in the system. The losses would typically result in yet another constant factor by which the counts in the energy spectra were to be multiplied with.
An important test that has to be done in connection to the relative calibration is to investigate weather the energy response follows a linear dependence with respect to the channel numbers. It is a general test of the whole detector - linear response of the scintillation process, the light collection as well as the photo multiplier response - in addition also a check of the calibration procedure, the errors in the method and the deduced conversion factors. By plotting the incident photon energy versus the detected energy in arbitrary channels, one should obtain a straight line, and its slope ought to be identical to the conversion factors calculated above.
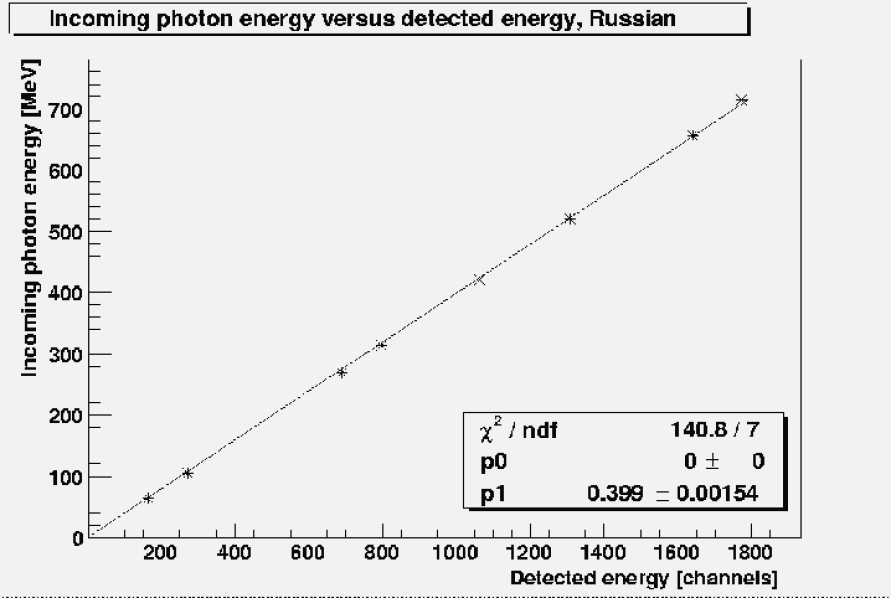

The deviations from linearity in the graphs 6.4(a) and 6.4(b) are less than 5 MeV for the peak position at 700 MeV (0.71%) for the Russian crystals and less than 10 MeV for the peak position at 272 MeV (3.68%) for the Chinese ones. These deviations are as well seen in table 6.2.
| Crystal | Deviation from | Deviation from |
|---|---|---|
| linearity [MeV] | linearity [%] | |
| Chinese | 10 | 3.68 |
| Russian | 5 | 0.71 |
As shown in 6.3, the slopes of the graphs do not coincide with the calculated conversion factors. This is due to the fact that when calculating the average conversion factors, all calculated factors are given equal weight. This is not the case when performing the straight line fit. Here, the data point representing the highest energy restricts the possible values of the conversion factor more than the other data points (and especially the data point representing the lowest energy). Hence in this case, the data points have been given the same weight factors and data points far from the origin influence the conversion factor stronger.
| Chinese crystals | Russian crystals | |
|---|---|---|
| Calculated factor | 0.4007 | 0.3949 |
| Slope of graph | 0.4134 | 0.3990 |
| Difference | 0.0127 | 0.0041 |
| Difference in % of | 3.2 | 1.0 |
| the calculated factor |
6.4 Resolution Dependence on Photon Energy
The energy resolution depends on the energy of the incoming photons. The dependence is depicted by plotting the sigma of the peaks divided by the incident energy, versus the incoming photon energy given in GeV. The energy dependence can be parametrized by equation 6.2.
| (6.2) |
6.4.1 Different Methods of Fitting the Peaks
When calculating the energy resolution, different methods can be used to obtain the . These methods differ in how to fit the energy peaks, or at least in how to obtain the peak position, the width of the peak and as well other characteristic properties.
The obvious choice in obtaining a measure of the width of the peaks, the -value, is to take the FWHM (Full width Half Maximum) of them. The FWHM is used whenever one is dealing with non-Gaussian shaped peaks. Although the peaks in the Russian and Chinese energy spectra look Gaussian, the low energy tail destroys the symmetry. The disadvantage with this method is that the FWHM value will be unnecessarily large and that it will not describe the width properly. This is easily understood if one thinks of the low energy tail as created due to energy losses. These losses will increase the peak width and worsen the energy resolution so that the energy resolution looks worse than it actually is. The FWHM value is obtained by registering the height of the separated peaks in the spectra and writing down the width of the peaks at half of this maximum.
Another method has therefore been used to determine the energy resolution of the crystals. This method is based on the assumption that the separated asymmetric energy peak contains two sets of samples that can be described by two different Gaussian functions. One of these functions represents events where no energy escapes from the array of crystals; this curve is called the signal peak. The second curve makes up for the difference between the signal peak and the real asymmetric peak in the energy spectrum. The second peak physically represents the events where part of the energy is lost; that is the energy that stays in the material between the crystals or leaks out of the system in other ways. By adding these two Gaussians an asymmetric function, looking much like the original energy peak, is obtained.
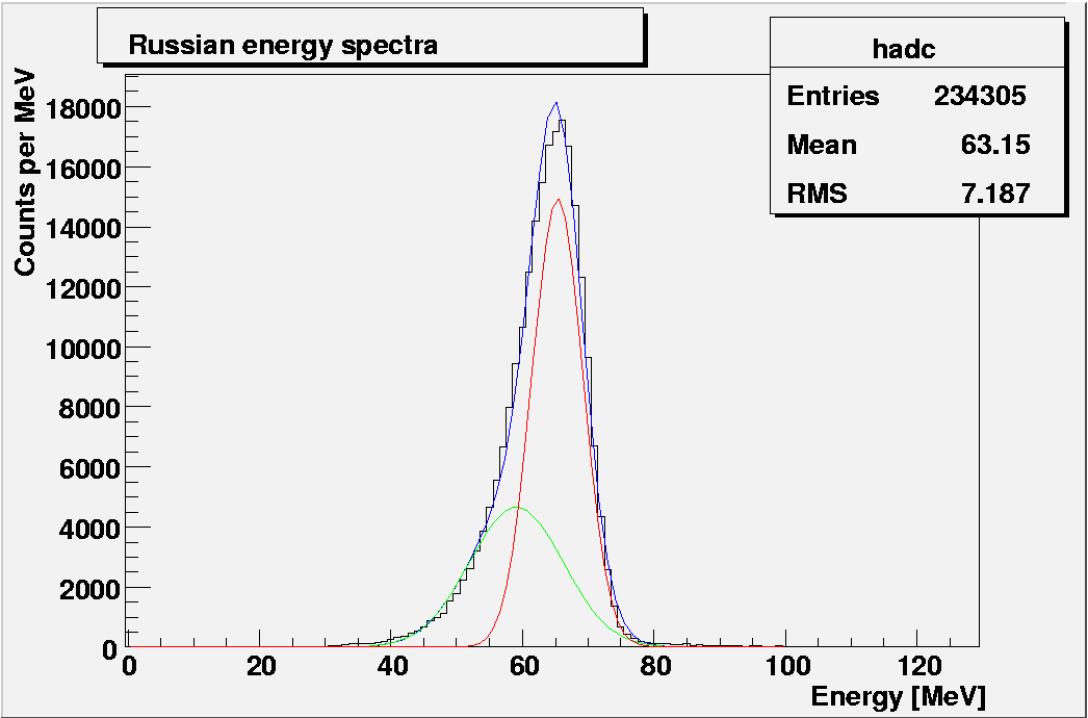
The method with the two Gaussian functions is applied to both the raw and summed energy spectra. The difference between the sigma values in the two cases affects the energy resolution. By adding the energy contributions, the peaks get narrower, the sigma decreases and the energy resolution improves.
To compare the two widths of the peaks (the FWHM and the ) one can divide the FWHM with 2.35. A corresponding -value will then be obtained. The comparison shows that the sigma value calculated from the FWHM value in most of the cases is much larger than the sigma value obtained from the signal peak. This is expected, since the asymmetric peak obviously is much wider than the signal peak.
6.4.2 Right Side Fit
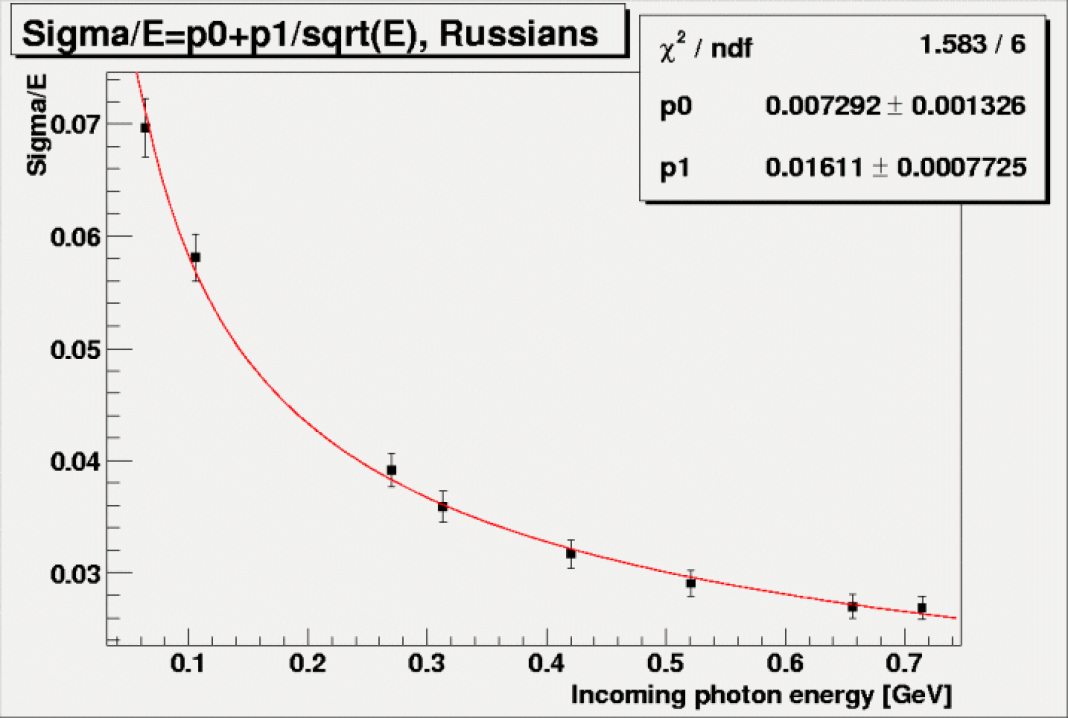
Because of the unreliability (or unlikeliness) in the energy resolutions obtained from the FWHM and the signal peak, it is important to fit the energy peaks with a more appropriate function. One could simply pretend that they have the shape of a Gaussian distribution and ignore the low energy tail. According to this method, all Gaussian fits are carried out over an interval that ranges from the upper left part of the peak to the end of the peak on the right side as shown in 6.6.
This fitting procedure may initially seem strange and not very reliable. It is however based on the assumption that some of the energy is lost in the material between the crystals. This shifts some of the counts in the energy spectra to lower energies and creates a tail on the left side of the peak. If no energy would be lost, one could expect this tail to disappear but the right side of the fit would still look the same.
Repeating the fitting procedure shown in figure 6.6 for each and every one of the separated summed energy peaks yields yet another measure of the peak width. Plotting the against the energy in GeV gives an energy resolution somewhere in between the two extremes discussed in section 6.4.1.
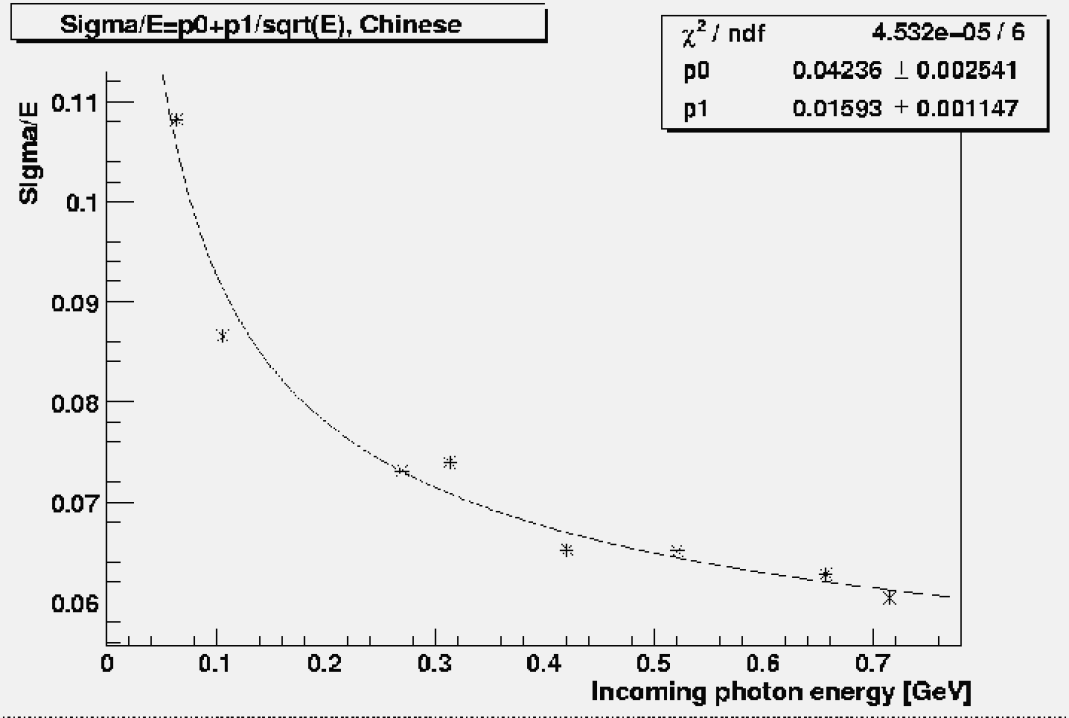

Using this method, the values of and for the Russian crystals come even closer to the desired values given in the proposal for the ECAL, , see table 6.4 for comparison. The values of the coefficients were determined by the fit to be 4.24% and 1.59% for the Chinese crystals and 0.76% and 1.59% for the Russian crystals.
| Crystal | in % | in % |
|---|---|---|
| Chinese | 4.24 0.25 | 1.59 0.11 |
| Russian | 0.76 0.08 | 1.59 0.04 |
6.5 Resulting Energy Resolution
6.5.1 Comparing the Three Methods
In order to see which of the three methods gives the lowest energy resolution (lowest values of and ), one must compare the results from the calculations. This comparison is seen in 6.8(a) and 6.8(b). Here, one can see that the energy resolution obtained when using the sigma from the signal peak gives the lowest resolution. This case may be an indication of which resolution may be achieved if performing very good measurements with a sufficient amount of crystals absorbing the energies from the incoming photons and with a minimum of dead material between the crystals.
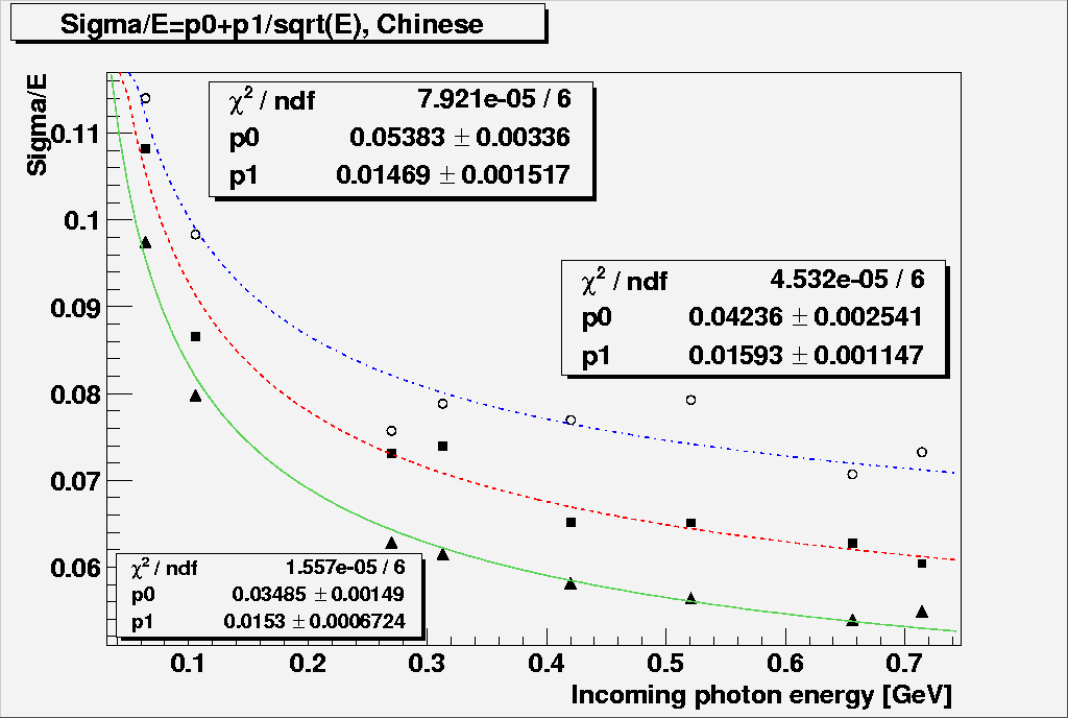
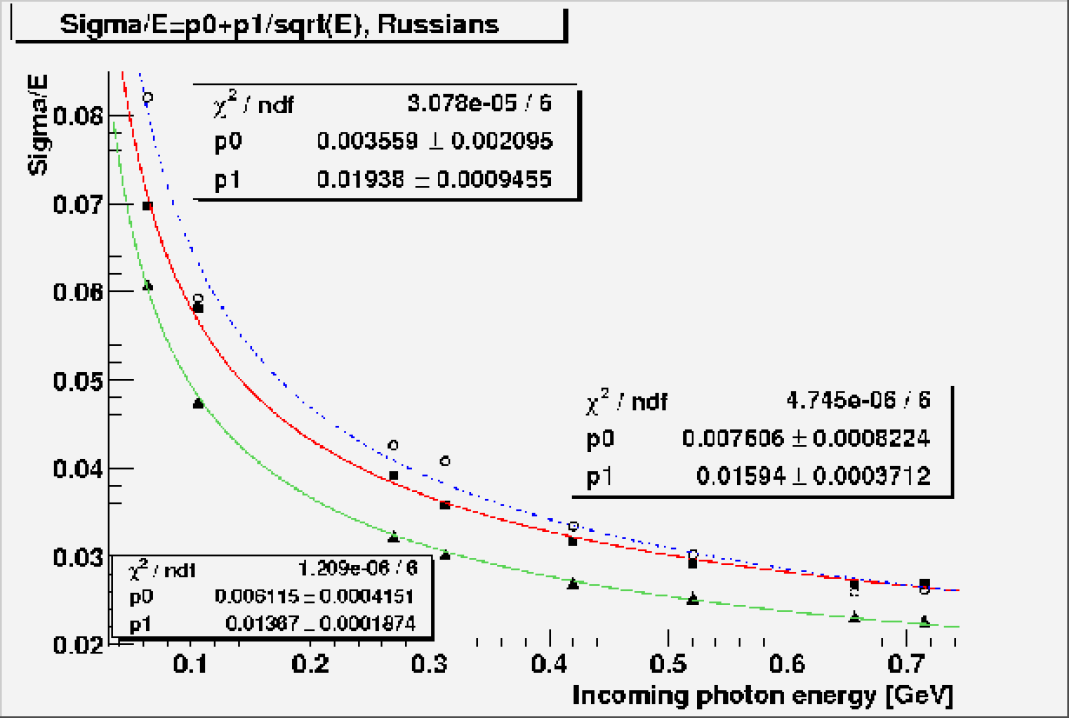
The FWHM and the signal peak can be seen as two extreme scenarios that are not very likely to occur, although they may happen. The right side fit seems to give the best description of the energy resolution since the result is somewhere between the other two.
6.5.2 Final Energy Resolution
In order to give an estimation of the systematic uncertainty in the results obtained with the right side fit, half of the deviation in energy resolution between this method and the other two is taken as . For the Chinese crystals, the systematic shift of the three curves in 6.8(a) indicate that the should be almost constant. For the Russian crystals, the is larger for lower energies than for higher since the FWHM and the right side fit gave almost the same asymptotic energy resolution.
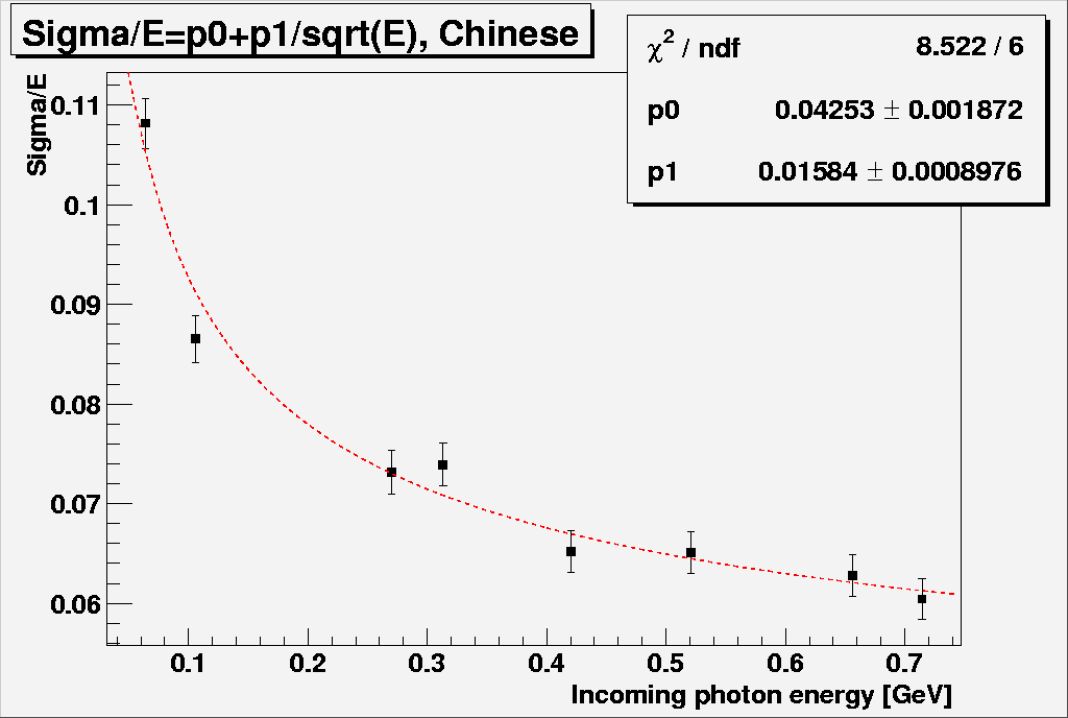
| Final energy resolution | ||
|---|---|---|
| Chinese crystals | 4.25 0.19 | 1.58 0.09 |
| Russian crystals | 0.73 0.13 | 1.61 0.08 |
| CDR Report | 0.3 | 1.54 |
The error bars for the Chinese crystals in 6.9 range
from 0.21% for low energies to 0.25% for high
energies. The error bars for the Russian crystals in
6.10 range from 0.10% for low energies to
0.26% for high energies.
| Final energy resolution | Minimum error bar | Maximum error bar |
|---|---|---|
| Chinese crystals | 0.25 % | 0.21 % |
| Russian crystals crystals | 0.26 % | 0.10 % |
6.6 Dependence of the Energy Resolution on the Array Size
One as well may want to know how much better it is to use a large array of crystals compared to using only a small one. This effect can (in some way) be seen by comparing the energy resolutions obtained from the raw and summed energy spectra. These energy resolutions differ a lot. The two curves describing the resolution can be seen in 6.11 and 6.12. In both figures, the energy resolution is obtained from the signal peak.
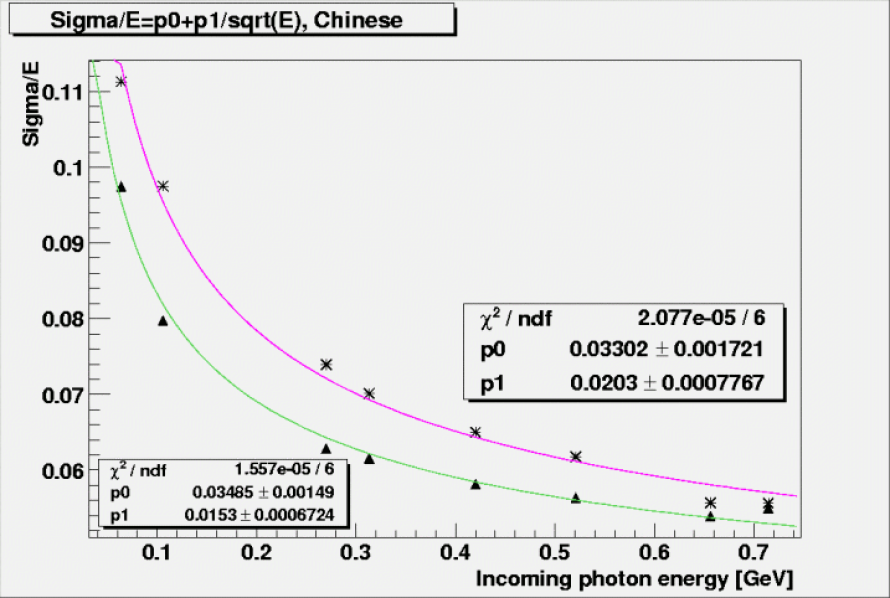
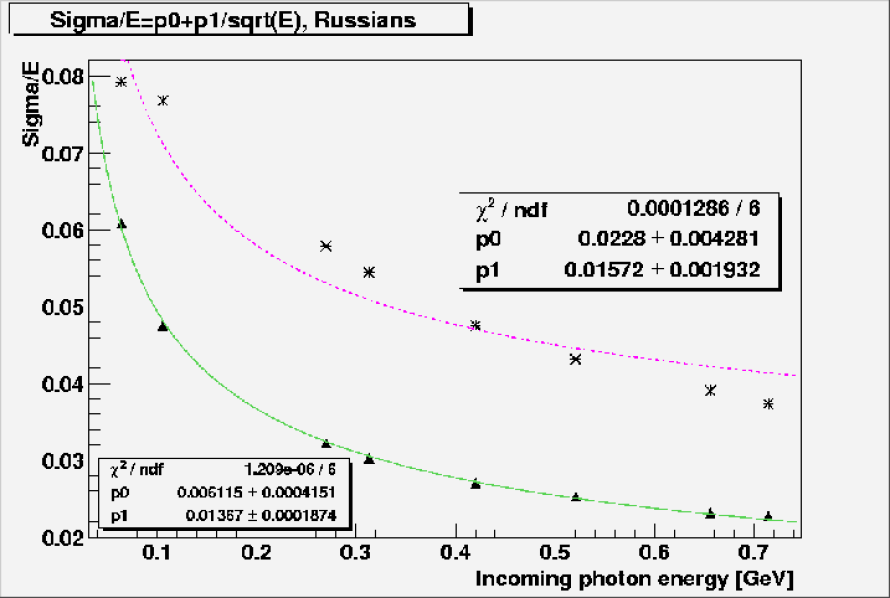
Not summing over the energy contributions in the surrounding crystals obviously gives a worse energy resolution since and have clearly lower values. This is shown in the graphs.
6.7 Conclusions from the Experiment at MAMI
Using three different methods of estimating the energy resolution of the lead tungstate crystals gave three quite different results. The largest energy resolution was obtained using the FWHM value of the peaks. This was expected since only parts of the peaks were used to estimate the energy resolution in the two other cases. The lowest energy resolution was obtained when using the sigma of the signal peak. The assumption to use only the right side of the energy peak to fit of a Gaussian distribution led to an energy resolution between the two other extreme values.
The energy resolution obtained from the FWHM can be seen as a worst case scenario for the energy resolution since the tail of the peak influences and increases the FWHM value and hence worsens the resolution. The signal peak on the other hand, can be seen as the ideal case where no energy is lost and the energy resolution indicates what may be achieved with a perfect set-up and instrumentation of a high quality.
The energy resolutions obtained for the Russian crystals, taking into account the systematic uncertainties, came close to what was proposed in the Conceptual Design Report report about the crystals to be used at GSI (). The Chinese crystals, seem to have a worse energy resolution () dominated by the constant term.
Due to the difference in geometry, a direct comparison is not possible. The statistical factors are very similar both for the Chinese and Russian crystals, which indicates similar luminescence properties. However, the coefficient before the -term is approximately the same as for the Russian crystals, especially if one considers the uncertainty in this value. The term represents light output of the crystals and photon statistics and it should be smaller for the Russian crystals due to the higher light yield. The term describes the performed calibration, the set-up properties and time dependent parameters such as temperature or count rate changes or the various effects due to light collection or shower leakage. Due to the tapered shape of the Chinese crystals, a larger part of the shower escapes and thus the leakage is larger and the value of this term increases.
Although the result came close to the desired energy resolution stated in the CDR, the energy resolution of the crystals was not as good as expected. Previous measurements of crystals, conducted in 1997 in Giessen, Germany [23], resulted in an energy resolution of . This value was obtained for a array of crystals, but without any cooling of the crystals. Improvements have been done since then, both in the light yield of the crystals and in cooling techniques. The light yield has improved by a factor of two and the cooling has improved the light yield with a factor of three. That should result in an energy resolution that is a factor lower than for the previous measurement. This seems not to be the case and it is therefore very important to repeat the measurements. The crystals should then not be individually wrapped and one must ensure an excellent optical contact between the crystals and the read-out devices. Also a proper PMT set-up should be used in order to collect as many photons as possible. In addition one must verify, or optimize, the linear response of each detector by measuring the response to low energy gamma sources as a function of position along the axis of the crystal.
Chapter 7 Summary and Outlook
7.1 Summary
The objective of this thesis was to determine the energy resolution of two sets of recently developed crystals. The crystals will be used to detect gammas (and electrons) in an Electromagnetic Calorimeter at the future upgrade of the GSI facility.
The gammas used in the experiment ranged in energy between 64 MeV and 715 MeV. The crystals were irradiated by eight photon energies in this interval and the signals from the crystals were read out using PMTs.
The energy spectra obtained in the experiment showed eight peaks, one corresponding to each photon energy used. The peaks were all asymmetric with a tail to lower energies. Due to the asymmetry, the sigma of the peaks was obtained using three different methods. Firstly, the FWHM of the peak was used. Next, two different Gaussian distributions were fitted to the peak in order to describe the asymmetry. One of them represented events where no energy escapes the detector while the other one represented the energy lost in the wrapping material and as well the energy leaking out of the detector. At last, a Gaussian function was fitted to mainly the right side of the peak.
The sigma from the FWHM turned out to give the largest energy resolution while the sigma from the signal function gave the lowest. The right side fit resulted in an energy resolution somewhere in between the other two values.
The use of two sets of crystals with different shape and light yield resulted in two different sets of results of the energy resolution. Using crystals with a length of approximately 17 radiation lengths and a higher light yield gave a lower energy resolution. The energy resolution from the right side fit for the Russian crystals was estimated to be , this value comes very close to the value written in the Conceptual Design Report, . The Chinese crystals were found to have an energy resolution of .
Using the FWHM of the peaks gives a very bad resolution. Using the signal peak gives a very low and desirable resolution but it is somehow unclear how one could obtain such a narrow and symmetric energy peak. The right side fit seems to be most appropriate since the energy value obtained using that method is between the two extremes. The result in this case is significantly improved compared to measurement using crystals of minor quality. In spite of a smaller volume the achieved resolutions are very close to values obtained for a matrix with identical read-out but operated at higher temperatures. Nevertheless, the improvement of the light yield of a factor two compared to former crystals, which is valid for the Russian as well as the Chinese samples of 15 cm length, as well as the operation at -24 degrees Celsius should have led to an even better results. One should have expected an increase of the light yield by a factor , which should much further reduce the statistical factor in the parametrization of the relative energy resolution.
7.2 Outlook
The final energy resolution of the crystals was obtained using a method ignoring the low energy tail of the energy peaks. To really understand and explain the existence of this tail, simulations would be needed. It is clear that the dead material is partly responsible for it, but other explanations are needed as well. The simulations may also provide an opportunity to verify the use of more than one function to describe the shape of the energy peaks. Possibly, they could also support the decision to use the two Gaussian method and as well justify the assumption that the signal peak may be the ideal energy resolution to strive for. Another important reason for conducting simulations would be to investigate exactly what size of the crystal array is needed to collect all the showers in the detector.
Simulations in these areas were begun but due to lack of time, no proper results were obtained. The only conclusion one could draw from those simulations was that an array larger than the array used in the experiments was needed. This was especially important for photon energies of high energy, when deposits in the surrounding crystals were larger. The thickness of the wrapping layer was as well varied in the simulations to investigate whether this influenced the amount of energy deposits. No conclusions could be drawn in this case since the Z-value of the wrapping material was so much lower compared to that of the crystals. This means that the wrapping material is not capable of collecting very many photons and that they instead escape the detector. Hence this factor did not noticeably affect the depositions.
Since the energy resolution obtained in the experiment was good, but not as good as expected due to the improvements made since the last time the experiments were performed, new experiments are required. In the new experiments it is important to minimize the amount of dead material in the detector and if possible, exclude the individual wrapping of the crystals. It is also important to assure a good optical contact between the crystals and the read-out devices and to use a proper PMT set-up that is more stable than the one used in Mainz. This will most likely increase the amount of detected photons and improve the energy resolution of the crystals.
As the crystal manufacturing develops, crystals with a higher light yield than the one used in this experiment are expected in the near future. This will drastically impact the energy resolution.
It has, at a late stage of this thesis, come to my knowledge that the asymmetry of the peaks could be better described with the so-called Novosibirsk function, rather than with two Gaussian distributions. This function looks like a Gaussian distribution but has a low energy tail. Applying it to the fit of the energy peaks may very well yield a better description of the energy resolution and it would therefore be best to repeat the fitting with this function.
Acknowledgment
I would like to thank Rainer Novotny at the Justus Liebig University in Giessen for giving me the opportunity to participate in the experiments in Giessen and Mainz and for answering my never-ending questions with such patience. He has also been very helpful with giving me comments and feedback on my report.
I would also like to thank Inti Lehmann at Uppsala University for his good ideas all through this thesis and I would as well like to thank him for helping me structuring my report.
Also thanks to Henrik Pettersson, Uppsala University, for helping me overcome computer problems and increasing my knowledge of computer simulations.
Finally, thank you Ulrich for providing me the opportunities to conduct my master thesis in such an interesting way and for letting me present my results at the collaboration meeting at GSI. Your encouragement has been a true inspiration.
References
- [1] GSI Conceptual Design Report, An International Accelerator Facility for Beams of Ions and Antiprotons
- [2] B.R. Martin and G. Shaw, Particle Physics, John Wiley and Sons, West Sussex, England, 2003
-
[3]
http://hyperphysics.phy-astr.gsu.edu/hbase/forces/couple.html,
17-06-2004 - [4] Povh et al., Particles and Nuclei, Springer-Verlag, Berlin Heidelberg, Germany, 2002
- [5] W.S.C. Williams, Nuclear and Particle Physics, Oxford University Press Inc., New York, USA, 1991
- [6] F.E. Close and P.R. Page, Glueballs, Scientific American, pp. 52-57, November 1998
-
[7]
Homepage of the PANDA collaboration,
http://www.ep1.rub.de/ panda/auto/org/_home.htm, 14-06-2004 - [8] Homepage of GSI, http://www.gsi.de/, 16-06-2004
- [9] PANDA collaboration, Letter of Intent, Strong Interaction Studies with Antiprotons, Jan 21 2004
- [10] http://www.ep1.rub.de/ panda/html/det/fwd/fwd.htm, 13-05-2004
- [11] http://rkb.home.cern.ch/rkb/PH14pp/node115.html, 13-05-2004
- [12] http://www.canberra.com/pdf/Products/Detectors_pdf/clover.pdf, 13-05-2004
- [13] C. Nordling and J. Österman, Physics Handbook for Science and Engineering, Studentlitteratur, Lund, Sweden, 1999
- [14] M.J. Ryan, Crystals for the CMS Electromagnetic Calorimeter, First Year Report, Imperial College of Science, June 20 2001
- [15] Elin Lundborg, Computer Simulations for a Charmonium Hybrid Production in the PANDA Detector, Master Thesis, Uppsala University, 2003
- [16] http://www.fz-juelich.de/nic-series/volume20/laermann.pdf, 17-06-2004
- [17] http://nuclear.gla.ac.uk/ grant2003/devel/html/node4.html, 15-05-2004
- [18] W.R. Leo, Techniques for Nuclear and Particle Physics Experiments, Springer-Verlag, Berlin Heidelberg, 1994
- [19] http://www.hep.caltech.edu/ zhu/ryz_aps_030406.pdf, 14-06-2004
- [20] http://spider.chemphys.lu.se/ per/exjobb/node76.html, 15-04-2004
-
[21]
http://www.phyast.pitt.edu/ jth/safrica/capetown_aug2002/
e865/e865trip.html, 15-04-2004 - [22] Frida Hjelm, Scintillating Crystals for the PANDA Electromagnetic Calorimeter, Master Thesis, Uppsala University, To be published 2004
- [23] K.I. Mengel, Ansprechverhalten von Szintillationskristallen auf monokromatische Photonen im Bereich zwischen 50 und 790 Mev, Diploma Thesis, Justus Liebig University in Giessen, Germany, September 1997