Stellar and Circumstellar Properties of the Pre-Main Sequence Binary GV Tau from Infrared Spectroscopy11affiliation: Data presented herein were obtained at the W.M. Keck Observatory from telescope time allocated to the National Aeronautics and Space Administration through the agency’s scientific partnership with the California Institute of Technology and the University of California. The Observatory was made possible by the generous financial support of the W.M. Keck Foundation.
Abstract
We report spatially resolved spectroscopy of both components of the low-mass pre-main-sequence binary GV Tau. High resolution spectroscopy in the - and -bands is used to characterize the stellar properties of the binary and to explore the nature of the circumstellar environment. We find that the southern component, GV Tau S, is a radial velocity variable, possibly as a result of an unseen low-mass companion. The strong warm gaseous HCN absorption reported previously toward GV Tau S (Gibb et al., 2007) was not present during the epoch of our observations. Instead, we detect warm (500 K) molecular absorption with similar properties toward the northern infrared companion, GV Tau N. At the epoch of our observations, the absorbing gas toward GV Tau N was approximately at the radial velocity of the GV Tau molecular envelope, but it was redshifted with respect to the star by 13 . One interpretation of our results is that GV Tau N is also a binary and that most of the warm molecular absorption arises in a circumbinary disk viewed close to edge-on.
1 Introduction
GV Tau (catalog ) (Haro 6-10, Elias 7, HBC 389, IRAS 04263+2426) is an unusual young stellar object (YSO) in the Taurus molecular cloud. While the spectral energy distribution of the system has the strongly rising 2–25 continuum that is characteristic of Class I sources (e.g., Furlan et al., 2007), millimeter studies find comparatively weak dust and gas emission from the source compared to other low-mass embedded YSOs (Hogerheijde et al., 1998). This, and the poorly defined molecular outflow structure from the source, suggest that the system lacks a significant envelope component (Hogerheijde et al., 1998) and may be a more evolved Class I system.
GV Tau is also a binary (projected separation 12; Leinert & Haas, 1989). It is one of a small population of low-mass pre-main-sequence binaries in which one component is optically visible, while the other is optically faint and radiates primarily at infrared wavelengths. The optically visible component in the GV Tau system is the southern component (GV Tau S), a T Tauri star. Its stellar properties have been characterized previously based on high resolution infrared (Doppmann et al., 2005) and optical (White & Hillenbrand, 2004) spectroscopy. GV Tau S is unusual in that its radial velocity has been found to differ significantly (by more than 3-) from both the radial velocity of the surrounding molecular cloud (by ) and the radial velocity distribution of other Taurus sources (Doppmann et al., 2005; Covey et al., 2006). In addition, - and -band absorption by gaseous warm organic molecules (HCN, C2H2, CO) has been reported toward GV Tau S (Gibb et al., 2007), making it one of the few pre-main-sequence sources in which such absorption features have been detected.
Less is known about the northern component, the infrared companion of the binary system (GV Tau N). It is approximately 100 times fainter than GV Tau S at optical wavelengths (Stapelfeldt et al., in preparation), is bright at infrared wavelengths, and experiences significant extinction, as indicated by the strong water ice and silicate absorption observed toward the source (Whittet et al., 1988; Van Cleve et al., 1994; Leinert et al., 2001). Extended emission (on a scale) associated with the GV Tau system is found to be highly polarized (6%) at infrared wavelengths, a result that is attributed to scattering by a flattened envelope (i.e., a shell with an aspect ratio of 10:1) or a disk viewed at high inclination (Menard et al., 1993). Since strong silicate absorption is found only in the spectrum of GV Tau N and not GV Tau S, this is taken as evidence for an edge-on disk associated with GV Tau N (Van Cleve et al., 1994).
High angular resolution observations provide limited support for this interpretation. When studied at resolution at , GV Tau N is found to be surrounded by a nebula whose shape may be consistent with the presence of an edge-on disk, but the shape of the nebula is irregular and varies with time (Koresko et al., 1999). The irregular structure is in marked contrast to the symmetric lens-like shape of scattered light distribution seen in the HK Tau B system, a system that is also believed to possess a nearly edge-on disk (Stapelfeldt et al., 1998; Koresko, 1998). Adding further complexity, significant photometric variability is found for both components at on timescales as short as a month (Leinert et al., 2001), with the water ice band absorption strength also varying toward both components.
Here we use spatially resolved high resolution infrared spectroscopy of both binary components to characterize the stellar and circumstellar components of the GV Tau system. Our - and -band spectroscopic observations are described in § 2 and the detected spectral features are described in § 3. We use these data to characterize the stellar and circumstellar properties of the system (§ 4). The results are discussed in § 5 and our conclusions presented in § 6.
2 Observations and Data Reduction
2.1 Spectroscopic Observations
- and -band infrared spectra were obtained on 2007 January 03 using the cryogenic echelle facility spectrometer, NIRSPEC (McLean et al., 1998), on the 10-m Keck II telescope atop Mauna Kea, Hawaii. Spectra were acquired through the 0432 (3 pixel) wide slit, providing spectroscopic resolution (12.5 ). The echelle and cross disperser angles were oriented to obtain -band spectra of transitions of HCN and C2H2 (e.g. 3.04 - 3.09 , order 25). We used the KL blocking filter to image the -band orders onto the instrument’s 1024 1024 InSb detector. Immediately following the -band observations, the echelle and cross disperser gratings were re-oriented to allow key -band features (i.e., Mg I, Al I, Na I, =2-0 CO, and Br) to fall onto the detector. In this configuration, orders 32 – 38 (non-contiguous) were imaged through the NIRSPEC-7 blocking filter onto the detector array.
Both binary components of GV Tau were acquired in the slit simultaneously, at a position angle on the sky of 356 (Leinert & Haas, 1989). Initially, GV Tau N (the brighter component in our observations of ) was centered in the slit. During the - and -band observations the slit was held physically stationary to avoid slight grating angle shifts caused by vibrations from the slit rotator motor. During the time we integrated on the binary pair (25 min. total), the measured flux ratio of the components in the slit did not change systematically. This is consistent with the negligible expected motion of the binary pair within the slit as the non-equatorially mounted telescope tracked. Despite some wind shake in the direction across the slit in the east-west direction, the individual components (separated by 12) were well resolved in median seeing (0), allowing separate spectral extractions of the southern and northern components.
The data were acquired in pairs of exposures of 40s and 60s in the - and -bands, respectively. The telescope was nodded from the slit center in an ABBA sequence along the 24 long slit so that each frame pair would contain object and sky in both nod positions. To correct for telluric absorption, we also obtained spectra of an early-type star located close to GV Tau in the sky (HR 1412), before and after the GV Tau observations (- and -band settings, respectively). Spectra of the internal NIRSPEC continuum lamp were taken for flat fields at the - and -band settings. Exposures of the Argon, Neon, Krypton, and Xenon Arc lamps provided wavelength calibration for all the -band orders, except in order 33 where we used the telluric lines for calibration due to the scarcity of arc lamp lines in this order. We also obtained short exposure (10 0.1s) - and -band images of the GV Tau binary using the slit viewing camera detector (SCAM) in order to measure the relative brightness of the two components.
2.2 Data Reduction
The spectra were reduced using standard IRAF packages (Massey et al., 1992; Massey, 1997). Sky subtracted beam pairs were divided by a normalized flatfield. Individual echelle orders were parsed from the multi-order, co-added images. Bad pixels (i.e., hot or low responsivity pixels) in each order were identified by inspection, and removed by interpolation using in IRAF. To better remove telluric emission features which are more severe in the -band, we rectified the slit in our -band data using 3rd order transform solution derived from the brightest emission sky lines (typically 10-12 per order) traced along the slit length at each beam position before sky subtraction. Transformed and cleaned orders were extracted using the task. Extractions for each binary component of GV Tau were based on a signal profile down to 50% (FWHM) on both sides of the profile peak, to minimize the contaminating flux from the nearby companion. For the -band spectra, residual background sky was subtracted in the extraction using selected regions of the profile cut that were well outside of the profile of the spatially double-peaked binary.
Wavelength calibration in the -band was achieved using selected telluric absorption features present in the spectra of the telluric standard star (HR 1412). Stronger unblended telluric lines were selected over weaker ones, while avoiding very saturated lines whose depths went to zero. Rest wavelengths for the absorption features were obtained from the HITRAN database (Rothman et al., 1998). Most or all of these same lines were used to derive a wavelength solution for the target, with the exception of those lines that might fall very close in wavelength to emission or absorption lines present in the target spectrum.
Telluric features present in the spectra of GV Tau at each nod position in the slit were removed by dividing by the spectrum of the telluric standard (HR 1412) observed at the same nod position. Several weak stellar absorption lines were present in the K-band orders of the standard due to its relatively late spectral type (A7 III). These atomic lines were modeled and removed by dividing the standard spectrum by the best fit stellar synthetic spectrum before division into the GV Tau spectrum. The stellar synthetic spectra were generated with the program MOOG (Sneden, 1973) using the NextGen model atmospheres (Hauschildt et al., 1999). The initial line list was taken from Kurucz (1993), and individual line parameters were adjusted to fit the observed disk-center solar spectrum of Livingston & Wallace (1991). For HR 1412, we used a model with K and . Small adjustments were made in the elemental abundances to give the best empirical fit to HR 1412. We measured , in agreement with published values (Royer et al., 2002).
Br absorption at 2.166 was also present in the telluric standard. We therefore used the synthetic telluric spectral modeling program, AT (Grossman, private communication) to model the telluric features that we observed in this region of the HR 1412 spectrum. We fit the depths of the observed telluric lines and then used the best-fit synthetic spectrum to divide out the telluric lines in the GV Tau spectra in this order (order 35, Fig. 1c).
In order to view the true continuum shape within each echelle order, we then multiplied the resulting GV Tau spectra by the spectral slope of a 7600 K blackbody (Figs. 1a – 1e).
Simple aperture photometry of the SCAM images showed that GV Tau N was 35-40% brighter than GV Tau S in the K+open, NIRSPEC7, and KL filters. The relative flux of the GV Tau N and S -band spectra in orders 33 and 34 (Figs. 1a & 1b), which are located in the middle of the -band filters above, are consistent with the aperture photometry.
3 Detected Spectral Features
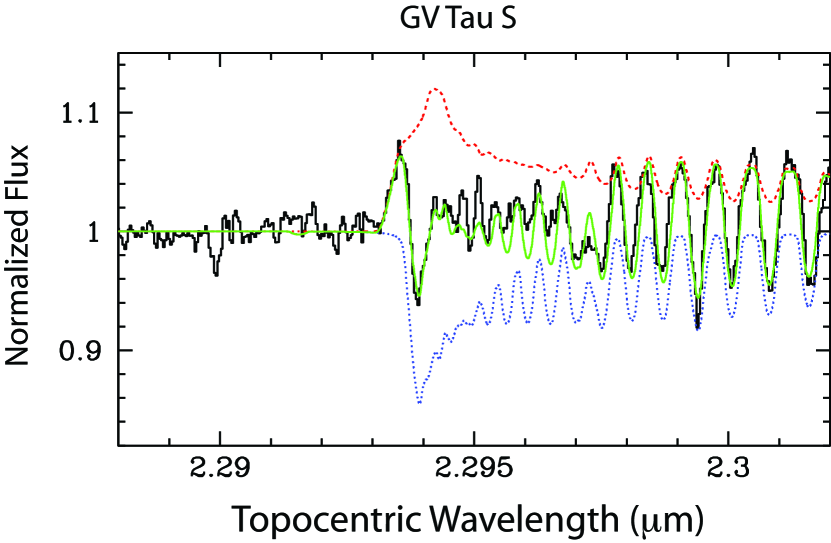
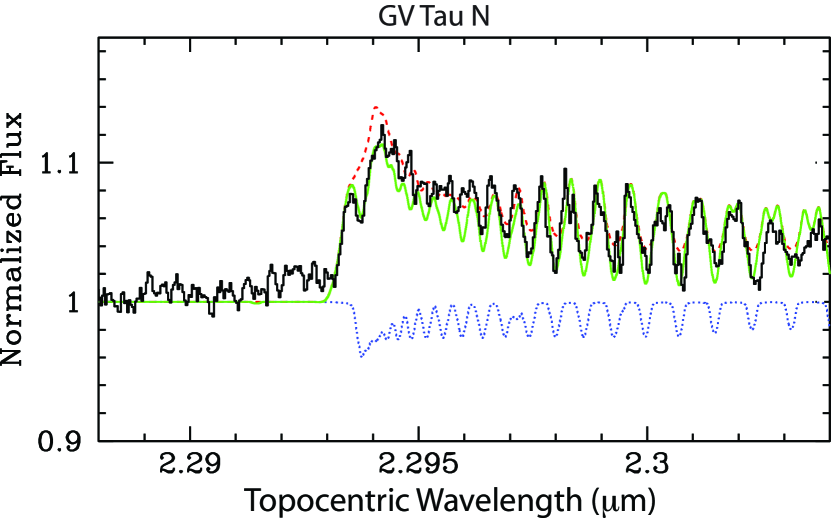
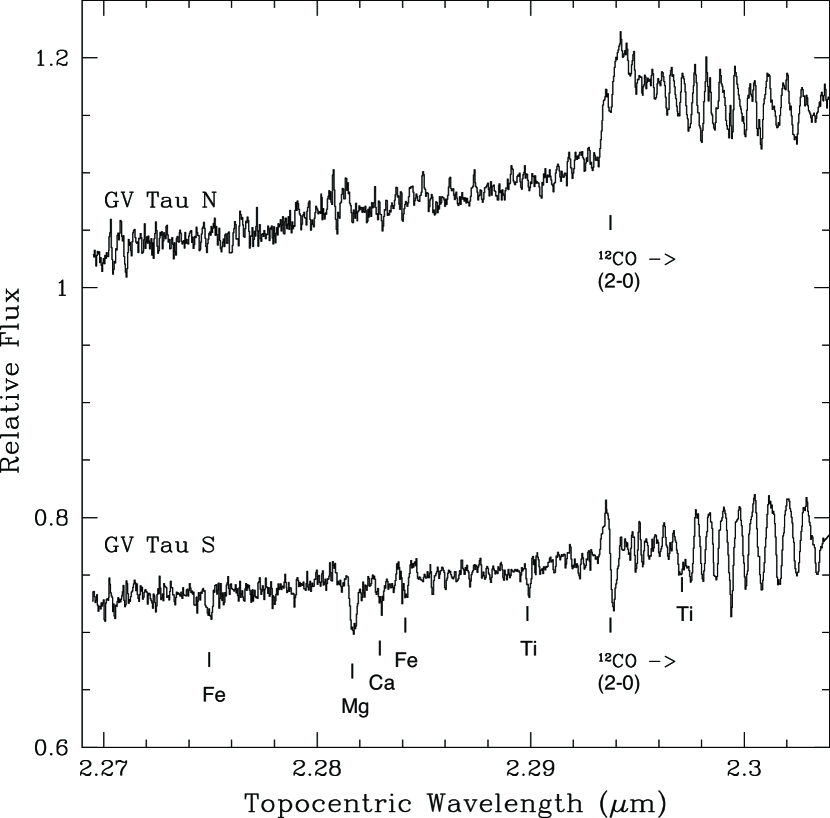
Emission and absorption features in GV Tau N and GV Tau S were detected in the -band spectra of each object (Figs. 1a – 1d). In order 33 (2.269 – 2.304 , Fig. 1a), =2-0 CO overtone emission and absorption are present in both GV Tau N and GV Tau S. The emission component dominates the spectrum in GV Tau N in this order, while the absorption dominates in GV Tau S. Lines due to absorption of neutral atomic species that are present in GV Tau S in this order (e.g., Fe I at 2.2747 and Mg I at 2.2814 ) are absent in GV Tau N. The -band absorption features in both components are presumed to originate from the stellar photosphere.
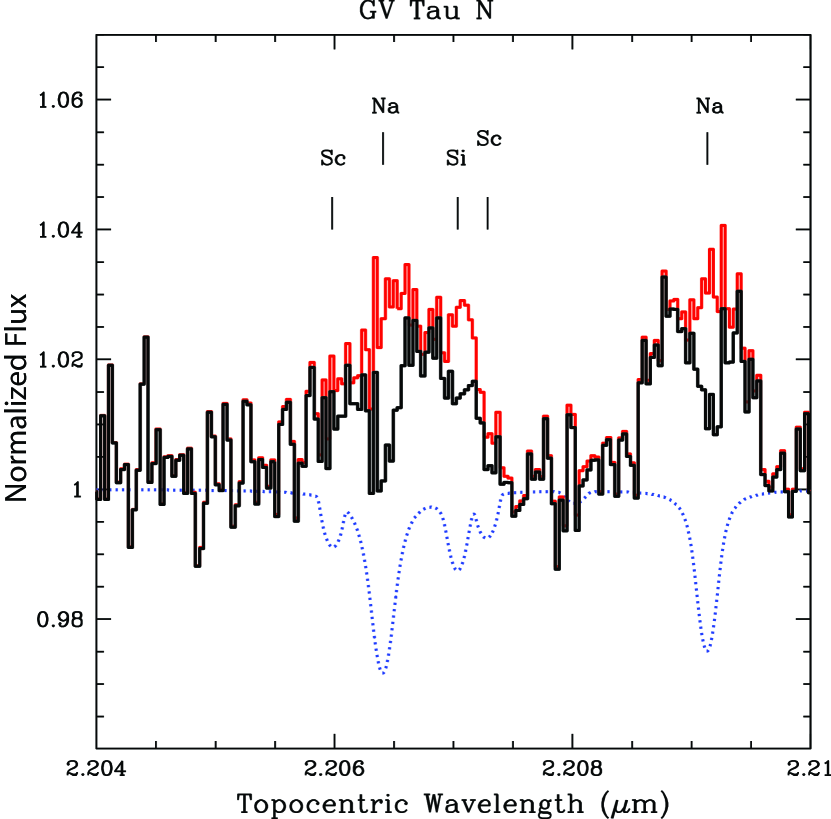
Emission features of Na I and H2 dominate the structure of the GV Tau N spectrum in order 34 (2.203 – 2.236 , Fig. 1b). Interestingly, the broad emission lines near 2.2065 and 2.2090 in GV Tau N appear to show absorption components possibly of a photospheric origin. The S(0) 1-0 H2 emission at 2.2235 is detected in both components, and is spatially extended (see 4.3). Other than the H2 emission, the spectrum of GV Tau S in this order displays neutral atomic absorption lines of photospheric origin (Fig. 1b).
The spectra in order 35 (2.140 – 2.173 , Fig. 1c) are characterized by strong H I Br emission in both GV Tau N and GV Tau S. The continuum level near the Brackett line is 20% higher in GV Tau N, while the equivalent width of the emission line is 3 times greater in GV Tau S.
In order 36 (2.081 – 2.113 , Fig. 1d), the spectrum of GV Tau N appears featureless. In contrast, GV Tau S exhibits photospheric absorption lines (e.g., Mg I at 2.1065 and Al I at 2.1099 ), which are useful as diagnostics of the stellar effective temperature and surface gravity.
4 Results
4.1 Stellar and Circumstellar Properties
4.1.1 South Component
All four -band orders of the GV Tau S spectrum display stellar photospheric absorption by neutral atomic features (e.g., Na I, Si I, Sc I, Mg I, Al I) and =2-0 CO. We used synthetic stellar spectral models generated by the synthesis program MOOG (Sneden, 1973) and using NextGen stellar atmosphere model structures (Hauschildt et al., 1999) to constrain the stellar properties of GV Tau S. Our modeling focused on three spectral sub-regions: The “Na” region (2.204–2.210 ), the “Mg/Al” region (2.104–2.111 ), and the “CO” region (2.292–2.300 ). These regions of the -band contain the strongest absorption features with which to measure the stellar properties of low-mass YSOs (Doppmann et al., 2005). The absorption lines of Na I and Mg I are particularly gravity and temperature sensitive, but in the opposite sense from each other. For example, at cool effective temperatures (3200–4500 K) and subdwarf surface gravities () Na and Mg lines both grow stronger as increases, but an increase in causes Mg lines to grow while the Na lines weaken. A simultaneous fit of synthesis models to the Na and Mg/Al regions (Fig. 2) constrains these key stellar properties in reducing or breaking the temperature-gravity degeneracy displayed in a single absorbing species (Doppmann et al., 2005).
The best model fit to these wavelength sub-regions yields =3800 100 K, =4.0 0.17, rotation= 24 3 , and -band veiling =2.5 0.2 (Fig. 2). From the and derived above, we estimate a stellar luminosity, mass, and radius of using the pre-main-sequence model tracks of Siess et al. (2000), where a 3 Myr isochrone was consistent with our values of temperature and gravity. The derived luminosity and effective temperature imply an estimated -band extinction toward GV Tau S of based on the most recent photometery from the literature (2000 March 07; Leinert et al., 2001), which reported a value () that was within 1- of the average in the study over the time period from September 1988 to March 2000 (). Our derived -band extinction is consistent with the average optical extinction of estimated by Koresko et al. (1997).
Our derived , , and values are consistent with the high resolution optical study of White & Hillenbrand (2004) given the low signal to noise (S/N 10) in their 1999 December 06 observation of GV Tau S. The moderately high veiling we derive () is more characteristic of Class I or flat spectrum YSOs than of T Tauri stars, although still within the range of veiling values measured in a sample of Ophiuchus Class II sources (Doppmann et al., 2003).
These results agree well with the veiling measured from the previous observation of GV Tau S from 2001 November 06 (Doppmann et al., 2005). Doppmann et al. (2005) quote a veiling value of = 1.8, which includes a correction for a systematic effect seen in the best fit synthesis models to observations of MK standards (see Eqn. 1 in § 3.6 of Doppmann et al., 2005). The measured veiling without the correction for the systematic effect was = 2.4, which is consistent with our measured value.
The constraint on effective temperature and surface gravity is consistent with the results from Doppmann et al. (2005). Doppmann et al. (2005) reported a somewhat warmer effective temperature () and higher surface gravity (), which was based on fits to synthetic spectra of a smaller number of photospheric absorption features (excluding Sc I lines at 2.2058 and 2.2071 m) at similar signal-to-noise and slightly lower spectral resolution (=18,000). A comparably good fit to the 2001 data can be obtained with and that includes the Sc I lines above as was done in this study.
The radial velocity of GV Tau S was measured by shifting a synthetic template spectrum to independently match each of 12 selected absorption lines that were present in orders 33 and 34 (see Table 1). The error was determined from the quadrature sum of the systematic error, dominated by the uncertainty in the wavelength calibration of the data, and the statisical error, measured from the variation in the radial velocity values among the individual absorption lines. Our measured of GV Tau S differs from previous measurements in the literature for this source. In 2001, the radial velocity of GV Tau S was measured to be = –6.2 (Covey et al., 2006), blueshifted by 9–15 relative to the observations of this study and that of White & Hillenbrand (2004, ). As a result, this source was flagged as a radial velocity outlier, since its radial velocity was 3- from the mean of all the Taurus sources in the survey (Covey et al., 2006). Our 2007 observations now place the radial velocity of GV Tau S () close to the mean () of the sources in the 2001 Taurus survey (Doppmann et al., 2005; Covey et al., 2006). We discuss the radial velocity variations further in § 5.1.
As described in 3, the CO =2-0 bandhead of GV Tau S has both emission and absorption components. Using the best fit stellar parameters obtained from the Na and Mg/Al regions of the GV Tau S spectrum as a constraint on the stellar photospheric properties, we fit the CO feature with a composite model of circumstellar disk emission and stellar photospheric absorption (Fig. 3). The emission component is modeled as arising from a differentially rotating disk that is in chemical equilibrium. The emission arises between an inner radius , at which the projected disk rotational velocity has a specified value of , and an outer radius . The disk temperature and column density are modeled as simple radial gradients that decrease as power laws (Carr, 1993; Carr et al., 2004). The star and disk are placed at the same radial velocity and the composite model spectrum is smoothed to the velocity resolution of NIRSPEC. The model fit parameters are given in the caption to Fig. 3.
4.1.2 North Component
The spectrum of GV Tau N shows emission and absorption components in both the CO and Na regions (Figs. 4 & 5) of the -band. We attribute the emission to a circumstellar disk; the absorption features are presumed to arise from the stellar photosphere, implying a late spectral type for the star. We assume a stellar mass of =0.8 and an age of =3 Myr for this object, consistent with the typical values found for low-mass YSOs in Taurus (Briceño et al., 2002). These assumptions imply an effective temperature of =4100 K and a surface gravity of from pre-main-sequence evolutionary model tracks (Siess et al., 2000).
Using these assumed stellar properties, we modeled the CO feature observed in GV Tau N as a combination of circumstellar disk emission and stellar photospheric absorption. As in the case of GV Tau S, the emission component is fit with a simple model of CO emission from a differentially rotating disk. The details of the model fit are given in the caption to Fig. 4. We find a good fit to the observed CO overtone emission (Fig. 4) with the additional assumptions of slow stellar rotation (= 15 ) and heavy veiling (=12). Such a substantial infrared veiling greatly exceeds what has been measured from near–IR photospheric absorption lines in past studies (e.g., , Luhman et al., 1998; Luhman & Rieke, 1999; Doppmann et al., 2003, 2005). It also results in large uncertainties in the inferred -band extinction.
Broad Na emission has been observed in several Class I and flat spectrum protostars, always accompanied by =2-0 CO emission (Doppmann et al., 2005). The absorption lines in the Na region, apparent within the broader emission features, can be fit with the same stellar photospheric model and somewhat larger veiling (, Fig. 5) than was used in fitting the CO region. If we subtract the stellar photospheric model from the observed spectrum, the resulting spectrum is similar to the Na emission seen in other T Tauri stars. The absence of detected spectral features in the Mg/Al region of GV Tau N in our data (signal-to-noise ) is also consistent with the model assumptions.
The radial velocities of the CO and Na absorption components in GV Tau N are in agreement with one another (, see Table 2), and with the radial velocity of the emission component from which they arise. Given the assumed mass , we estimate the stellar luminosity, radius, and -band extinction (i.e., , and ) from the photospheric absorption we find in our spectra, using Siess et al. (2000) evolutionary model tracks and Leinert et al. (2001) photometry from 2000 March 07 ().
The unknown apparent magnitude of GV Tau N on the date of our observations introduces an uncertainty in the derived -band extinction and veiling. If the apparent magnitude was the historical average of (Leinert et al., 2001), instead of the value reported on 2000 March 07 of (Leinert et al., 2001), then the extinction () would increase by 1.2. If we had assumed a higher (=4300 K) or lower (=3900 K) temperature than the value we use here (=4100 K), which was based on the IMF peak (Briceño et al., 2002), this would imply a veiling () of 11 or 13, and an extinction () of +0.5 or -0.6 relative to the derived value presented above (=2.6).
4.2 Brackett Emission
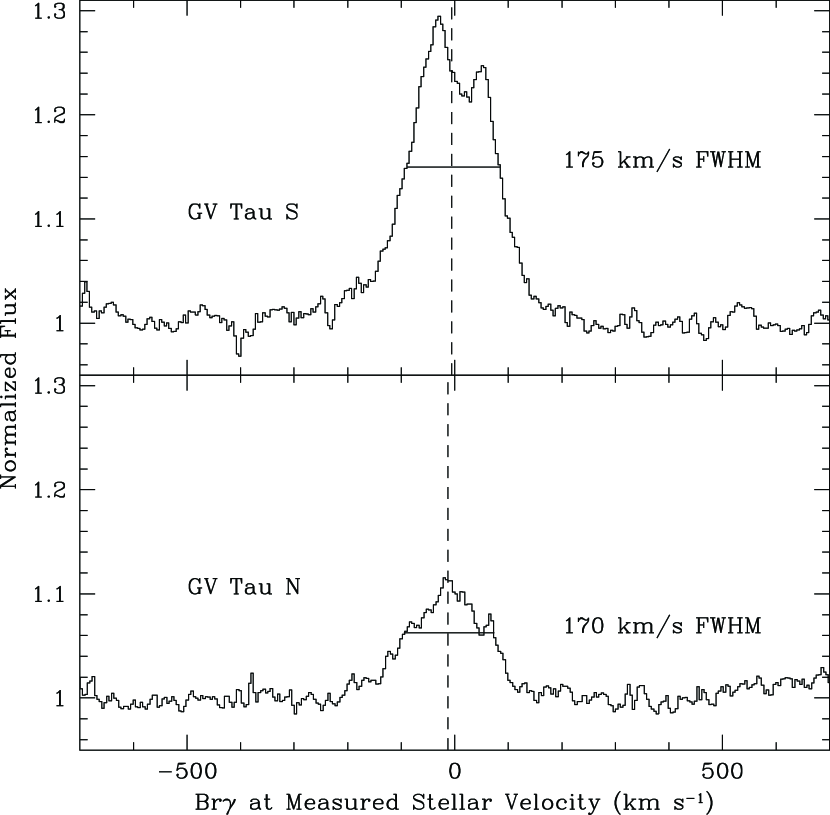
We detect H I Br emission in both components of GV Tau (Fig. 6). The broad emission profiles (i.e., 175 and 170 FWHM, GV Tau S and N, respectively) are consistent with the Br width of other active T Tauri stars (Najita et al., 1996; Folha & Emerson, 2001). In GV Tau S, where the equivalent width is three times greater than in GV Tau N (EW Å), the centroid velocity is very close to the stellar velocity, as measured by the stellar photospheric absorption lines (see 4.1.1). However, the centroid velocity of the Br line in GV Tau N is blueshifted by 12.5 relative to the CO absorption component ( 4.1.2). Blueshifted Br centroids, which are common among T Tauri stars, are consistent with an origin for the emission in gas infalling in a stellar magnetosphere (Najita et al., 1996; Muzerolle et al., 1998b; Folha & Emerson, 2001).
We can use the Br line strength to place a rough constraint on the contribution of stellar accretion in GV Tau N and GV Tau S to the bolometric luminosity of the system. We first convert the emission equivalent width to a line luminosity using the 2000 March 07 -band photometry from Leinert et al. (2001), and the estimated -band extinction for each component (§ 4.1.2 and § 4.1.1). The estimated Br luminosities for GV Tau N and S are and , respectively. Using the empirical relation given by Muzerolle et al. (1998b) in their Figure 4, we infer accretion luminosities of 0.1 and 0.2 for GV Tau N and S, respectively. Thus, we estimate the total luminosity (stellar+hot accretion) of the GV Tau system to be 1.2 , below what has been estimated for its bolometric system luminosity (; Kenyon & Hartmann, 1995; Furlan et al., 2007).
4.3 H2 emission
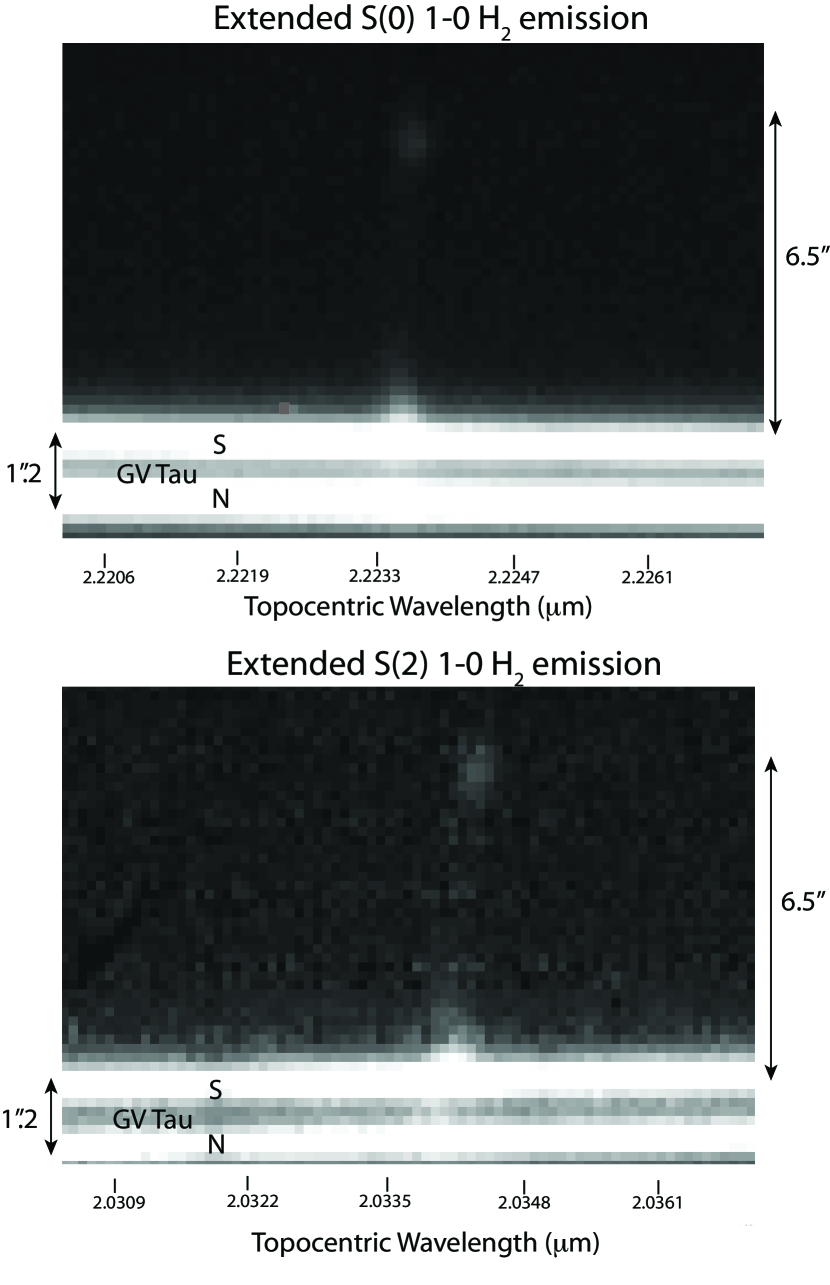
The S(0) 1-0 H2 emission (2.22329 ) that we detect from GV Tau is marginally resolved in our spectra with a velocity width of 14 and 17 for GV Tau S and N, respectively. Spatially, the bulk of the emission is coincident with GV Tau N and GV Tau S (within the 05 extraction aperture) but extends along the slit to the south (P.A.=176) ending at a bright knot 65 south of GV Tau S (Fig. 7).
HST imaging of the GV Tau system shows resolved nebular emission extending away in an arc to the East, South and Southwest of the GV Tau S while GV Tau N is comparatively free of nebulosity (K. Stapelfeldt, private communication). The location of the emission knot is spatially coincident with a wisp of faint optical nebulosity in the HST image. No near-IR line emission is seen immediately to the North of GV Tau, which is coincident with a lack of optical nebulosity in this region. The radial velocity of the H2 emission is constant along the slit (), and agrees with the radial velocity of the HCN absorption (§ 4.4) and molecular envelope for this system (Hogerheijde et al., 1998).
In order 37, we detect S(2) 1-0 H2 emission in both stellar components. The emission is extended southward along the slit in the same way as the S(0) emission. The emission is 2–3 times brighter than the S(0) line emission. As with the S(0) line, the S(2) equivalent width is times stronger in GV Tau S compared to GV Tau N. In both components, the equivalent widths and velocity widths are greater than their counterparts in the S(0) lines. The observed H2 line ratios (i.e., 1-0 S(2)/1-0 S(0)) in GV Tau N and S are consistent with shock excitation, similar to most of the classical T Tauri stars observed by Beck et al. (2007).
4.4 Molecular Absorption
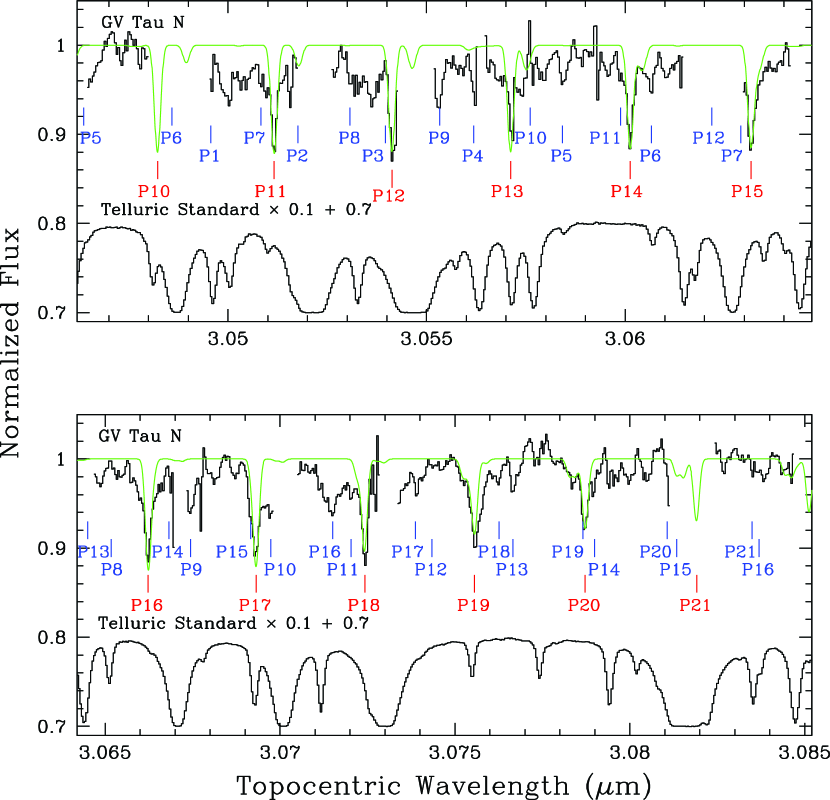
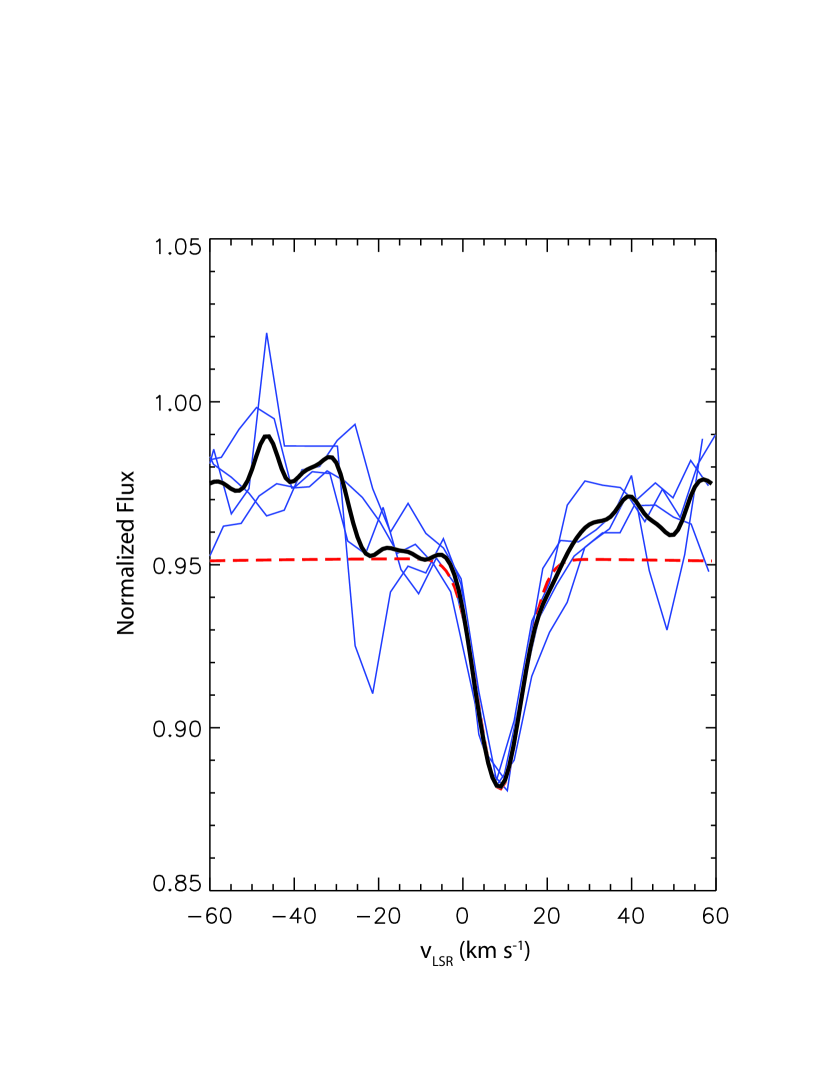
In order to characterize the molecular absorption detected in the -band spectrum of GV Tau N, we used a simple model of absorption by a slab at a single temperature and column density. We adopted the HCN linelist from the HITRAN database (Rothman et al., 1998). The data are well fit with a slab temperature K and column density , with a microturbulent line broadening of and radial velocity (Fig. 8). The radial velocity of the molecular absorption was measured using selected P-branch lines (Table 3) in regions of the spectrum that had good telluric transmission and that were unblended with other species (such as C2H2). We constructed an average HCN absorption profile from four selected HCN absorption transitions (P11, P14, P15, and P16) to which we fit a Gaussian profile (Fig. 9). The 3- error of on the radial velocity was estimated by comparing the Gaussian fit of the average absorption profile to each of the P-branch line fits separately.
5 Discussion
To summarize, both GV Tau N and S appear to possess slowly rotating () late type (K7–M2) photospheres. While the stellar properties are consistent with an age of Myr based on current pre-main-sequence stellar evolutionary tracks, the age estimate is uncertain because ages inferred from the tracks have yet to be observationally verified. We also find that GV Tau S is a radial velocity variable. For GV Tau N, we find that the system shows strong CO overtone emission, strong -band veiling (), and a blue-shifted Br centroid. These properties are consistent with a young star undergoing active accretion in a disk and stellar magnetosphere. The stellar radial velocity found for GV Tau N () differs from the radial velocity of the GV Tau molecular envelope (, Hogerheijde et al., 1998) and the radial velocity of the warm ( K) HCN absorption detected in the -band (). We discuss the possible implications of these results in the rest of this section.
5.1 Radial Velocity Variability in GV Tau S
The stellar radial velocity of found for GV Tau S differs from the observed in November 2001 (; Covey et al., 2006), and the in December 1999 (, see Table 4; White & Hillenbrand, 2004). The reported here differs slightly from the velocity of the Taurus molecular cloud in the vicinity of GV Tau, as measured in the CO =1-0 transition (Dame et al., 2001) and the measured for the gaseous envelope surrounding GV Tau (Hogerheijde et al., 1998).
A plausible explanation for the radial velocity variations exhibited by GV Tau S is that it is a spectroscopic binary with a secondary that is sufficiently faint that it is undetectable in our spectra. Assuming that the systemic velocity is that of the molecular cloud and that the primary has the stellar properties () derived earlier (§ 4.1.1), the three reported radial velocities for GV Tau S can be accounted for if GV Tau S possesses a companion in a day circular orbit ( AU). A companion with this mass at the typical age of Taurus sources ( Myr), would contribute a small fraction (20%) of the observed continuum. Its -band spectral features would appear only 2% deep in the observed spectrum, consistent with the apparent lack of such features in our observed spectrum. The observed radial velocity variation and the -band spectrum are also consistent with smaller companion masses and orbital separations. A larger stellar mass for the companion in a more face-on orbit is ruled out since it would be detectable in our high signal-to-noise spectra.
5.2 Warm Molecular Absorption in GV Tau N
Gibb et al. (2007) previously reported absorption toward GV Tau S in the HCN low- R and P lines near , based on observations made on 2006 February 17 and 18. The HCN absorption was characterized by equivalent widths , a radial velocity , and a rotational temperature of K. No HCN absorption was reported toward GV Tau N in the Gibb et al. (2007) study. The wavelength coverage of our observations includes many of the same lines that were observed by Gibb et al. (2007) as well as higher rotational lines.
At the epoch of our observations, no HCN absorption was present toward GV Tau S. However, HCN absorption was detected toward GV Tau N. The absorption lines we detect toward GV Tau N have equivalent widths and radial velocities similar to those reported by Gibb et al. (2007) toward GV Tau S.
We find a higher temperature ( K) for the absorbing gas toward GV Tau N, but this temperature is consistent with the relative HCN line strengths observed by Gibb et al. (2007). Their lower temperature was based on analysis of only low- lines (i.e., R1–R6, P2–P7); warmer temperatures are indicated when the higher- lines used in our analysis are included. Consistent with our results, HCN absorption with properties similar to those reported here was also detected toward GV Tau N (but not GV Tau S) in mid-infrared observations made with TEXES on Gemini-North at an intermediate epoch (November 2006; Najita et al., in preparation).
These results may indicate that the molecular absorption toward both components is variable. Indeed, both GV Tau N and S are found to experience significant photometric variability in the - through -bands and in the ice feature (Leinert et al. 2001). The high temperature of the absorbing gas suggests that the gas is located close to the star rather than in a distant circumbinary envelope or the molecular cloud. So if variability accounts for the difference in the absorption properties, we are likely to be observing the variations in the near-circumstellar environment of each source, rather than the motion of a distant absorber across our line-of-sight. Such a distant absorber is believed to account for the photometric variations in GV Tau S and perhaps variations in the ice absorption (Leinert et al., 2001).
Another, more mundane, possibility is that the components of the binary pair were misidentified by Gibb et al. (2007). The interpretation that the warm molecular absorption is entirely associated with GV Tau N would be consistent with the systematically stronger ice feature measured toward this component, the strong silicate absorption that is detected only toward GV Tau N (Van Cleve et al. 1994), and the hypothesis from the literature that GV Tau N is surrounded by an edge-on disk. Additional observations of the GV Tau system would be useful in resolving this issue.
Setting aside for now the possibility that the HCN absorption is time variable, we can explore the nature of the absorbing gas that we observed based on the stellar and circumstellar properties that we have found for GV Tau N. As described at the beginning of this section, the stellar velocity is blueshifted from the envelope velocity by . This suggests that the detected stellar component of GV Tau N possesses an orbiting companion. If it does not, at a velocity of relative to the envelope, the star would travel 0.1 pc in yr, escaping its molecular envelope on a timescale much less than the age of the system. If GV Tau N is then a binary, the envelope velocity is the more appropriate velocity reference frame for the system. Another possibility is that the stellar light is not seen directly, but rather in reflection against material on the far side of the envelope that is infalling toward us (S. Strom, private communication). In either interpretation, the measured stellar velocity is not the systemic velocity.
As also described at the beginning of this section, the radial velocity of the HCN absorption is marginally different from that of the GV Tau molecular envelope by . The small velocity difference allows for the possibility that some of the absorption arises in gas that is infalling with respect to the envelope. Higher spectral resolution observations (e.g., with TEXES; Najita et al., in preparation) can better determine whether this is the case.
In the meantime, we can consider two possible scenarios for the origin of the HCN absorption: (1) Some fraction of the absorption arises in gas infalling from the molecular envelope toward the star at and/or (2) the absorption arises in warm gas in orbit around the star.
Origin in an Envelope. Since the bolometric luminosity of the system is 7–9 (Kenyon & Hartmann, 1995; Furlan et al., 2007) and the stellar contribution (photospheric and stellar accretion, § 4.1.2 and § 4.2) to the luminosity is , the residual disk and envelope accretion is . The large residual accretion luminosity compared to the stellar accretion luminosity for GV Tau N inferred from the Br emission (; § 4.2) implies that the disk/envelope accretion rate is much larger than the stellar accretion rate for GV Tau N, similar to the results obtained for Class I sources by White & Hillenbrand (2004). For accretion in a disk inward to a radius of , the disk accretion luminosity of 7 corresponds to a disk accretion rate of for and a stellar mass of . In comparison, the spectral energy distributions of most of the Class I sources in Taurus are fit with envelope accretion rates up to an order of magnitude larger (Furlan et al., 2007). A lower accretion rate is more consistent with the weak envelope emission and outflow activity associated with GV Tau.
For the estimated mass of the stellar component(s) of GV Tau N (0.8), the envelope infall velocity is expected to be at distances of 360 AU. In contrast, models of gas in collapsing protostellar envelopes suggest that the observed HCN temperature of K can be achieved only close to the star, within 2 AU given the accretion luminosity of the system (Ceccarelli et al., 1996, their figure 4), i.e., well within the distance of 360 AU that would be inferred for the infalling gas based on its velocity relative to the molecular envelope. It therefore appears unlikely that most of the absorption could arise in an infalling envelope unless there are additional heating processes for the infalling gas beyond those considered in Ceccarelli et al. (1996). If other heating processes, such as oblique shocks, can heat distant material to K, the warm molecular absorption that we observe could also arise in a distant, non-infalling envelope. However, the lack of molecular absorption observed toward GV Tau S argues against the gas originating from a distant envelope which would surround both GV Tau N and S.
An alternative scenario is that GV Tau N is a single star and its measured stellar velocity is the appropriate systemic velocity. In this case, at a distance 2 AU from the star, the radial component of the infall velocity would be 20 (Cassen & Moosman, 1981) for the estimated stellar mass of GV Tau N. This is similar to the velocity difference between the HCN absorption and GV Tau N stellar photosphere (Table 4). If GV Tau N is a single star, it is then moving relative to the molecular envelope and, as already discussed above, it will travel pc in yr. It then seems unlikely that the star and the envelope are physically associated, which makes it difficult to account for the origin of the infalling gas in this scenario.
Origin in a Circumstellar Disk. Another possibility is that the HCN absorption arises in the heated atmosphere of a gaseous disk (see also Gibb et al., 2007). Models of the chemistry of the inner regions of circumstellar disks predict that HCN will be abundant at radial distances of a few AU (Markwick et al., 2002). Models of the thermal structure of disk atmospheres further predict that the disk surface will reach temperatures K at distances of a few AU (e.g., Glassgold et al., 2004). If the disk in the GV Tau N system is viewed edge-on, as hypothesized in the literature (Menard et al., 1993; Van Cleve et al., 1994), it seems plausible that the warm HCN absorption could arise in the disk atmosphere seen in absorption against the warmer, inner region of the disk that produces the -band continuum.
The rarity of such a line–of–sight through a disk may also explain another unusual characteristic of GV Tau: the low CO2 ice absorption optical depth toward the source compared to its silicate optical depth. The data of Furlan et al. (2007) show that the peak 10 silicate optical depth is times the peak optical depth of the 15.2 CO2 ice absorption. All other Taurus Class I sources in the Furlan sample have , with the exception of DG Tau B, another possible edge-on source. A high ratio of may occur if a substantial fraction of the silicate optical depth is produced in a warm disk region in which CO2 ice has sublimated.
GV Tau N would be a spectroscopic binary in this scenario, in order to account for the difference in radial velocity between the stellar photosphere and the warm molecular absorption. Because the warm HCN absorption is approximately at rest relative to the molecular envelope velocity, in this scenario it would arise in a circumbinary disk seen edge-on. In contrast, the CO overtone emission, which is found to share the radial velocity of the stellar photosphere, arises from the circumstellar disk of the primary component.
5.3 Comparison to IRS 46
Strong absorption by gaseous warm organic molecules appears to occur rarely among low mass young stars. GV Tau and another source, IRS 46, are the only systems in which such absorption has been reported to date. IRS 46 is a low-mass YSO with a spectral energy distribution that indicates either a Class I source or a Class II source viewed nearly edge-on (Lahuis et al., 2006). IRS 46 is similar to GV Tau N in that it also shows Br and 2.3 CO overtone emission (see YLW 16B in Doppmann et al., 2005) and strong absorption by gaseous warm organic molecules in the -band and at mid-infared wavelengths (CO, HCN, C2H2, CO2; Lahuis et al., 2006). The temperature ( K) and equivalent width of the HCN absorption are similar to that observed toward GV Tau N. Unlike GV Tau N, the warm HCN absorption in IRS 46 () shows a large velocity offset from the surrounding molecular cloud (, Table 4). In contrast to the situation for GV Tau N, the stellar radial velocity of IRS 46 is unknown. If the system is at the cloud velocity, the warm molecular absorption is blueshifted from the system by . Lahuis et al. (2006) speculated that the warm molecular absorption in IRS 46 arises in the inner region of a circumstellar disk, possibly at the footpoint of an outflowing disk wind in order to account for the presumed blueshift of the absorption. This scenario is consistent with the interpretation of the spectral energy distribution as indicating a disk system viewed edge-on. Our “disk origin” scenario for GV Tau N is similar to the explanation given by Lahuis et al. (2006) for the HCN absorption in IRS 46. In both cases, the warm molecular absorption arises in a disk, although there is no outflow component to the flow in the case of GV Tau N.
6 Summary and Conclusions
We have used spatially resolved - and -band spectroscopy to characterize the stellar and circumstellar properties of the GV Tau binary system. We find that GV Tau S is a radial velocity variable, possibly the result of an unseen low-mass companion. The radial velocities measured here and in the literature, when combined with the apparent absence of the spectral signature of a companion in our -band spectra, are consistent with a companion with and AU. Further spectroscopic monitoring of this source would be useful to confirm our interpretation and to better constrain the companion properties.
The other component of the binary system, GV Tau N, is found to show strong CO overtone emission, strong -band veiling (), and Br emission with a blue-shifted emission centroid; signatures consistent with a young actively accreting star. From the presence of apparent stellar absorption features in the 2-0 CO overtone bandhead and the 2.2 Na emission features, we infer a late spectral type ( K) and a stellar radial velocity of . The warm ( K) HCN absorption found toward GV Tau N in the -band spectrum of this source is offset in velocity by relative to the star and relative to the GV Tau molecular envelope. The large velocity of the star relative to its molecular envelope would cause it to escape the molecular envelope on a timescale much shorter than its age unless the star is a spectroscopic binary.
The small redshift () of the warm molecular absorption relative to the molecular envelope velocity (assumed to be the systemic velocity) suggests that most of the absorption arises in a disk atmosphere viewed close to edge on, although an origin in the molecular envelope is not ruled out completely. This interpretation can be tested with further observations of GV Tau N. Observations at higher spectral resolution can better constrain the radial velocity of the absorbing gas relative to the systemic velocity. Observations that explore the molecular abundances of the absorbing gas may also be useful in testing a disk origin for the absorption.
References
- Adams et al. (1987) Adams, F. C., Lada, C. J., & Shu, F. H. 1987, ApJ, 312, 788
- Baraffe et al. (1998) Baraffe, I., Chabrier, G., Allard, F., & Hauschildt, P. H. 1998, A&A, 337, 403
- Beck et al. (2007) Beck, T. L., McGregor, P.J., Takami, M., & Pyo, T.S. 2007, astroph #0711.3844
- Bertout et al. (1999) Bertout, C., Robichon, N., & Arenou, F. 1999, A&A, 352, 574
- Briceño et al. (2002) Briceño, C., Luhman, K. L., Hartmann, L., Stauffer, J. R., & Kirkpatrick, J. D. 2002, ApJ, 580, 317
- Carr (1993) Carr, J. S. 1993, ApJ, 406, 553
- Carr et al. (2004) Carr, J. S., Tokunaga, A. T., & Najita, J. 2004, ApJ, 603, 213
- Cassen & Moosman (1981) Cassen, P., & Moosman, A. 1981, Icarus, 48, 353
- Ceccarelli et al. (1996) Ceccarelli, C., Hollenbach, D. J., & Tielens, A. G. G. M. 1996, ApJ, 471, 400
- Chandler et al. (2005) Chandler, C. J., Brogan, C. L., Shirley, Y. L., & Loinard, L. 2005, ApJ, 632, 371
- Covey et al. (2006) Covey, K. R., Greene, T. P., Doppmann, G. W., & Lada, C. J. 2006, AJ, 131, 512
- Dame et al. (2001) Dame, T. M., Hartmann, D., & Thaddeus, P. 2001, ApJ, 547, 792
- Devine et al. (1999) Devine, D., Reipurth, B., Bally, J., & Balonek, T. J. 1999, AJ, 117, 2931
- Doppmann et al. (2005) Doppmann, G. W., Greene, T. P., Covey, K. R., & Lada, C. J. 2005, AJ, 130, 1145
- Doppmann et al. (2003) Doppmann, G. W., Jaffe, D. T., & White, R. J. 2003, AJ, 126, 3043
- Folha & Emerson (2001) Folha, D. F. M., & Emerson, J. P. 2001, A&A, 365, 90
- Furlan et al. (2007) Furlan et al. 2007, in press, ApJS
- Gibb et al. (2007) Gibb, E. L., Van Brunt, K. A., Brittain, S. D., & Rettig, T. W. 2007, ApJ, 660, 1572
- Hauschildt et al. (1999) Hauschildt P. H., Allard, F. & Baron, E. 1999, ApJ, 512, 377
- Hogerheijde et al. (1998) Hogerheijde, M. R., van Dishoeck, E. F., Blake, G. A., & van Langevelde, H. J. 1998, ApJ, 502, 315
- Hoffmeister et al. (2006) Hoffmeister, V. H., Chini, R., Scheyda, C. M., Nürnberger, D., Vogt, N., & Nielbock, M. 2006, A&A, 457, L29
- Hollenbach et al. (1995) Hollenbach, D. J., Ceccarelli, C., Neufeld, D. A., & Tielens, A. G. G. M. 1995, From Gas to Stars to Dust, 73, 243
- Glassgold et al. (2004) Glassgold, A. E., Najita, J., & Igea, J. 2004, ApJ, 615, 972
- Goodrich (1986) Goodrich, R. W. 1986, AJ, 92, 885
- Gullbring et al. (1998) Gullbring, E., Hartmann, L., Briceno, C., & Calvet, N. 1998, ApJ, 492, 323
- Kenyon & Hartmann (1995) Kenyon, S. J. & Hartmann, L. 1995, ApJS, 101, 117
- Koresko et al. (1999) Koresko, C. D., Blake, G. A., Brown, M. E., Sargent, A. I., & Koerner, D. W. 1999, ApJ, 525, L49
- Koresko (1998) Koresko, C. D. 1998, ApJ, 507, L145
- Koresko et al. (1997) Koresko, C. D., Herbst, T. M., & Leinert, C. 1997, ApJ, 480, 741
- Kurucz (1993) Kurucz, R. 1993, ATLAS9 Stellar Atmosphere Programs and 2 km/s grid. Kurucz CD-ROM No. 13. Cambridge, Mass.: Smithsonian Astrophysical Observatory, 1993., 13
- Kurucz & Bell (1995) Kurucz, R. L., & Bell, B. 1995, Kurucz CD-ROM, Cambridge, MA: Smithsonian Astrophysical Observatory, —c1995, April 15, 1995
- Lahuis et al. (2006) Lahuis, F., et al. 2006, ApJ, 636, L145
- Livingston & Wallace (1991) Livingston, W., & Wallace, L. 1991, NSO Technical Report, Tucson: National Solar Observatory, National Optical Astronomy Observatory, 1991
- Leinert et al. (2001) Leinert, C., Beck, T. L., Ligori, S., Simon, M., Woitas, J., & Howell, R. R. 2001, A&A, 369, 215
- Leinert & Haas (1989) Leinert, C., & Haas, M. 1989, ApJ, 342, L39
- Luhman & Rieke (1999) Luhman, K. L., & Rieke, G. H. 1999, ApJ, 525, 440
- Luhman et al. (1998) Luhman, K. L., Rieke, G. H., Lada, C. J., & Lada, E. A. 1998, ApJ, 508, 347
- McLean et al. (1998) McLean, I. S. et al. 1998, Proc. SPIE, 3354, 566
- Markwick et al. (2002) Markwick, A. J., Ilgner, M., Millar, T. J., & Henning, T. 2002, A&A, 385, 632
- Massey (1997) Massey, P. 1997 A User’s Guide to CCD reductions with IRAF, National Optical Astronomy Observatory
- Massey et al. (1992) Massey, P., Valdes, F., Barnes, J. 1992 A Users’s Guide to Reducing Slit Spectra with IRAF, National Optical Astronomy Observatory
- Menard et al. (1993) Menard, F., Monin, J.-L., Angelucci, F., & Rouan, D. 1993, ApJ, 414, L117
- Movsessian & Magakian (1999) Movsessian, T. A., & Magakian, T. Y. 1999, A&A, 347, 266
- Muzerolle et al. (1998a) Muzerolle, J., Calvet, N., & Hartmann, L. 1998a, ApJ, 492, 743
- Muzerolle et al. (1998b) Muzerolle, J., Hartmann, L., & Calvet, N. 1998b, AJ, 116, 2965
- Najita et al. (1996) Najita, J., Carr, J. S., Glassgold, A. E., Shu, F. H., & Tokunaga, A. T. 1996, ApJ, 462, 919
- Reipurth et al. (2004) Reipurth, B., Rodríguez, L. F., Anglada, G., & Bally, J. 2004, AJ, 127, 1736
- Rothman et al. (1998) Rothman, L. S., et al. 1998, Journal of Quantitative Spectroscopy and Radiative Transfer, 60, 665
- Royer et al. (2002) Royer, F., Grenier, S., Baylac, M.-O., Gómez, A. E., & Zorec, J. 2002, A&A, 393, 897
- Scoville et al. (1983) Scoville, N., Kleinmann, S. G., Hall, D. N. B., & Ridgway, S. T. 1983, ApJ, 275, 201
- Siess et al. (2000) Siess, L., Dufour, E., & Forestini, M. 2000, A&A, 358, 593
- Sneden (1973) Sneden, C. 1973 PhD Thesis, University of Texas at Austin
- Stapelfeldt et al. (1998) Stapelfeldt, K. R., Krist, J. E., Menard, F., Bouvier, J., Padgett, D. L., & Burrows, C. J. 1998, ApJ, 502, L65
- Stojimirović et al. (2007) Stojimirović, I., Narayanan, G., & Snell, R. L. 2007, ApJ, 660, 418
- Strom et al. (1986) Strom, K. M., Strom, S. E., Wolff, S. C., Morgan, J., & Wenz, M. 1986, ApJS, 62, 39
- Terebey et al. (1984) Terebey, S., Shu, F. H., & Cassen, P. 1984, ApJ, 286, 529
- Van Cleve et al. (1994) Van Cleve, J. E., Hayward, T. L., Miles, J. W., Gull, G. E., Schoenwald, J., & Houck, J. R. 1994, Ap&SS, 212, 231
- White & Hillenbrand (2004) White, R. J., & Hillenbrand, L. A. 2004, ApJ, 616, 998
- Whitney et al. (1997) Whitney, B. A., Kenyon, S. J., & Gomez, M. 1997, ApJ, 485, 703
- Whittet et al. (1988) Whittet, D. C. B., Bode, M. F., Longmore, A. J., Adamson, A. J., McFadzean, A. D., Aitken, D. K., & Roche, P. F. 1988, MNRAS, 233, 321
| Order/Wavelength | Lines(s) | absorption | emission | notes | |
|---|---|---|---|---|---|
| () | |||||
| Order 37, 2.03 | S(2) 1-0 H2 | no | yes | 10.3 | line centroid |
| Order 36, 2.11 | Mg I, Al I | yes | no | … | radial velocity poorly constrained in this region |
| Order 35, 2.16 | Br | no | yes | 3.7 | line centroid |
| Order 34, 2.21 | Na I, Ti I, Fe I | yes | no | 9.11.3 | mean value of 7 lines |
| Order 34, 2.22 | S(0) 1-0 H2 | no | yes | 8.5 | emission extends south of the star |
| Order 33, 2.29 | Fe I, Ca I, Ti I | yes | no | 10.01.3 | mean value of 4 lines |
| Order 33, 2.29 | =2-0 CO | yes | yes | … | radial velocity poorly constrained in this region |
| Order 25, 3.07 | HCN, C2H2 | no | no | … |
| Order/Wavelength | Lines(s) | absorption | emission | notes | |
|---|---|---|---|---|---|
| () | |||||
| Order 37, 2.03 | S(2) 1-0 H2 | no | yes | 5.9 | line centroid |
| Order 36, 2.11 | Mg I, Al I | no | no | … | |
| Order 35, 2.16 | Br | no | yes | -17.0 | line centroid |
| Order 34, 2.21 | Na I, Si I, Sc I | yes | yes | -4.54.0 | velocity fit to Na absorption cores |
| Order 34, 2.22 | S(0) 1-0 H2 | no | yes | 8.5 | line centroid |
| Order 33, 2.29 | =2-0 CO | yes | yes | -4.54.0 | velocity fit to CO absorption core |
| Order 25, 3.07 | HCN, C2H2 | yes | no | 8.70.3 | line centroid |
| Line ID | % Transmission | Equivalent Width | |||
|---|---|---|---|---|---|
| µm | µm | Å | |||
| P11 | 3.0508033 | 3.0511622 | 8.73 | 0.75 | 0.12 |
| P12 | 3.0537670 | … | … | 0.35 | 0.21 |
| P13 | 3.0567549 | … | … | 0.20 | 0.12 |
| P14 | 3.0597676 | 3.0601268 | 8.65 | 0.98 | 0.14 |
| P15 | 3.0628043 | 3.0631660 | 8.86 | 0.70 | 0.15 |
| P16 | 3.0658660 | 3.0662214 | 8.21 | 0.85 | 0.19 |
| P17 | 3.0689521 | … | … | 0.25 | 0.24 |
| P18 | 3.0720633 | … | … | 0.45 | 0.15 |
| P19 | 3.0751988 | … | … | 0.65 | 0.20 |
| P20 | 3.0783594 | 3.0787095 | 7.56 | 0.95 | 0.14 |
| P11,14,15,16 | 8.7 |
| System | Component | Reference | |
|---|---|---|---|
| GV Tau | Cloud | 6.2 0.5 | from Covey et al. (2006) |
| Envelope | 7.0 0.5 | Hogerheijde et al. (1998) | |
| GV Tau S | Star | 3.1 3.8 | White & Hillenbrand (2004) |
| -6.2 1.5 | Covey et al. (2006) | ||
| 9.4 1.7 | this paper | ||
| GV Tau N | Star | -4.5 4.0 | this paper |
| HCN warm abs | 8.7 0.3 | this paper | |
| IRS46 | Envelope | 4.4 | Lahuis et al. (2006) |
| CO, HCN warm abs | -20 | Lahuis et al. (2006) | |
| Star | unknown |
![[Uncaptioned image]](/html/0805.2426/assets/x2.png)
Fig. 1b. — Continued.
![[Uncaptioned image]](/html/0805.2426/assets/x3.png)
Fig. 1c. — Continued.
![[Uncaptioned image]](/html/0805.2426/assets/x4.png)
Fig. 1d. — Continued.
![[Uncaptioned image]](/html/0805.2426/assets/x5.png)
Fig. 1e. — Continued.