Characterizing the Diversity of Dynamics in Complex Networks Without Border Effects
Abstract
The importance of structured, complex connectivity patterns found in several real-world systems is to a great extent related to their respective effects in constraining and even defining the respective dynamics. Yet, while complex networks have been comprehensively investigated along the last decade in terms of their topological measurements, relatively less attention has been focused on the characterization of the respective dynamics. Introduced recently, the diversity entropy of complex systems can provide valuable information about the respective possible unfolding of dynamics. In the case of self-avoiding random walks, the situation assumed here, the diversity measurement allows one to quantify in how many different places an agent may effectively arrive after a given number of steps from its initial activity. Because this measurement is highly affected by border effects frequently found as a consequence of network sampling, it becomes critical to devise means for sound estimation of the diversity without being affected by this type of artifacts. We describe such an algorithm and illustrate its potential with respect to the characterization of the self-avoiding random walk dynamics in two real-world networks, namely bone canals and air transportation.
1 INTRODUCTION
Complex networks (e.g. [1, 2, 3]) are natural candidates for representing, characterizing and modeling a large range of natural and artificial systems, especially those exhibiting a particularly intricate (‘complex’) organization and dynamics. Indeed, several recent related works have focused the relationship between the structure and dynamics of such complex systems (e.g. [1, 4, 5, 6]). One particularly important feature to be investigated regards the time evolution of particular types of dynamics, such as traditional random walks (e.g. [6, 7]), Ising interaction (e.g. [8, 9, 10]), integration-and-fire (e.g. [11]), associative memory (e.g. [12, 13]) among many other possibilities. Because of their more purposeful dynamics and relative simplicity, self-avoiding walks stand out as a particularly interesting type of non-linear dynamics in networks (e.g. [14, 15]). Instead of choosing next moves with uniform probability, as in traditional random walks, self-avoiding walks avoid repeating edges or nodes, therefore implying in more purposive and effective displacements away from the starting node. Moreover, while traditional random walks are associated to walks, which can be infinite, self-avoiding walks are intrinsically related to paths, which are always of finite size in finite networks, and therefore more meaningful.
Given a specific dynamics involving a moving agent, such as in self-avoiding walks, it is interesting to investigate the diversity of destinations of several walks after starting at specific nodes. The importance of such a study stems from the fact that diversity is immediately related to the influence of the starting nodes on the other nodes in the network (e.g. diseases can be more effectively propagated from specific nodes). One immediate possible means to quantify the diversity of destinations after steps along a walk which started at a given node would be to identify how many nodes can be reached at that step by an infinite number of walks initiating at . Though this can be easily determined by identifying the th hierarchical (or concentric) neighborhood (e.g. [16]) of node , such a measurement would provide but a biased indication of the diversity of the walk at that step. The problem with this approach is that it does not consider that the probabilities of getting to the reachable nodes after steps are typically not uniform because of the heterogeneity of the network connectivity between the source and destination nodes. Thus, it is possible that out of several nodes reachable after steps, several of them may be accessed only very sporadically, contributing little effectively to the overall diversity, while others are reached frequently. A more significant means to quantify the diversity of destinations along the evolution of several types of dynamics in complex networks was reported recently [17], consisting in the diversity entropy of a node after steps. By calculating the entropy of the transition probabilities to the reachable nodes, a much more effective quantification of the diversity of the dynamics can be achieved which also takes into account the uniformity in which the destination nodes are reached.
Despite the potential of the diversity entropy for revealing important aspects of the evolution of the dynamics in complex networks, it is intrinsically plagued by border effects in incomplete networks. For instance, a transportation network is often constrained to a specific region of our planet or country, implying in biased calculation of the diversity entropy at the border nodes located along the regions where the network was sliced. The present work reports an effective means to avoid such border effects. It is based on an additional important property of the diversity entropy in revealing the borders of the network. More specifically, nodes with low diversity entropy can be classified as the border of the network. Therefore, by performing some relatively simple operations described in this article, it becomes possible to identify a kernel of the original network whose nodes are unaffected by the borders. It is important to observe that, typically, one will only want to avoid the borders implied by the selection of a specific part of the network. Contrariwise, in the case of a complete network, its borders are intrinsically important parts which should be included in the diversity analysis. We illustrate this procedure by taking into account two real-world examples: a bone network which was sliced from a whole pig bone [18], so that its border nodes are known a priori, and the US air transportation network, whose borders are not clearly identifiable. In the latter case, we consider the diversity entropy values in order to identify the borders. In both cases, the dilation of the borders define a buffer area which allows the diversity (and other measurements) to be calculated for a set of kernel nodes withouth being affected by the borders.
This work starts by presenting the basic structural and dynamical properties of complex networks and follows by describing the proposed methodology and illustrating it with respect to two real-world networks.
2 Structural and Dynamical Properties of Complex Networks
A complex network is composed by a set of nodes and links connecting such nodes. In the case of an unweighted network, the links (edges) between the nodes can be represented by a matrix , named adjacency matrix, so as that the existence of a link between the nodes and implies , with being otherwise imposed. If two nodes are connected by an edge, they are said to be adjacent nodes. If two edges are associated to the same node, the are called adjacent edges. A sequence of adjacent edges defines a walk over the network. A path is a special type of walk, where no edges or nodes are repeated along the walk. The length of a walk is defined as the number of the edges of the walk.
An interest way to study the dynamical properties of a network is by considering a moving agent “walking” along its nodes, while guided by some chosen dynamics. Observe that the moving agent defines a walk over the network. When the self-avoiding random walk dynamics is chosen, the agent departs from the starting node and choose one of its neighbors with uniform probability, defining paths as they progress. The others steps are performed in the same manner, but following the restriction that none of the previously visited nodes or edges cannot be revisited. The moving agent stops after it reaches a pre-defined number of steps or when it can proceed no longer (i.e, it reaches a terminal node of the network or lacks unvisited neighbors to proceed).
Let be the probability to reach the node after departing from the node through a self-avoiding random walk of length . This transition probability can be obtained by a determinist algorithm [15] or by a stochastic method [17]. The estimation of the transition probability of the nodes allows to derive a set of complementary measurements quantifying several aspects of how a node can be reached and how it can reach other nodes of the network, allowing a comprehensive characterization of the network dynamics [15]. In the present work, the diversity entropy [17, 19] is specifically considered, though the methodology can be easily adapted to other dynamical measurements. This measurement quantifies the diversity of the dynamics of the moving agent, taking into account the probabilities of reaching different nodes after steps along the walk. So, a high diversity entropy value obtained for a given starting node after steps indicates that that node can effectively access several nodes at that stage of the walk. It is important to observe that the diversity entropy provides a more informative measurement than would be obtained by considering only the number of distinct nodes accessible after steps. This is so because the diversity entropy considers the dispersion of the transition probabilities from the starting node to each of the reachable nodes after steps along the walks.
Given a network with nodes, the diversity entropy of a node after steps is given as [17]:
| (1) |
Observe that the maximum diversity entropy, equal to one, is reached when all other nodes of the network can be reached with equal probability () from node . The minimum value of the diversity entropy (equal to zero) is obtained when no or only one node is reachable from the starting node .
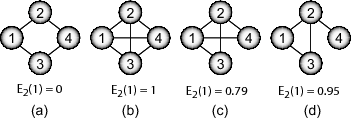
In order to clarify further the concept of diversity, four different situations are presented in figure 1. In all these cases, we consider the diversity entropy for steps after the moving agents leave from the starting node . In the first network, shown in (a), only node is reachable after a self-avoiding random walk of length two, resulting in a null diversity. Different situations are implied by the remainder examples (b-d). In these cases, the nodes , and are reached after two steps from node . For the network depicted in (b), all nodes are reached with equal probability, resulting in a maximum diversity (). The case (c) is similar to (b), except that the link between the nodes and was removed, resulting in a significant decrease on the diversity (). In the case (d), not only the link between nodes and , but also the link between nodes and were removed. In this case, an interesting result is observed: the decrease in the diversity to was not so high as in the case (c). Note that, although the case (c) has one more connection than (d), the respective diversity is lower because its additional connection enhances the access to node , unbalancing the network and diminishing the diversity of access from node for (observe that , while ). When comparing cases (b) and (d), it is possible to note that, for both cases, no strong preference of access to a specific node is found, resulting in a higher value of the entropy diversity. Indeed, the main difference between these two cases is that the probabilities of access to the nodes , and for the case (b) are equal, i.e, , while in (d), .
3 Diversity-Based Border and Kernel Nodes Detection
We developed a methodology for avoidance of border effects that involves the detection of the nodes belonging to the border as well as the identification of the kernel nodes, i.e. nodes whose specific properties are not influenced by the border nodes. Particularly, the main purpose of our current work is to find the nodes whose diversity entropy is not affected by border effects, so that they can be effectively quantified in terms of that measurement.
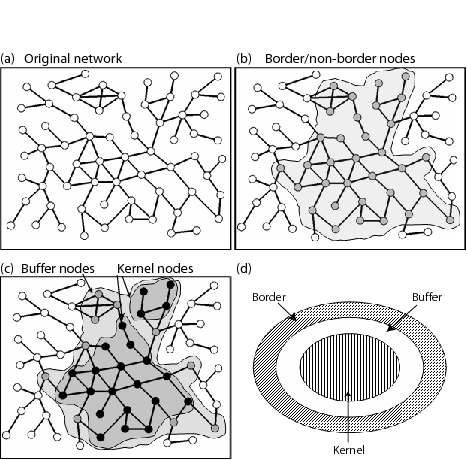
The search for these nodes involves the following two main steps: (i) find the border nodes in the original network; (ii) find the kernel nodes and take the measurements there. It should be kept in mind that in the cases where the border nodes are known a-priori, our method involves only the second step. Both steps are illustrated in figure 2 and described in more detail below.
(i) Finding the border nodes: An interesting property of the diversity entropy is that the nodes with low diversity values tend to be located at the borders of the network, in contrast with the nodes with high diversity, which defines the most central part of the network. The main idea underling this property is that the self-avoids walks departing from the nodes near the border have not many choices except accessing internal nodes. As a consequence, the probability of accessing the internal nodes becomes higher than the surrounding border nodes, unbalancing the access distribution and reducing the node diversity. So, it becomes possible to identify the border nodes in terms of the respective diversity entropy values.
Based on this property, the border nodes of the network can be identified by performing a threshold on the diversity value at a specific step, or based on the mean value considering all the steps. Figure 2(b) illustrates such a procedure. Note that this approach is more robust in detecting the border nodes than the techniques based just on the geographical location of the nodes (e.g., near the surface or at the periphery), as it considers simultaneously the structural and dynamical properties of the network, provided by the diversity entropy. In addition, the present approach is particularly useful when applied to non-geographical networks, where the identification of the network border is not possible.
(ii) Finding the kernel nodes: This step consists in selecting nodes of the network based on their topological distance to the border nodes, i.e., its kernel nodes. A node is considered a kernel node if its shortest path to any of the border nodes are larger than some pre-defined threshold value. The detection of these nodes can be performed by dilating all the border nodes — the dilation of a subnetwork (e.g. [20]) involves incorporating all the immediate neighbors of that subnetwork — and selecting the nodes not reached by such a dilatation. Figure 2(c) shows, in black, the kernel nodes for the considered example. Overall, note that this border elimination approach is particularly efficient, as it guarantees a safety distance between the border nodes and the kernel nodes. The nodes lying in this intermediary region, i.e., between the border nodes and the kernel nodes, are called henceforth buffer nodes (gray nodes in Figure 2(c)). Note that the above procedure guarantees that the application of diversity entropy to the analysis of finite networks will be unaffected by border effects.
In order to further illustrate the concepts of the proposed methodology, Figure 2(d) shows a diagram that represents the relationship between border, buffer and kernel nodes.
4 Applications
In order to illustrate the efficiency and robustness of our proposed method, we applied the border detection and diversity entropy analysis to two real-world networks of different types. The first network considered is the bone vascular complex network, a strictly geographical network, whose border nodes are know a priori. The second example studied is the US air lines network, which is a small-world network whose border nodes were not known and needed to be estimated.
4.1 Bone vascular complex network
The first example studied in this work was a bone network, responsible for conveying blood vessels through the tibia bone matrix. The structural and dynamical aspects of this network are important to understand the blood irrigation of the bone as well as in helping the development of clinical procedures.
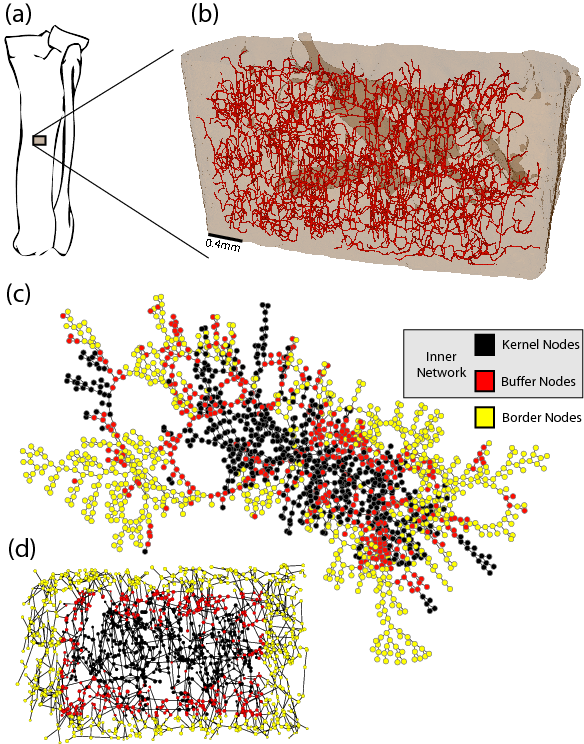
In order to obtain the bone network, a CT sample of a right tibia was obtained from a pig at 6 weeks of age. At six weeks, the skeleton is still in a development stage because a mature structure is obtained only after 100 weeks approximately. The bone specimen of 4 x 4 x 4 mm was extracted from the posterior cortex at diaphysis level, as showed in the figure 3(a) (for more details about the dataset obtention please refer to [18]).
Next, the bone specimen was scanned into an image dataset which was subsequently used to obtain the three-dimensional representation of the bone shown in figure 3(b). In this figure, the gray points corresponds to the bounding surface of the cortical portion. Our main focus of interest in this paper are the canals represented by the lines in figure 3(b), which are the pores within the cortex. Is important observe that the canals are not represented with their real thickness. The whole canal structure was obtained after the image was submitted to a thinning algorithm in order to reduce the redundance of the structure. Our next step was to map the canal structure into a graph. In order to do so, we developed an algorithm that proceeds through the thinned canals and marks the bifurcation points. These bifurcation points were mapped as the nodes in the graph representation, while the canals were considered as the edges. A topological view of the final graph can be seen in Figure 3(c) and the respective 2D projection of the three-dimensional network is shown in figure 3(d). The obtained network has 1800 nodes and 2131 edges, with a mean degree of 2.4. This value is in agreement with that obtained in a previous study with a femur of an adult cat [21]. It should be noticed that though other papers have used the 3D techniques and thinning procedure to study the internal organization of the trabecular and cortical bones [22, 23, 24, 25], very few articles have used complex networks concepts in order to study these systems [21].
A problem with geographical networks is that very often we do not have information about the whole system, but only some parts sliced from the whole. In these cases, non-local measurements suffer influences of the border due to finite size effects. Such effects are verified in the bone network because it corresponds to only a portion of the original bone. Because the portion of bone under study was sliced from the original structure, we know which of the nodes belong to the border (i.e. they are the nodes adjacent to the sliced surfaces). Therefore, it is important to identify the set of nodes unaffected by the borders of the network, in order to constrain the respective analysis at those nodes.
4.2 US air lines
The second network considered in this work is the US traffic air system. In this case, the nodes of network represent the airports and two nodes are connected if there is a flight between them. We study a unweigthed version of the original network available at Pajek website (http://vlado.fmf.uni-lj.si/pub/networks/data/default.htm). The network has 332 nodes and 2126 edges given a average degree equal 12.8. Although the nodes has a very well established Euclidian coordinates, as the bone network, the US airline network appear a small-world behavior [26] due to non local connections capable to link very distant nodes. It is particularly difficult to identify, a priori, the border nodes in this network because they do not correspond necessarily to the airports at the geographical border (such airports can still serve many flights).
5 Results
Considering the bone vascular network and its respective complex network shown in Figure 3, the diversity entropy of each node was estimated by using the deterministic and fully accurate algorithm outlined in [15]. Figure 3(c-d) shows, in white (yellow), the selected border nodes of the bone network identified by considering a small region near the lateral surfaces of the bone. The buffer nodes are shown in gray (red) and the kernel nodes in black. In this analysis, the kernel nodes are at a minimum of three edges of distance from the border nodes.
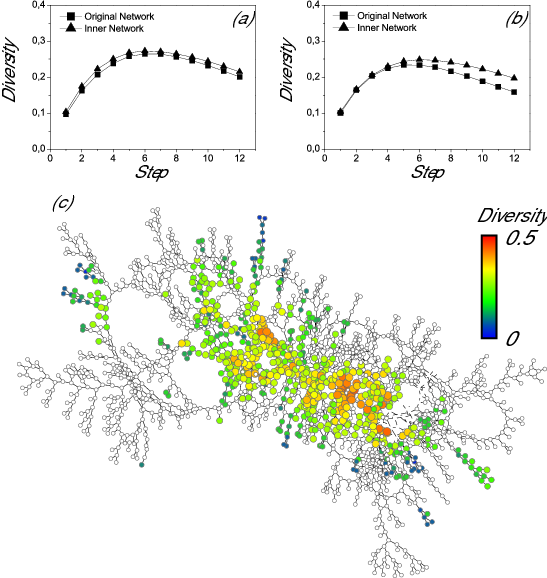
In order to show that the selected kernel nodes are not influenced by the border nodes, we defined a new network, named as inner network, which is formed only by the buffer and the kernel nodes of the original network (see figure 3c). The diversity entropy of the inner network was computed and compared with the original network. The graph presented in Figure 4(a) shows the mean diversity entropy considering only the kernel nodes, for both networks and for to (the maximum number of steps considered in our present analysis). It is clear from this graph that the kernel nodes are not affected by the border nodes, as no considerable differences can be detected in their diversity mean, even for high values of . Contrariwise, when all the nodes of both networks are considered, without any buffer region, the differences in the mean diversity are substantial, as illustrated in figure 4(b), reflecting intense border effects.
The diversity values for each kernel node considering are shown in figure 4(c). Observe the cluster of nodes with high diversity values in a specific region of the network. This region probably corresponds to distribution center (for blood and other substances), as its provides access to a considerable number of nodes of the network in a uniform fashion, while the nodes with low diversity enhances the access to a smaller number of nodes of the network and can be considered as a destination region.
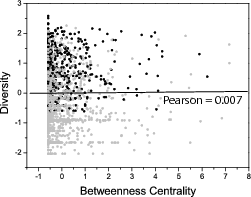
Also, in order to show that the selected kernel nodes are not necessarily the most central ones (in the sense of betweeness centrality – the number of times that a node is crossed by shortest paths between all the other nodes [27]), a scatterplot is depicted in Figure 5 showing the diversity entropy against the betweenness centrality for all nodes. It is clear from this result that the diversity entropy and betweeness centrality are almost completely uncorrelated (Pearson = 0.007), confirming that the diversity entropy provides important complementary information about the structure and dynamics of the analyzed network.
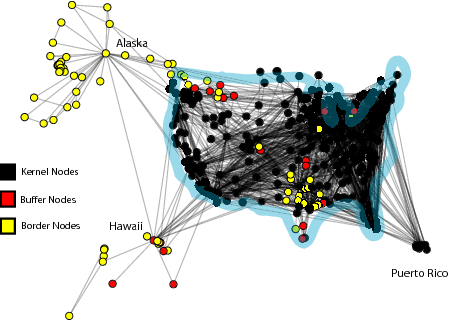
The results of the application of the proposed methodology in the analysis of the diversity of the US air lines network is shown in Fig. 6. In this figure, the border nodes, shown in white (yellow), were obtained considering nodes whose diversity were lower than 90% of the maximum diversity value for . The detection of the buffer nodes was slightly modified. As the US air lines network is a small world network, there are great chances that the dilatations of the border nodes reach the hubs of the network. As a consequence, the hubs of this network would hardly be considered as kernel nodes. In order to avoid such an effect, the following restriction was included in the dilation process: the incorporation of a node occurs only if a percentage of the neighbors of the respective node are border nodes.
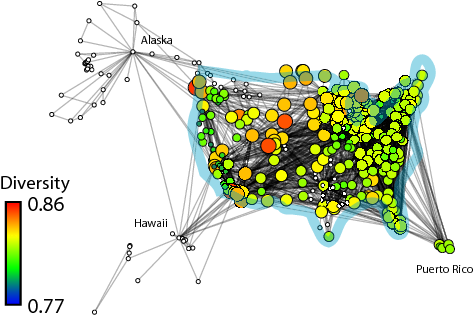
In the case of the US air lines network, a node was included in the dilatation if at least 30% of its neighbors were border nodes and if its shortest path to any of the border node had a maximum distance of three edges. The result of application of this procedure is shown in Figure 6, where the buffer nodes are shown in gray (red) and the kernel nodes are shown in black. In addition, the diversity entropy of the kernel nodes for is shown in Figure 7.
An interesting result is observed in the distribution of the kernel nodes. All of them are situated at the main territory of the US, except for the airports located at Puerto Rico. This means that the periphery of this network, i.e., the nodes that was classified as border or buffer, are composed mainly by the nodes representing the insular territories of US and the state of Alaska. The Puerto Rican airports were classified as kernel nodes because they serve a large quantity of routes. The diversity entropy values obtained for the kernel nodes revealed that American airports at the west coast tend to allow more effective and uniform access to a larger number of airports than those at the east coast.
6 Concluding Remarks
Frequently, a complex networks being investigated represents only a sliced and/or sampled portion of a larger structure which is not available or which would otherwise be too large for the analysis. Such networks necessarily imply the existence of border nodes, i.e. those nodes connecting the analysed structure to the remainder of the larger original structure. Because such border nodes imply in strong bias on several measurements of the topology of the networks under analysis, they need to be identified and avoided. Indeed, in several cases it is not only the border nodes which need to be avoided, but also their neighbors, which we have called buffer nodes. Two situations arise in practice: the border nodes are already known or have to be identified. The present work reported an objective and sound approach for identification of border nodes by using a recently introduced measurement, namely the diversity entropy [17]. In addition, we also show how the effects of such border nodes on the calculation of the diversity entropy measurement can be minimized by considering a buffer zone obtained by dilating the border nodes.
Once the border nodes have been identified, the kernel nodes are found by considering the topological distance from the border nodes. The kernel nodes are then considered for the measurements and analyses of the network properties. The effectiveness of the suggested methodology was corroborated with respect to the diversity entropy analysis of a network of canals extracted from a sliced portion of bone. Because of technical limitations, it is virtually impossible to obtain the structure corresponding to the whole original bone (tibia), so that samples have to be sliced from it, implying in severe border effects. The obtained results indicated a large dispersion of diversity entropy values amongst the nodes in the considered network, revealing that different nodes have distinct topological and dynamical interactions with the other portions of the bone canals system, with the most central nodes (i.e. those with higher diversity entropy) being capable of effectively reaching a larger number of other nodes. In order to illustrate the identification of border nodes, we considered the US air transportation system. The identification of the border nodes involved the calculation of the diversity entropy for all the nodes in the given network and taking the nodes with smaller diversity entropy values as borders. The consideration of the buffer zone then allowed the calculation of meaningful diversity entropies for the kernel nodes.
It is important to keep in mind that the reported framework is by no means limited to geographical networks, being immediately applicable to any type of network. In addition, the method can also be applied for the elimination of border effects while calculating several other topological measurements.
Acknowledgments: Matheus P. Viana thanks FAPESP (07/50882-9) for financial support. B. A. N. Travençolo is grateful to FAPESP (07/02938-5) for financial support. Luciano da F. Costa thanks FAPESP (05/00587-5) and CNPq (301303/06-1) for sponsorship. Esther Tanck thanks NWO-STW (NPG.6778) for financial support.
References
References
- [1] R. Albert and A.-L. Barabási. Statistical mechanics of complex networks. Rev. Mod. Phys., 74:47, 2002.
- [2] M. E. J. Newman. The structure and function of complex networks. SIAM Review, 45:167, 2003.
- [3] L. da F. Costa, F. A. Rodrigues, G. Travieso, and P. R. Villas Boas. Characterization of complex networks: A survey of measurements. Advances In Physics, 56:167, 2007.
- [4] S. N. Dorogovtsev and J. F. F. Mendes. Evolution of networks. Advances in Physics, 51(4):1079–1187, 2002.
- [5] S. Boccaletti, V. Latora, Y. Moreno, M. Chavez, and D. U. Hwang. Complex networks : Structure and dynamics. Physics Reports, 424(4-5):175–308, Fervier 2006.
- [6] J. D. Noh and H. Rieger. Random walks on complex networks. Physical Review Letters, 92:118701, 2004.
- [7] L. da F. Costa. Exploring complex networks through random walks. Physical Review E, 75:016102, 2007.
- [8] S. N. Dorogovtsev, A. V. Goltsev, and J. F. F. Mendes. Ising model on networks with an arbitrary distribution of connections. Physical Review E, 66:016104, 2002.
- [9] C. P. Herrero. Ising model in small-world networks. Physical Review E, 65(6):066110–066115, 2002.
- [10] G. Bianconi. Mean field solution of the ising model on a barabási-albert network. Phys. Lett. A, 303(2):166–168, 2002.
- [11] L. da F. Costa. Transient and equilibrium synchronization in complex neuronal networks, 2008.
- [12] D. Stauffer, A. Aharony, L. L. da F. Costa, and J. Adler. Efficient hopfield pattern recognition on a scale-free neural network. European Physical Journal B, 32:395–399, 2003.
- [13] L. da F. Costa and D. Stauffer. Associative recall in non-randomly diluted neuronal networks. Physica A, 330:37–45, 2003.
- [14] W. Liu, W.-Y. Xiong, and J.-Y. Zhu. One-dimensional ising model built on small-world networks: competing dynamics. Physical Review E, 71:056123, 2005.
- [15] L. da F. Costa. Superedges: Connecting structure and dynamics in complex networks, 2008.
- [16] L. da F. Costa. The hierarchical backbone of complex networks. Phys. Rev. Lett., 93:098702, 2004.
- [17] L. da F. Costa. On the diversity of non-linear transient dynamics in several types of complex networks, 2008.
- [18] E. Tanck, G. Hannink, R. Ruimerman, P. Buma, E. H. Burger, and R. Huiskes. Cortical bone development under the growth plate is regulated by mechanical load transfer. Journal of Anatomy, 208:73–79, 2006.
- [19] L. da F. Costa. Inward and outward node accessibility in complex networks as revealed by non-linear dynamics, 2008.
- [20] L. da F. Costa and L. E. C. da Rocha. A generalized approach to complex networks. European Physical Journal B, 50:237, 2006.
- [21] L. da F. Costa, M. P. Viana, and M. E. Beletti. The complex channel networks of bone structure. Applied Physics Letters, 88:033903, 2006.
- [22] J. Petersson, T. Brismar, Ö. Smedby, J. Petersson, T. Brismar, and Ö. Smedby. Medical Image Computing and Computer-Assisted Intervention, volume 4191, chapter Analysis of Skeletal Microstructure with Clinical Multislice CT. Springer Berlin / Heidelberg, 2003.
- [23] D. M. L. Cooper, A. L. Turinsky, C. W. Sensen, and B. Hallgrímsson. Quantitative 3d analysis of the canal network in cortical bone by micro-computed tomography. The Anatomical Record, 274B:169–179, 2003.
- [24] W. Xie, R. P. Thompson, and R. Perucchio. A topology-preserving parallel 3d thinning algorithm for extracting the curve skeleton. Pattern Recognition, 36:1529–1544, 2003.
- [25] P. K. Saha, B. R. Gomberg, and F. W. Wehrli. Three-dimensional digital topological characterization of cancellous bone architecture. International Journal of Imaging Systems and Technology, 11:81–90, 2000.
- [26] A.-L. Barabási. The architecture of complexity. IEEE Control Systems, 27(4):33–42, 2007.
- [27] U. Brandes. A faster algorithm for betweenness centrality. Journal of Mathematical Sociology, 25:163–177, 2001.