Identification of Bottom Contribution in Non-photonic Electron Spectra and at RHIC
Abstract
We present a study on the spectra for heavy flavor (charm and bottom) decayed electrons in 200 p+p collisions and provide the relative contributions of charm and bottom hadrons from the PYTHIA calculations. The results suggest that the crossing point of the electron spectra from charm and bottom decays is above 7 and bottom contribution is not dominant for electron . The upper limit of the relative cross section ratio is reported as . We also compare the distribution from simulation to the experimental data in 200 Au+Au collisions and estimate the possible charm .
1 Introduction
Due to the absence of the measurement of B-mesons and precise measurement of D-mesons, it is difficult to separate bottom and charm contributions experimentally in current non-photonic electron measurements for both spectra and elliptic flow . As discussed previously, the suppression behavior of heavy quarks is quite different from light quarks due to the ”dead cone” effect [1], and this is especially true for the bottom quark. Even when the elastic energy loss is included, the bottom quark still loses much less energy. The bottom contribution may reduce the energy loss of non-photonic electrons from heavy flavor decays. But recent measurements show that the suppression of the non-photonic electron is as large as light hadrons [12]. Both the theoretical result with charm energy loss only and the theoretical calculations with charm+bottom energy loss by assuming large or counting elastic energy loss can describe the data within errors [2, 3, 4, 5, 6].
Recently, PHENIX has measured the non-photonic electron [7]. The observed large elliptic flow of the non-photonic electron may indicate strong coupling of heavy quarks with medium. There are many theoretical calculations for the non-photonic electron , such as charm thermal+flow model [8], A multi-phase transition (AMPT) model assume cross section =10 mb [9], resonance states of D-/B- mesons [10], etc. The comparison with theories also showes that both the model results with charm only and the results with charm+bottom have good agreement with data within errors.
Thus, the puzzle of the bottom contributions in non-photonic electron spectra and still remains. We present the following method to estimate the bottom contributions and to study the possible charm .
2 Fit to non-photonic electron spectrum and relative cross section ratio
The non-photonic electron spectrum up to 10 has been measured by STAR experiment in 200 p+p collisions. The idea is that we use the sum of electron spectra from both charm and bottom decays in PYTHIA model [11] to fit the STAR p+p data [12] to extract the fraction of the bottom contribution. Since the D-mesons and their decay electrons spectra from default PYTHIA parameters are soft [13], a modified Peterson Fragment Function (FF) and the high tuned parameter are used to make spectra harder to be comparable with the form factor decays [14].
Table 1 lists the parameter initialization for PYTHIA 6.131:
| Parameter | Value |
|---|---|
| MSEL | 4 (charm), 5 (bottom) |
| quark mass | , () |
| parton dist. function | CTEQ5L |
| scale | 4 |
| K factor | 3.5 |
| 1.5 | |
| Peterson Frag. function | |
| high tuned PARP(67) | 4 |
Fig. 1 (a) shows the distributions of the heavy flavor hadrons and their decay electrons from PYTHIA with above parameters. The D-meson spectrum, shown as the hatched band, is normalized to
| (1) |
where measured in d+Au collisions [15]. in d+Au collisions. [16]. factor stands for fraction in total charmed hadrons, the fragmentation ratio [17]. All these normalization errors are propagated into the uncertainty band of the D-meson spectrum. The curve in this band is the lower limit of the D-meson spectrum in our simulation. Correspondingly, its decay electron spectrum is shown as the solid band. The non-photonic electron spectrum measured in p+p collisions at STAR [12] is shown as the open squares. The decay electron band alone can describe the data, indicating that the contribution of electrons from bottom decay could be very small. In order to estimate the upper limit of bottom contribution, we use the lower limit of the decay electron spectrum, shown as the open circles. B-meson spectrum (solid curve) and its decay electron spectrum (open triangles) are normalized by varying the ratio of . The summed spectrum (solid circles) by combining the lower limit of and is used to fit STAR data in p+p collisions, and then the upper limit of contribution will be extracted.
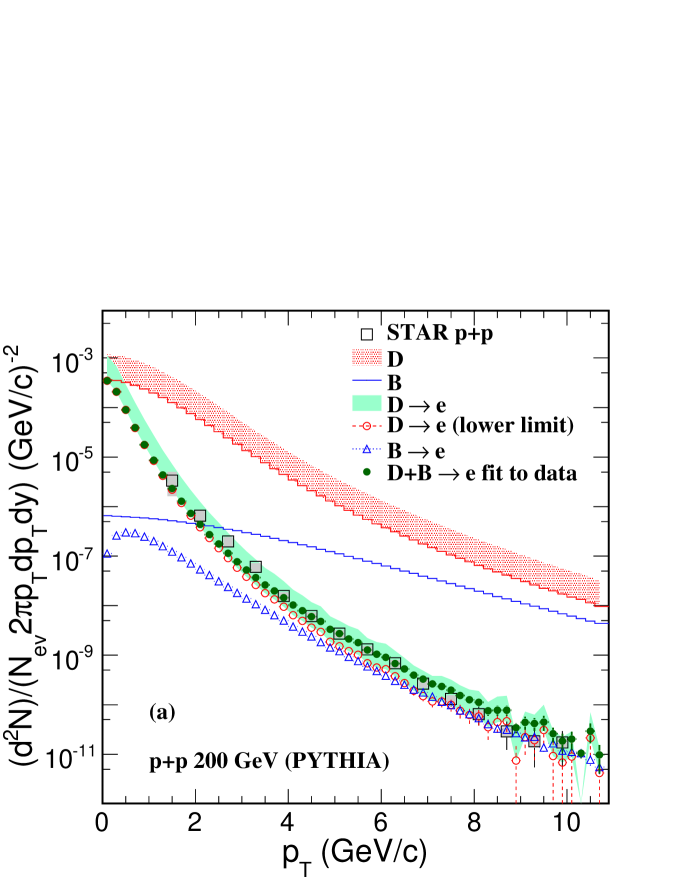
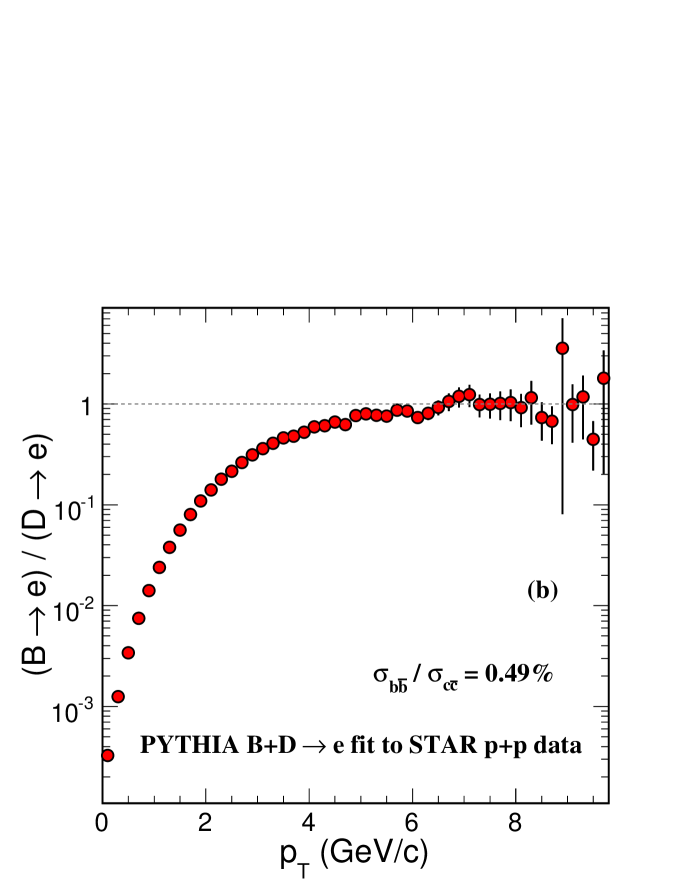
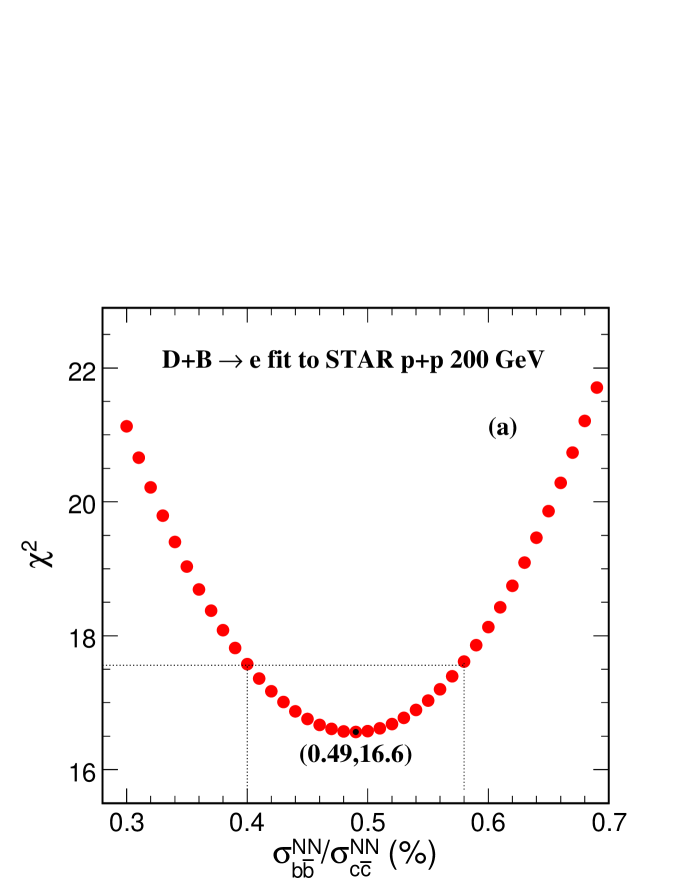
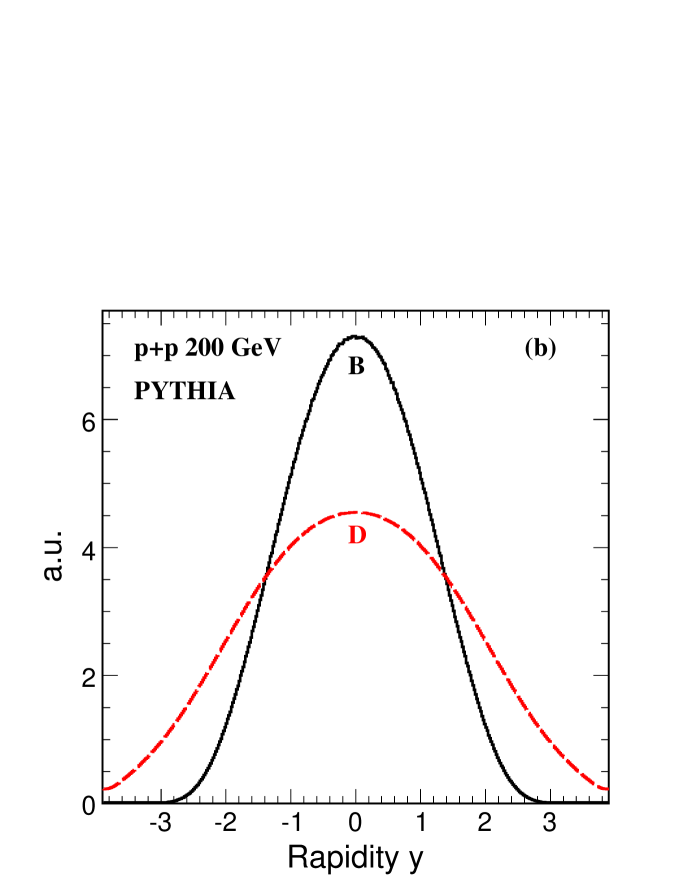
Fig. 2 (a) shows the fit as a function of the unique variable . The best fit with a minimum gives the upper limit of the total cross section ratio as . The first term of the errors is calculated from . The second term is from the 15% normalization error of the converted to total cross sections due to the uncertainties of the model dependent rapidity distributions [16]. Fig. 2 (b) shows the B-/D- mesons rapidity distributions from PYTHIA. The cross section ratio from FONLL calculation is 0.18%-2.6% [18]. The upper limit is consistent with theory prediction.
The upper limit of contributions as a function of is shown in Fig. 1 (b). It is increasing and becomes flat around 7 . The crossing point, where the bottom contribution is equal to charm, of electron spectra from B,D decay is very sensitive to the cross section ratio, since at high , these electron spectra shapes are similar. From the fit to STAR p+p data, we estimate the crossing point .
Table 2 lists the crossing points of heavy flavor decay electrons in several bins.
| () | 2 | 3 | 4 | 5 | 6 | 7 () | 8 |
|---|---|---|---|---|---|---|---|
| 0.11 | 0.31 | 0.53 | 0.77 | 0.85 | 1.2 | 1.1 |
3 Fit to non-photonic electron
Besides the non-photonic electron spectrum, the non-photonic electron has also been measured in 200 Au+Au collisions at RHIC [7]. In this measurement, bottom contribution has not been separated, which can be studied by comparing simulations and data. Since heavy flavor hadrons distributions and are unknown, our simulations have to base on the following assumptions:
- –
-
The same relative ratio from p+p to Au+Au.
- –
-
Assume the B-/D- meson as the inputs for the simulation, here we assume three aspects:
-
•
I: B-/D- meson are similar as light meson .
-
•
II: D-meson as light meson but B-meson does not flow.
-
•
III: contribution is neglected and D-meson decreases at .
-
•
Here heavy flavor baryons, , are taken into account as 10% of total heavy flavor hadrons [17, pdgerr]. Their are assumed to follow light baryon . This baryon contribution effect in this simulation is small.
We use the light meson curve from fitting experimental data [19] as the input B/D distributions (Assumption I), see Fig. 3 (a). That means in each bin, the B/D distribution is initialized. The electron distributions in each bin will be obtained via B/D decays in PYTHIA model. Then the electron , shown in Fig. 3 (b), will be extracted by fitting the distributions in each bin.
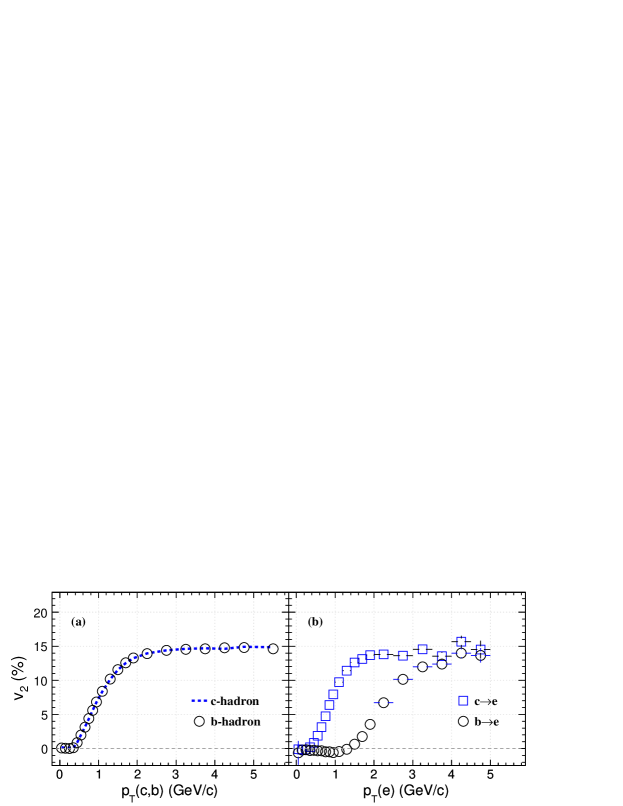
Fig. 3 shows the obvious mass effect: The B/D are assumed as the same, but the decay electron can be very different due to decay kinematics. This is not surprising, since we know B-meson is much heavier than D-meson and light hadrons. The decay electrons can only have a small momentum fraction of B-mesons. The momentum and angular correlations between decay electrons and B-mesons are weak, especially at low . Therefore, at low the decay electron angle will almost randomly distribute. So we see the zero or negative for the electron from B-meson decays. But from previous study, we know that bottom contribution below 3 is small, thus the mass effect to the total electron is not significant.
Fig. 4 (a) shows the total electron from PYTHIA simulation compared to data. The measured non-photonic electron from PHENIX is shown as the triangles. The solid curve (Assumption I) is the sum of the two decay electron distributions in Fig. 3 (b) by taking the relative ratio of into account. It can not describe the data. If we assume B-meson does not flow (Assumption II), the total decay electron will become decreasing, shown as the band. The band is corresponding to the (The upper limit, 0.49%, is in between). It has better agreement with data, but still higher. The decreasing of non-photonic electron could be due to contribution and B-meson could be very small. But below 3 , contribution is not significant. That indicates D-meson should be smaller than light meson and start decreasing at higher ( ).
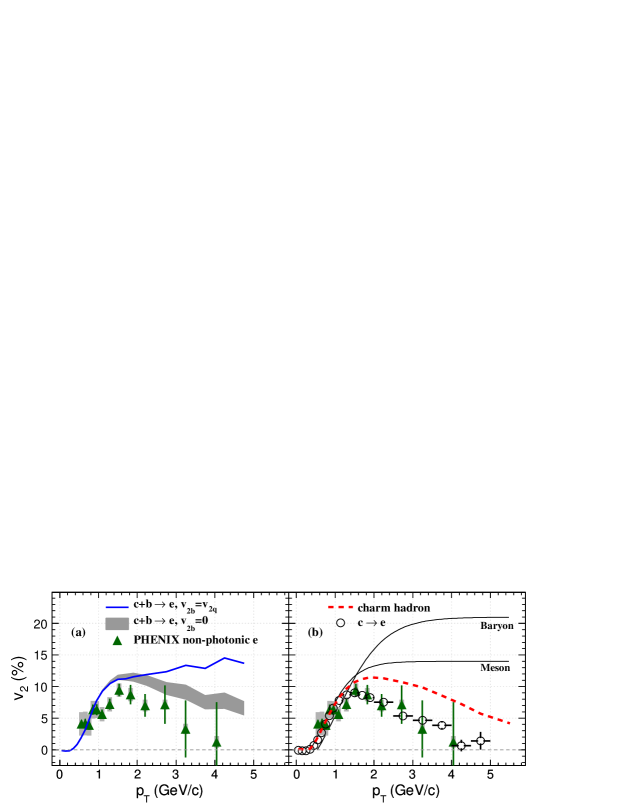
So ignoring contribution, we try to speculate the D-meson by fitting the data using decay electron (Assumption III). In Fig. 4 (b), the best fit of the decay electron is shown as the open circles. The estimated D-meson is shown as the dashed curve, which is smaller than light meson above 1 and start decreasing above 2 .
4 Conclusions
Charm/bottom and their decayed electron spectra and have been studied using PYTHIA simulation. From fitting to the STAR non-photonic electron spectra in p+p collisions, we estimate the upper limit of the total cross-section ratio as . And the crossing point of electron spectra from B decay and D decay is estimated as .
The bottom contribution due to mass effect can decrease the non-photonic electron , but this effect is not significant. The decrease of the non-photonic electron is mainly due to the decrease of the parent D-meson . The estimated D-meson is smaller than light meson above 1 and start decreasing above 2 . This most possible D-meson distribution shows that at , where the bottom contribution is negligible, D-meson has large , indicating that charm strongly flows in high dense medium, which could be the evidence of light flavor thermalization in QGP created at RHIC energy.
Acknowledgments
We thank to S. Esumi, H. Huang, Y. Miake, S. Sakai and N. Xu for their cooperation. We thank to the conference organizers. We would also like to appreciate Drs. L.J. Ruan and Z.B. Xu for helpful discussions.
References
- [1] Y.L. Dokshitzer and D.E. Kharzeev. Phys. Lett. B, 519 (2001) 199.
- [2] M. Djordjevic, M. Gyulassy, R. Vogt and S. Wicks. Phys. Lett. B, 632 (2006) 81.
- [3] S. Wicks et al. arXiv: nucl-th/0512076.
- [4] R. Rapp and H. Hees. J. Phys. G, 32 (2006) S351.
- [5] A. Adil and I. Vitev. arXiv: hep-ph/0611109.
- [6] N. Armesto et al. Phys. Lett. B, 637 (2006) 362.
- [7] S. Sakai. Quark Matter 2006 proceeding, Shanghai, China.
- [8] V. Greco, C.M. Ko, and R. Rapp. Phys. Lett. B, 595 (2004) 202.
- [9] B. Zhang, L.W. Chen, and C.M. Ko. Phys. Rev. C, 72 (2005) 024906.
- [10] H. Hees, V. Greco and R. Rapp. Phys. Rev. C, 73 (2006) 034913.
- [11] T. Sjöstrand et al. Computer Physics Commmun., 135 (2001) 238.
- [12] J. Adams et al. arXiv: nucl-ex/0607012.
- [13] H. Liu, Y. Zhang, C. Zhong and Z. Xu. Phys. Lett. B, 639 (2006) 441.
- [14] X. Y. Lin. arXiv: hep-ph/0412124.
- [15] J. Adams et al. Phys. Rev. Lett., 94 (2005) 062301.
- [16] X. Dong. Ph.D. Thesis, USTC Hefei, China, 2005. arXiv: nucl-ex/0509011.
- [17] S. Eidelman et al. “Review of Particle Physics.” Phys. Lett. B, 592 (2004) 1; W. M. Yao et al. J. Phys. G, 33 (2006) 1.
- [18] M. Cacciari, P. Nason and R. Vogt. Phys. Rev. Lett., 95 (2005) 122001.
- [19] X. Dong, S. Esumi, P. Sorensen, N. Xu, and Z. Xu. Phys. Lett. B, 597 (2004) 328.