![[Uncaptioned image]](/html/0805.2093/assets/x1.png)
![[Uncaptioned image]](/html/0805.2093/assets/x2.png)
We present a study of the LHC sensitivity to the boson mass based on simulation studies. We find that both experimental and phenomenological sources of systematic uncertainties can be strongly constrained with measurements: the lineshape, , is robustly predicted, and its analysis provides an accurate measurement of the detector resolution and absolute scale, while the differential cross-section analysis, , absorbs the strong interaction uncertainties. A sensitivity for each decay channel (), and for an integrated luminosity of 10 fb-1, appears as a reasonable goal.
1 Introduction
The Standard Model (SM), now computed at two-loop
precision [1, 2], is a very predictive
framework. Its most precisely measured parameters ,
, and , provide constraints on the boson and top
quark masses, which can be confronted with measurement.
Injecting the measured value of the mass and the measured boson
couplings, a definite prediction is given for the top quark
mass [3]. This prediction, together with the discovery of
the top quark at a compatible
mass [4, 5], has been a major
achievement in high energy physics.
The measured values of the boson and top quark masses are now more
precise than their quantum predictions, and provide non-trivial
constraints on the gauge symmetry breaking sector. In the SM, this
translates into limits on the Higgs boson mass [6]. Beyond
the SM, constraints are given on the contributions of other heavy
particles, like supersymmetric particles [7].
The mass has been measured at UA2 [8],
LEP [6], and the Tevatron [9].
The recent measurement by the CDF Collaboration gives ,
yielding a current world average of [10]. In the SM, the resulting Higgs boson mass
uncertainty is about 50%. Any further improvement in this measurement
will translate into more precise indirect predictions.
The present paper discusses the LHC prospects for the mass
measurement. The expected cross-section at the LHC is about
20 nb [11]. In 10 fb-1 of data, a benchmark for one year
of integrated luminosity during the first years of stable running,
around events will be selected in each
exploitable decay channel (), providing a
combined statistical sensitivity of about 1 MeV. Previous
estimates [12, 13, 14] of the systematic
uncertainties affecting this measurement
however amount to per experiment, and to a
combined uncertainty of . The
main sources are the imperfect determination of the experiments
absolute energy scale, and the uncertainties in the boson
kinematical distributions (rapidity, transverse momentum), which in
turn stem from proton structure function uncertainties and higher
orders QCD effects.
The purpose of this paper is to re-investigate the possibilities to
measure the mass with the greatest possible precision. As is
known from the Tevatron, the uncertainties can be significantly
reduced using boson measurements; this approach will be
employed here, with modifications and improvements suggested by the
high statistics expected. Although our discussion is
general, most of our arguments rely on the expected
performance of the ATLAS experiment [15].
The paper is structured as follows. Section 2 summarizes the mass fitting procedure, lists the ingredients needed to describe the distributions used in the fit, and gives a general description of how these ingredients can be determined. The sources of uncertainty are then discussed in turn, in Section 3 (experimental uncertainties), Section 4 (theoretical uncertainties), and Section 5 (backgrounds, underlying event, and effects related to the machine operation). Correlations between these effects are discussed in Section 6, and the results are given in Section 7. Section 8 concludes the paper.
2 General discussion
This section discusses our technical set-up, the and event selection, the mass fitting procedure, and the problem of controlling all ingredients entering in the definition of the fitted distributions.
2.1 and production. Event generation and simulation
Throughout this paper, and boson samples, and their distributions
and acceptances are computed using the PYTHIA general purpose event
generator [16]. On top of PYTHIA, the treatment of
photon radiation in and
decays is done via an interface to PHOTOS [17].
The size of the expected samples are computed assuming the NLO and cross-sections, as obtained from RESBOS [18]. These choices are not unique, and the
simulation of physics processes at the LHC, in particular
non-perturbative strong interaction parameters, will obviously need to
be adjusted using the forthcoming data. In this analysis, the effects
of the corresponding uncertainties are estimated either by changing
parameters in these programs, or by distorting the output
distributions according to our assumptions.
When referring to “fast simulation”, we mean a simplified simulation of the ATLAS detector response using scale factors and Gaussian resolution functions, applied to the generator-level information obtained above [19]. When referring to “full simulation”, we mean the complete simulation of the ATLAS detector using GEANT4 [20]. In our discussions below, and in the absence of real physics data, we often treat our fully simulated event samples as data samples, and the fast simulation samples as their Monte-Carlo simulation. The different detector response in fast and full simulation allows to emulate the realistic situation where the imperfect detector simulation is adjusted during data taking.
2.2 Signal selection and fitting procedure
At hadron colliders, and events can be detected and
reconstructed in the , , , and final
states. The hadronic modes suffer prohibitively large background from
jet production; modes can be detected but the -lepton
decay produces additional undetected particles in the final state,
diluting the information that can be extracted from
these modes. In events, the observables most sensitive to are:
The reconstructed lepton transverse momentum, ;
The reconstructed transverse mass,
.
The transverse momentum of the neutrino, , is inferred from the
transverse energy imbalance, calculated from a summation of energy in
all calorimeter cells. Electrons are measured using the inner detector
(ID) and electromagnetic calorimeter (EMC). They are reconstructed and
identified with an efficiency of about 65%, while rejecting
background from jets up to one part in ; in decays, the energy
resolution is about 1.5%. For muons, the ID is used together with the
muon spectrometer; the reconstruction efficiency is about 95% and the
relative momentum resolution about 2% [21].
The signal is extracted by selecting events with one reconstructed
isolated, high- lepton (electron or muon), large missing
transverse energy (due to the undetected neutrino), and low hadronic activity.
In the following, we
require 20 GeV, , 20 GeV, and require the
hadronic recoil (defined as the vector sum of all calorimetric
transverse energy opposite to the reconstructed decay products) to
be smaller than 30 GeV. These selections have a total efficiency
(trigger and selection)
of about 20%, providing a sample of about events in each decay
channel. The backgrounds are at the percent level.
Table 1
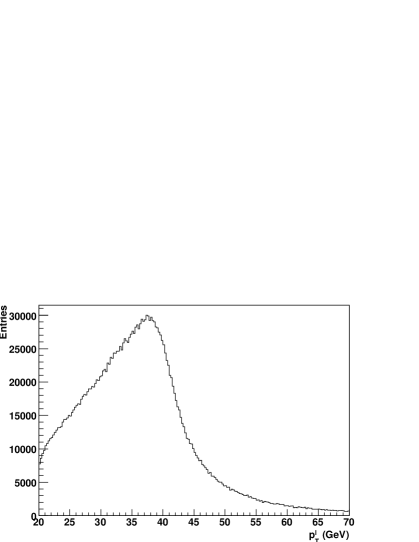
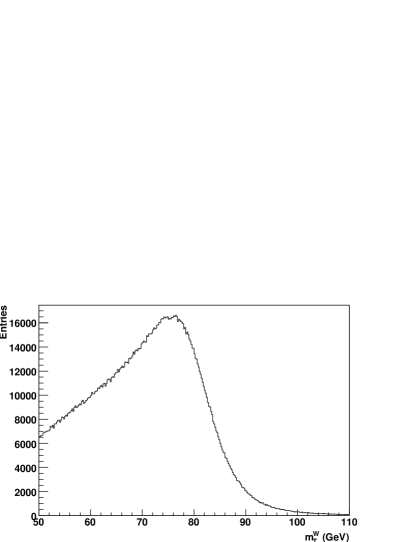
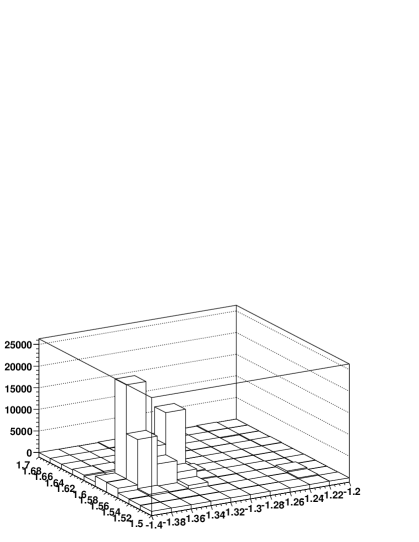
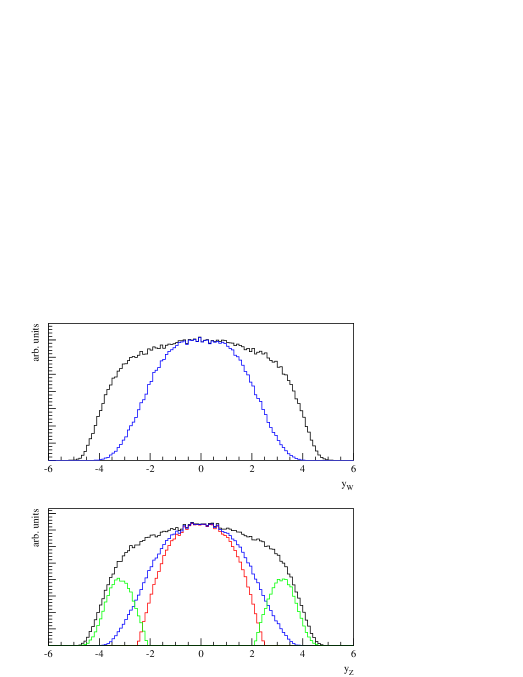
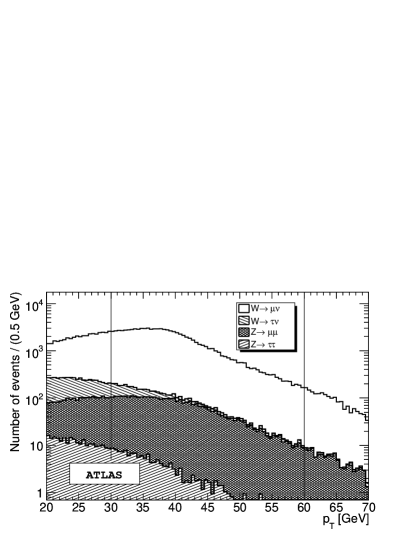
summarizes these numbers. The and distributions obtained
with fast simulation after the event selection are shown in Figure 1.
| Channel | ||
|---|---|---|
| Cross-section (pb) | 19800 | 1870 |
| Lepton acceptance | 0.63 | 0.51 |
| Selection eff. | 0.2 | 0.2 |
| (including acceptance) | ||
| Expected statistics (10 fb-1) |
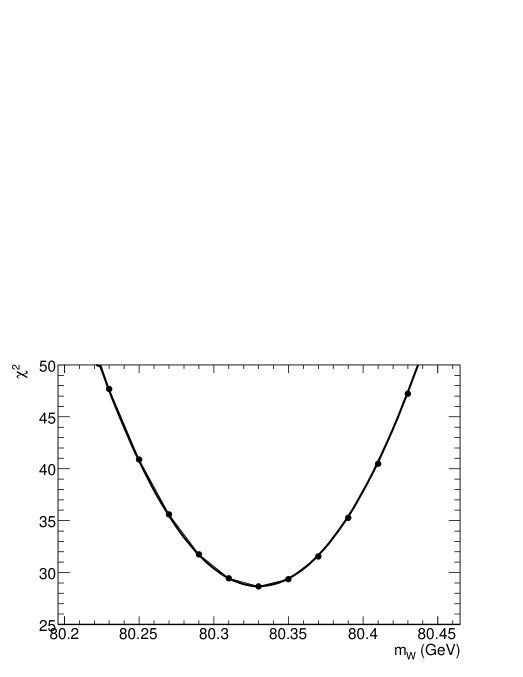
Based on these distributions, can be extracted by comparing the data to a set of models (or template distributions) obtained from event generation followed by a fast simulation of the decay particles. The different template distributions are obtained by varying the value of the boson mass parameter in the event generation. The statistical comparison of the data to the templates can be performed in various ways; throughout this study we will use a simple binned test. The quantifying the compatibility of a given template distribution with the data is defined as follows:
| (1) |
where and are the number of expected and observed
events (in the template distribution and in the data, respectively) in
bin of the or spectrum, is the expected resolution, and the
sum extends over all bins in the fitting window. The Gaussian approximation
used above is justified for large statistics, which is the case we
consider here.
After all evaluations, a parabola is fitted through the
values as a function of . The
procedure is illustrated in Figure 2. With the
statistics given in Table 1, each channel provides a
statistical precision of about 2 MeV for data corresponding to an integrated luminosity
of 10 fb-1.
2.3 Required inputs
For the above procedure to work in practice, one must predict the
and distributions as a function of the mass. These
distributions are however affected by many effects, which need to be
included correctly in order to avoid biases in the mass fit. The
needed inputs are listed below.
Experimental inputs: the energy
scale and resolution need to be known in order to describe the
Jacobian peak correctly (position and spread). Electron and muon
reconstruction efficiency effects also distort the spectra, if
this efficiency is and dependent.
Theoretical inputs: the rapidity
distribution, , affects the and distributions.
The transverse momentum of the , , directly
affects the spectrum; its impact is weaker on the spectrum. The and distributions depend on the proton
structure functions and on higher-order QCD effects. The lepton
angular distribution in the rest frame is of importance for both
and and changes with the polarization
[22]. Finally,
QED effects (photon radiation in the decay) shifts the lepton downwards. Since the radiated photons are mostly collinear to the
charged decay lepton, the impact on electrons and muons is different:
the measured muon momentum entirely reflects the momentum loss by
radiation, whereas the electron energy, measured essentially in the
EMC, includes most of the radiated energy.
Environmental inputs: these include, among
others, backgrounds surviving the selection, underlying event and
pile-up effects on reconstructed energies and momenta, random neutron
hits in the muon spectrometer (“cavern background”), and the impact
of a non-zero beam crossing angle. In all cases, imperfect modelling
of these inputs biases the event reconstruction, leading to distorted
and distributions.
2.4 Propagation of systematic uncertainties
The impact of underlying physics mechanisms affecting the mass determination
is estimated by producing template distributions of and unaware of the effect under consideration, and fitting them to
pseudo-data including this effect. The resulting bias (i.e. the
difference between the injected and fitted values of ) gives the
corresponding systematic uncertainty.
In the simplest case, a physics effect affecting the distributions (for a given value of the mass) can be summarized by a single parameter. In this case, the induced systematic uncertainty is simply given by:
| (2) |
where is the parameter controlling the parasitic
physics effect, its relative uncertainty, and
the induced systematic uncertainty on the mass. When
applicable, we will quote the uncertainty , the
derivative and the estimated
. As a convention, we normalize in MeV/%.
Sometimes, however, a single parameter is not sufficient. The uncertainty is then the result of all parameter uncertainties and their correlations:
| (3) |
This happens when the systematic is parametrized by a (sometimes empirical) function. In this case, we choose to quantify the impact by Monte-Carlo propagation: we generate random configurations of the , within their uncertainties, and preserving their correlations; for each configuration, we produce the corresponding pseudo-data, and fit them to the unaffected templates. The spread of the distribution of the fitted values gives the contribution to .
2.5 The impact of boson measurements
The LHC will produce a large number of events. Their
selection is rather straightforward, requiring two reconstructed
isolated, high- leptons (20 GeV, ), and low
hadronic activity (hadronic recoil smaller than 30 GeV).
For each useful decay mode ( )
and for fb-1, around events should survive
selections. This represents
a factor 10 less than the expected statistics, but the fact that events are fully reconstructed largely compensates this deficit.
Cross-sections and statistics are summarized in Table 1.
The precise knowledge of the mass and width will allow to determine
the lepton energy scale and resolution precisely. Exploiting the
energy distribution from the decay leptons will also allow to
determine the scale’s energy dependence (i.e, the linearity of the
detector response), and the energy dependent resolution function. Once
this is achieved, the transverse momentum will also serve to scale
the measured hadronic recoil to the ; together with the measured
lepton transverse momentum, this defines the missing transverse
energy. Finally, “tag and probe” methods [23] will allow
to determine the lepton reconstruction efficiency.
Although most of the QCD mechanisms affecting distributions carry
significant uncertainty [24], they affect and events
in a similar way. This is
the case for non-perturbative contributions to the transverse momentum
distributions, but also for parton density (PDF) effects: at the LHC,
the and the are essentially sensitive to high- sea partons, and a
variation of these parameters will affect the and distributions
(in particular , ) in a correlated way. Hence, the measurement
of the distributions will help to control the ones.
The simulation of QED radiation in and decays was much improved
recently [17, 25]. Still, the
measurement of this process (through e.g. )
will allow to confirm the predictions. Other sources of uncertainty
(e.g. backgrounds and underlying event) will also be controlled by
auxiliary measurements at the LHC.
The following sections attempt to quantify the above arguments.
3 Experimental uncertainties
This section assesses the effect of efficiency and resolution in the reconstruction of leptons and missing transverse energy.
3.1 Lepton scale and resolution
The boson resonance has been measured very precisely at the lepton
colliders during the 90’s [3]. The boson mass and
width can be exploited as an absolute reference to determine as
precisely as possible the detector energy scale, its linearity and
resolution.
The basic method is rather simple, and consists in comparing the
position and width of the observed mass peak in reconstructed dilepton
events with the boson parameters. A shift of the observed
position of the mass peak, with respect to the nominal peak position,
is corrected for by scaling the detector response, hence determining
the detector absolute scale; the additional spread of the mass
distribution, as compared to the natural boson width, is used to
estimate the resolution.
The high statistics expected at the LHC, however, imposes a number of refinements. First, the scale obtained as above is averaged over the lepton kinematical spectrum, whereas an energy-dependent scale is needed for a correct description of the Jacobian distributions in events. Secondly, lepton energy resolution effects induce a small but non-negligible shift in the di-lepton invariant mass distribution. This shift needs to be subtracted before converting the scale measured from the invariant mass distribution into the scale used to describe the Jacobian distributions in events. The resulting method has been described in detail in Ref. [26], and is summarized below.
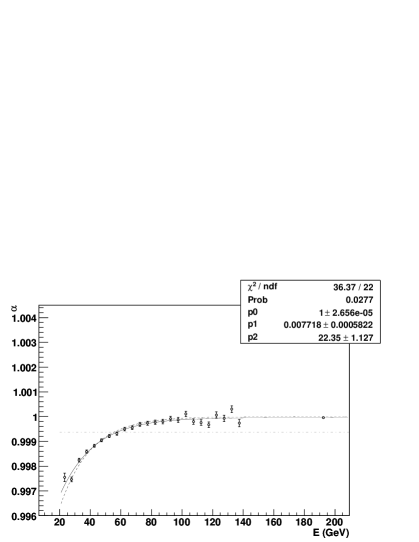
3.1.1 Average detector scale
We first illustrate the energy-independent method, providing an
average detector scale. Using the PYTHIA event
generator [16], we produce a set of template histograms corresponding
to generator-level lineshapes. The decay leptons are smeared and decalibrated with
different energy scale factors and resolution functions
. For definiteness, we consider calorimeter-like resolution
functions
parametrized as . At this stage, is independent
of the lepton energy. These templates are to be
compared to the data; for our tests, we use an independently simulated
sample as pseudo-data.
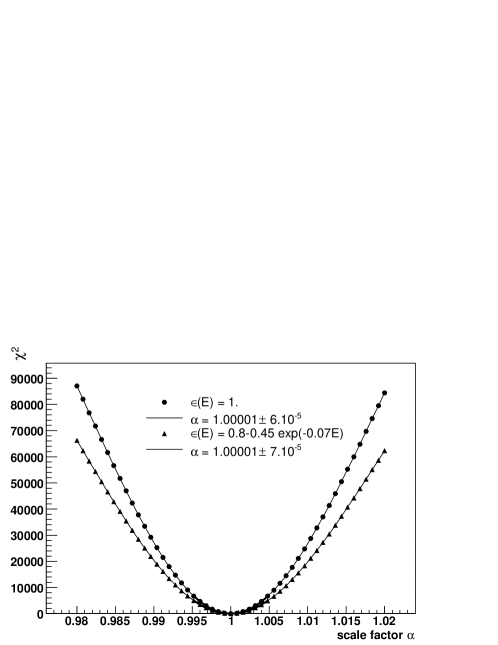
A test is then performed between the pseudo-data and each of
the template histograms, as in Section 2.2. This
results in a two-dimensional
grid as a function of the smearing parameters. At the vicinity of the
minimum, a paraboloid can be fitted through the points, and the
parameters of this paraboloid give the estimates of the true values of
and .
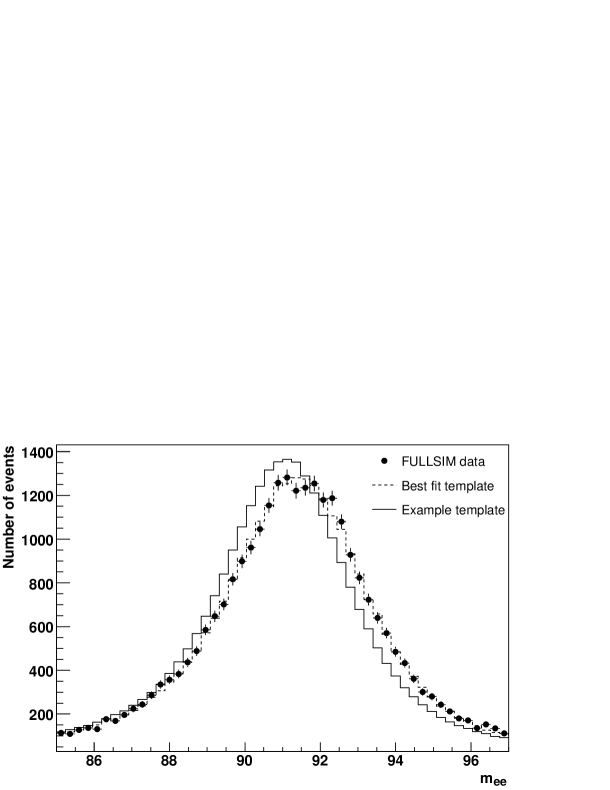
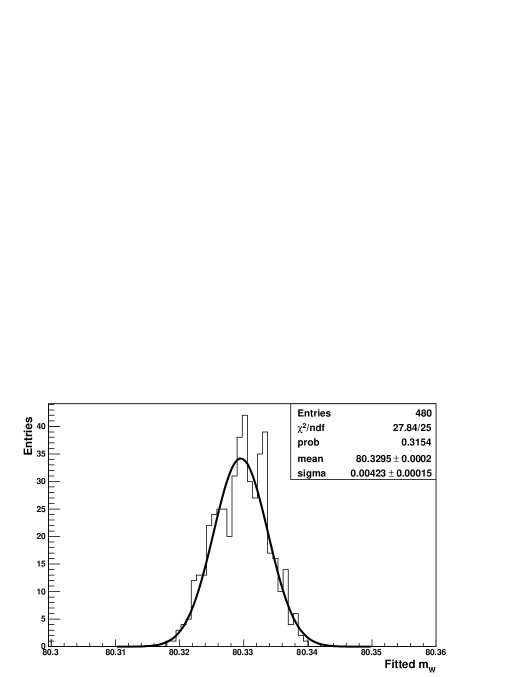
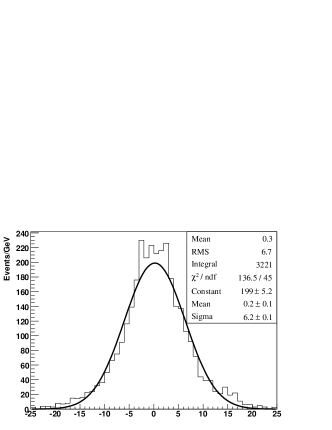
The method is tested on a fully simulated sample,
corresponding to 30700 events with GeV; the mass
resolution can be treated as Gaussian over this range.
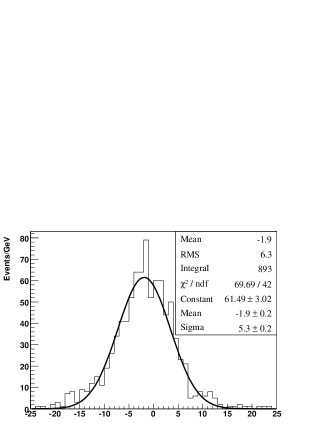
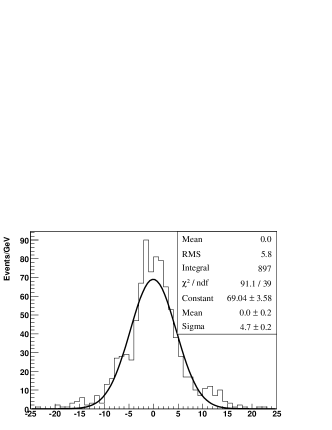
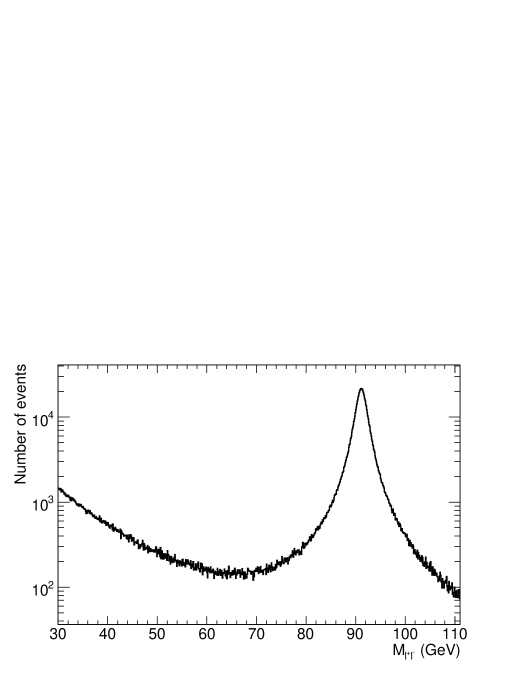
We find an average resolution parameter , and an average mass
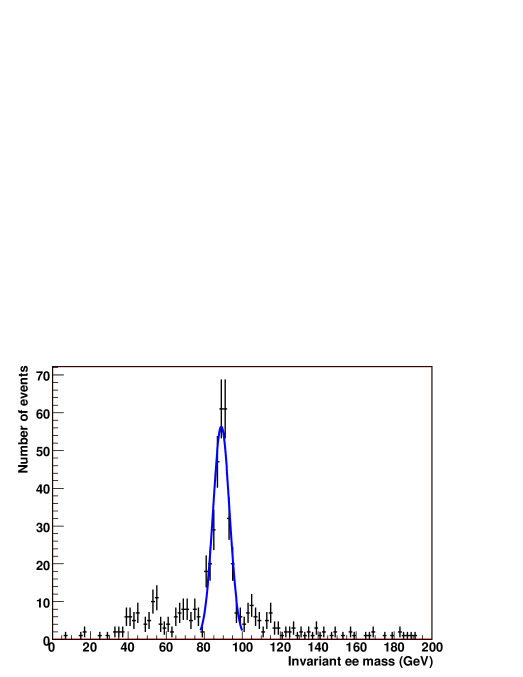
scale . Figure 3 illustrates the
result, where the fully simulated lineshape is compared to
an example template histogram assuming and , and to
the best fit result. Very good agreement is obtained; moreover,
the “measured” scale and resolution parameters coincide with the
values found when comparing the reconstructed electron energies to
their generation-level values; the electron calibration in the fully
simulated sample underestimates the true energy by 0.4%.
Assuming an inclusive production cross-section of 2 nb per leptonic decay channel and an
integrated luminosity of 10 fb-1, the average scale and
resolution parameters can be controlled with a relative precision of
and .
Note that these values are not far from the actual uncertainty of the
boson parameters. As far as the absolute scale is concerned, a
correlation between the induced -mass systematic uncertainty and the
boson mass uncertainty might finally appear.
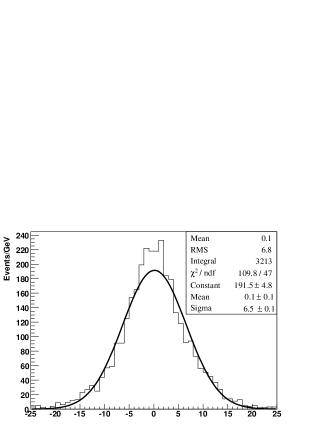
As discussed in the introduction to this section, the method illustrated here has an important shortcoming: it only provides a scale averaged over the distribution expected in events, which differs from that expected in events. The averaged scale is applicable to events only in the absence of any non-linearity in the detector response. In order to correctly propagate the calibration measurement to the sample, the scale thus needs to be measured as a function of energy. This is discussed next.
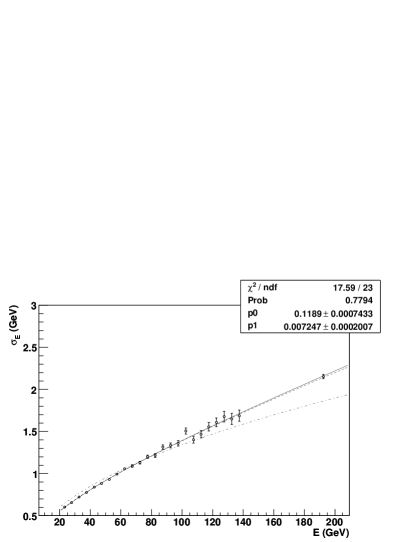
3.1.2 Linearity: energy dependent scale and resolution
The above method can be extended as follows. The data and the
templates are classified as a function of the lepton energies.
This leads to templates and pseudo-data labeled , corresponding
to the event categories where one lepton falls in bin , and the other
in bin . The scale factor and the resolution parameter
are then fitted in every bin.
In case of small non-linearities of the calorimetry response (i.e. very close to 1), we can then derive the from the , writing in first order approximation that the mass peak decalibration results from the decay lepton decalibrations:
| (4) | |||||
| (5) |
Writing this for every
gives a linear system which can be solved using least squares.
As for the resolution, the following linear system holds, neglecting the small contribution from the angular terms in the expression of the invariant mass resolution:
| (6) |
which can again be solved using least squares, yielding the
. We thus obtain the energy-dependent resolution function,
independently of the form used to produce the templates.
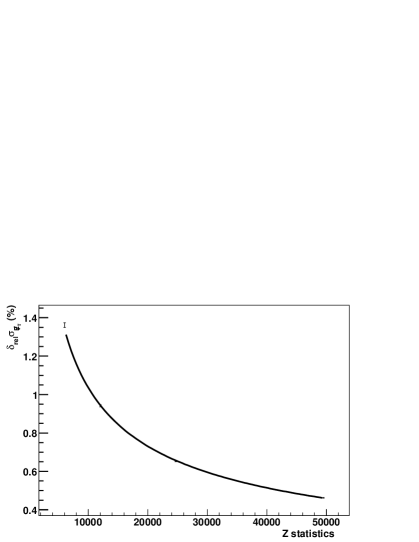
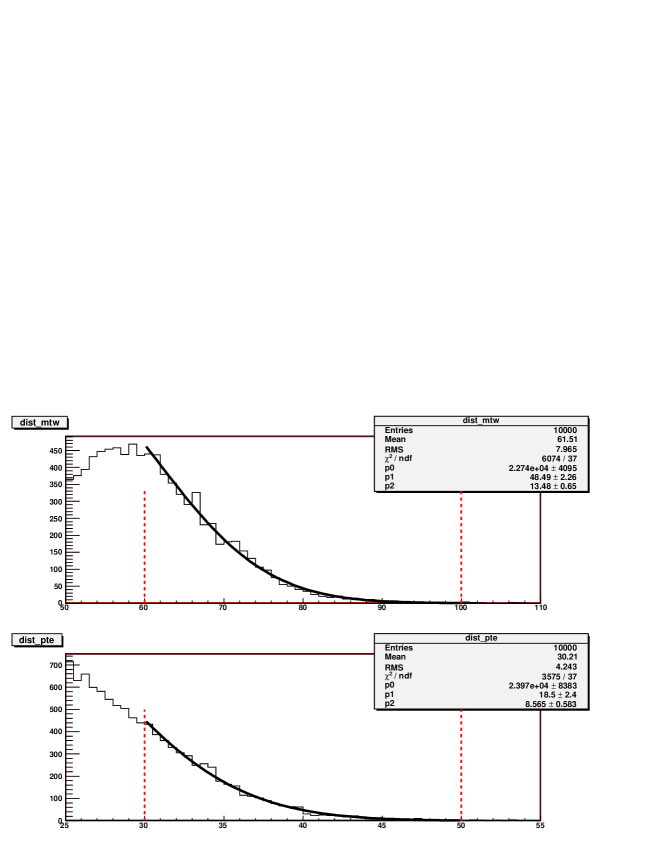
Examples of results that can be achieved are shown on Figure 4. With energy bins defined as intervals of 5 GeV, and a integrated luminosity of 10 fb-1, the scale parameters are reconstructed with a precision of , as estimated from the RMS of the residuals with respect to the injected function. Similarly, the resolution parameters are reconstructed with a precision of .
3.1.3 Propagation to : ,
Assuming that bin-to-bin variations of the scale do occur with a
spread of , we can compute the impact of such
variations on the measurement of .
As described in Section 2, we perform a set of toy
measurements, using the electron transverse momentum as observable,
templates with varying values but with a perfectly linear scale, and
pseudo-data with fixed , but containing non-linearities.
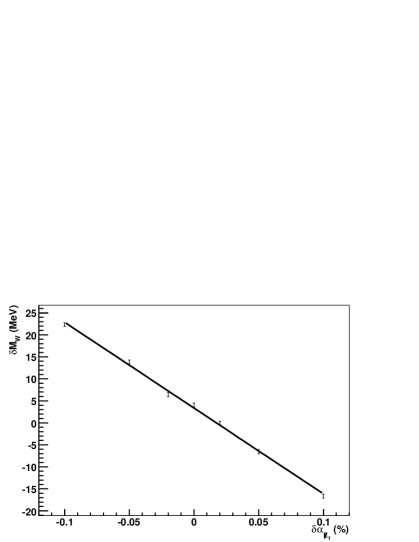
First of all, we can study the bias as a function of the error on the average absolute scale. Not surprisingly, we find a strong dependence:
as illustrated in Figure 5.
In the case of an energy-dependent scale, the uncertainty on is
obtained by injecting random, energy-dependent decalibrations in the
pseudo-data, with a spread corresponding to the result of the analysis
of Section 3.1.2. With 480 independent exercises of this type, we
obtain a distribution of as shown on
Figure 6. The scale-induced mass uncertainty is given
by the spread of this distribution, and is .
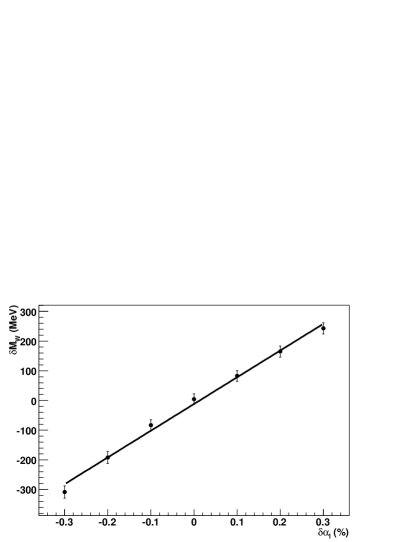
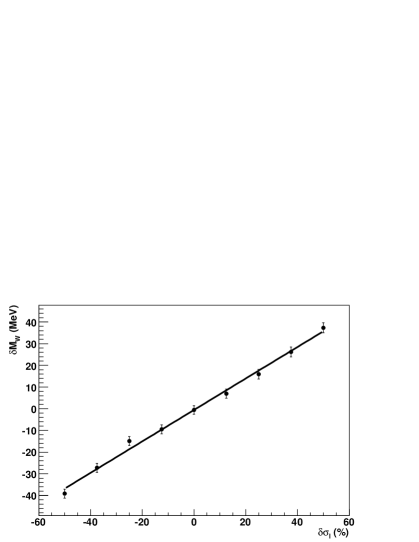
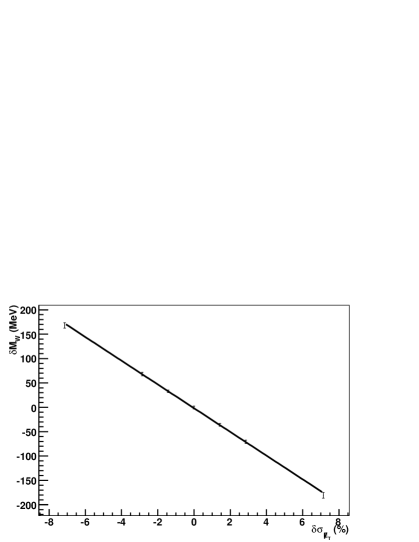
The effect of the resolution is studied by varying the resolution parameter in the pseudo-data, fitting to templates with fixed resolution, and collecting the corresponding values of . This provides the relation between the resolution bias and the resulting bias on :
as illustrated in Figure 5. Injecting the
expected precision on the resolution, using the same method as above,
yields MeV.
The analysis presented here was originally done in terms of
(rather than transverse energy, ) to ease comparison with the
scale and linearity measurements performed on ATLAS testbeam
data [27]. In the context of collision data, the
analysis can instead be performed in terms of ; the
energy-dependent scale is reconstructed with the same precision as
above, in the range GeV. The propagation to
and is unchanged.
In addition to the transverse energy dependence, the detector response
is in general also a function of the lepton pseudorapidity ,
azimuth , and time. The physical distributions are however
uniform in general, and certainly for and events. Hence it is
safe to average over ; any azimuthal dependence of the
detector scale or resolution then acts as a contribution to
the averaged detector resolution.
Any possible time dependence of the energy response can be treated in
the same way, provided the analysed and event samples are taken
from identical data taking periods (“runs”). It is however
beneficial to limit the impact of this time dependence on the
detector resolution by precisely monitoring its response as a function
of time.
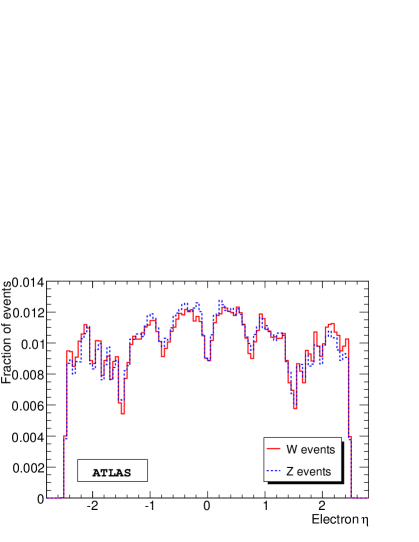
Although not strictly identical, the distributions
in and events are also expected to be very similar within the
detector acceptance (the difference is below 5% within ,
cf. Figure 7). As a first approximation, the same
procedure can be applied; the averaging over then assumes that
leptons from and are reconstructed with similar performance,
with the same averaging contribution to the global detector
resolution.
The averaging can be improved by reweighting the
distribution observed in events, where the scale is measured, to
reproduce the distribution observed in events where the scale
applied. The detector response to leptons of given transverse momentum
is then identical by construction in and decays, up to the
statistical precision of the reweighting. As will be seen in
Section 6, the absolute scale determination is
very stable against variations of the underlying physics
hypotheses. In particular, it is negligibly affected by PDF
uncertainties, which are the main factor determining the physical
rapidity distribution of the boson and its decay products. The
reweighting does thus not introduce hidden physics uncertainties, and
does not affect the discussion of other systematic uncertainties.
The above analysis is performed on the example of the electron
channels. As discussed in Section 2.2, the muon
channels provide similar statistics, and are reconstructed with
similar resolution. The present results thus equally hold in the
electron and muon channels.
We end this section by noting that other well-known physics probes of detector scale exist, such as the low-mass vector resonances and . An over-constrained scale measurement can also be performed by first measuring the ID scale, exploiting muon final states; transporting the ID scale to the EMC, using the distribution with isolated electrons; and finally verifying that this indirect EMC scale allows to reconstruct unbiased mass peaks for the known resonances in electron final states. This confrontation of measurements is expected to allow to understand the source of any observed non-linearities in terms of magnetic field effects, imperfect alignement, excess of passive material in the detector, etc. It will thus be possible to confront several independent probes of the detector scale; compatibility between these measurements then validates its use for the measurement of . This discussion is familiar from the Tevatron measurements [9, 10]. The present analysis, using events only, quantifies the precision achievable at the LHC provided all measurements of the scale agree.
3.2 Lepton reconstruction efficiency
The observed Jacobian distributions in events also reflect any
dependence of the lepton reconstruction efficiency. Any
difference between the simulation used to produce the templates and
the data will induce a distortion of the spectrum and cause a bias in
the mass fit.
We again take the electron channel as our main example. The ATLAS electron identification largely exploits the shapes of their calorimetric showers [15], which have significant energy dependence. Hence, any selection based on these will have a -dependent efficiency which has to be appropriately simulated in the templates. Unlike the electrons, no strong dependence affects the muon reconstruction efficiency.
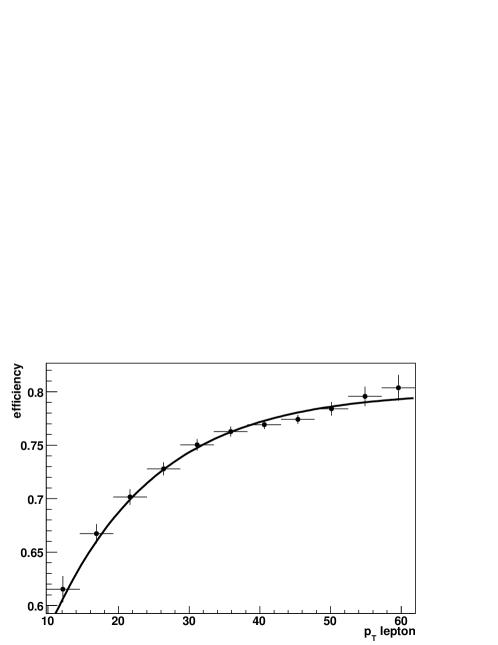
3.2.1 Electron efficiency measurements
Electron reconstruction efficiency can be determined from the data
with events, using e.g. the so-called “tag and probe”
method [23], which we briefly summarize here.
Events are selected with one well-identified electron, and an
additional high-, isolated track. The invariant mass of these two
objects is required to be within 10 GeV from the nominal boson
mass. Assuming that this selects events with enough purity, the
identification efficiency is then obtained by computing the
fraction of events where the second object is indeed identified as
an electron. The efficiency of the isolation criterion is obtained
in a similar way.
Simulation studies show that the impact of backgrounds on the
estimation of the efficiency is small compared to the statistical
uncertainty.
For the present study we use about 200000 fully simulated events, from which the efficiency is evaluated. The result is shown in Figure 8, together with an empirical function describing main features of the dependence. The following form:
| (7) |
correctly describes the efficiency in the range
relevant for the analysis.
3.2.2 Propagation to :
The effect of the efficiency uncertainty is estimated as in the
previous section. Template distributions are produced at generator
level, with varying values of , and applying an efficiency factor
according to the best fit efficiency function obtained above.
One hundred independent pseudo-data samples are generated at a fixed
mass (). Efficiency functions are applied with
parameters drawn randomly within their uncertainties, as obtained in the
previous section.
For each sample of pseudo-data, a fit is performed to the mass. The fitted mass values are histogrammed, and the spread of the
histogram gives the corresponding systematic uncertainty. With the
efficiency determined using boson decays, the
efficiency-induced systematic mass uncertainty is found to be
. Other functional forms than Eq. 7
yield the same result. The most sensitive parameter in Equation 7 is , the
slope in the exponential. It is determined to be , corresponding to a precision of 9%; in other
words, MeV/%.
To emphasize the importance of this effect, the same pseudo-data
samples are compared to templates assuming no -dependence in the
lepton reconstruction efficiency (i.e. constant). While the same
spread is observed, the distribution indicates an average bias of
about 450 MeV. This bias vanishes, to first order, when using the
-dependent efficiency in the templates.
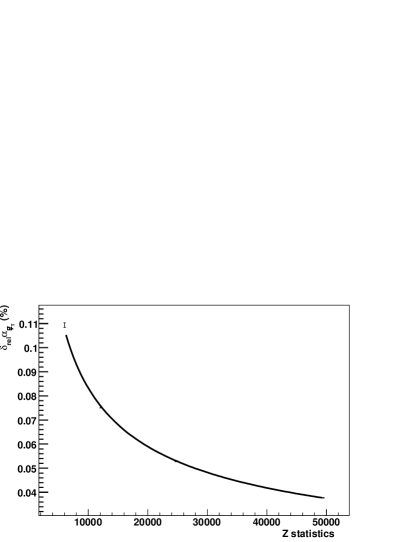
Extrapolating to 10 fb-1, i.e. assuming measured boson decays, an improvement of a factor is expected in the efficiency determination. Correspondingly, we obtain .
3.2.3 Discussion and improvements
As can be seen in Figure 8, the electron efficiency varies
most rapidly when , and is much flatter around the
Jacobian edge. Until now, the full spectrum, selected as
described in Section 2, has been used in the mass fits.
The effect of restricting the lepton range used in the fit to
higher values is displayed in
Table 2. Considering
the part of the spectrum verifying , for example,
reduces from 33 MeV to 18 MeV. While avoiding the region
with strongest -dependence of the efficiency, the Jacobian edge is
still fully exploited, and the statistical sensitivity is almost
unaffected. Extrapolating to 10 fb-1, we obtain a remaining uncertainty of
.
| cut | ||||
|---|---|---|---|---|
| () | () | () | () | |
| 80.78 | 0.033 | 80.34 | 0.033 | |
| 80.51 | 0.019 | 80.34 | 0.018 | |
| 80.44 | 0.013 | 80.33 | 0.012 |
Note that the results presented here reflect the state of the ATLAS
reconstruction software at the time of writing this paper. Significantly
improved algorithms are described in Ref. [21], notably resulting in a
smaller -dependence of the electron reconstruction
efficiency. The related systematic uncertainty on should decrease
accordingly. The numbers presented here may thus be considered as
conservative.
For muons with sufficient momentum to cross the whole detector (), no source of inefficiency has a strong dependence. Hence, the corresponding induced uncertainty on is smaller. The above estimate is thus conservative when applied to the muon channel.
3.3 Recoil scale and resolution
When using the distribution in the mass fit, enters the definition of the observable. This quantity, measured experimentally as the vector sum of the transverse energy of all reconstructed detector signals (high- leptons and low- hadronic activity), needs to be precisely described by the simulation for the same reasons as above.
3.3.1 Sensitivity to the recoil scale with events
The and bosons are produced through very similar
partonic processes, and thus one expects the spectator part of the
event (the underlying event) to behave similarly,
up to the small phase space difference ().
Assuming that the absolute lepton scale and resolution have been measured
beforehand (cf. Section 3.1), one can measure
the recoil scale () and resolution () in fully
reconstructed events, where no significant is expected,
by comparing the measured hadronic energy , recoiling against the
boson, to the reconstructed di-lepton four-momentum, . Specifically,
and are extracted from the peak
position and spread of the distribution of .
The results can then be used to correct the observed recoil, and
hence , in events.
Figure 9 shows the expected sensitivity to
and . With 10 fb-1, these parameters can
be determined with a statistical precision of and .
3.3.2 Propagation to : ,
The effect on is evaluated by systematically varying the recoil scale, producing corresponding pseudo-data samples as in the previous sections, and fitting each sample to perfectly calibrated templates. We obtain the relation between the bias and the recoil scale and resolution in the form of a derivative:
as illustrated in Figure 10. Injecting
, we obtain a systematic uncertainty
of . Similarly, we find the
contribution from the resolution to be
. These numbers assume that the
-based calibration can be transported to the sample without
additional uncertainty; this is discussed further below.
3.3.3 Further discussion
The calibration can be studied in more detail, using real
events where one reconstructed lepton is artificially
removed. In the case of electrons, the removed calorimetric energy
should be properly replaced by the expected noise. For
muons, also, the minimum-ionizing energy depositions in the
calorimeters need to be removed and replaced by the expected noise as
above. The resulting events mimic events and have a precisely known
missing energy, corresponding to the energy of the removed lepton,
which can be compared to the result of the reconstruction
algorithm.
The lepton removal requires that one can identify and remove the
electron signal from the struck calorimeter cells, while leaving a
realistic contribution from noise and hadronic background (see
Figure 11). Several approaches can be tried, such as
replacing the contents of the electron cluster cells by energy
measured away of any high- object in the event (e.g. at
in azimuth), or by the average expected electronic and hadronic noise.
To determine the resolution and possibly correct for biases in
its measurement, we consider the reconstructed of events before and after the removal of one lepton, and compare the
difference to the transverse momentum of the removed lepton. A
non-zero average value of this difference points to a bias in the
reconstruction.
Rather than projecting this difference on conventional X and Y axes in
the transverse plane, it is best to consider the natural frame of the
event, with axes parallel () and perpendicular () to the
boson transverse momentum. Imperfect calibration
of the reconstruction will show up as biases in these
distributions, which can then subsequently be corrected for within
statistics. The axes are illustrated in Figure 12.
This method is tried on a fully simulated sample of events,
with results illustrated in Figure 13. As can be seen
in this example, a bias is observed in the reconstruction along
the line of flight. No bias is observed along the other axes. In
this example, the calibration is thus correct on average, but the
reconstruction does not respond perfectly to the event-by-event topology.
As this discussion illustrates, reconstruction is a very difficult experimental algorithm to control, especially to the level of precision desired here. Therefore, we cannot claim at present that the sensitivity quoted in the previous section will indeed be reached. Instead, lacking the proof that the statistical enhancement can be fully exploited, we assume an overall uncertainty of MeV. This number is a factor 3 higher than the purely statistical sensitivity, and a factor three smaller than the systematic uncertainty obtained in the recent CDF measurement [10] based on an integrated luminosity of 200 pb-1 and about 8000 events for calibration of the hadronic recoil.
4 Theoretical uncertainties
We discuss below the uncertainties related to imperfect physics modeling of production. The correlation of the mass measurement with the width, the impact of final state radiation, and biases in the and distributions induced by and distortions are discussed in turn.
4.1 boson width:
A change in the width affects the Jacobian peak, and can cause a bias in the mass measurement. To assert the size of this effect, samples with the same mass but widths varying in the range GeVwere produced and subsequently fitted. The relation between and in the fit is linear, with a slope depending on the distribution used in the mass fit. If the transverse mass is used, we find:
If the lepton transverse momentum is used, we find:
The intrinsic width of the resonance has been measured to be , while the SM prediction is [28]. It should be taken into account that the LHC data can be expected to improve the precision on the width as well as on . Earlier measurements of [29, 30] are affected by the same systematic uncertainties as those discussed in this paper. Hence, anticipating on our results, we assume that an improvement by a factor five should be achievable, respectively leaving 1.3 and 0.5 MeV for the and fits.
4.2 QED final state radiation:
Final state radiation causes significant distortions of the naive,
lowest order spectrum of the decay leptons. We estimate
the stability of the theoretical calculation below, using the PHOTOS program [17] as a benchmark.
The numerical importance of final state radiation is illustrated in
Figure 14, which displays the distribution of the measured
lepton energy fraction (relative to their energy in the absence of
FSR). For electrons, measured calorimetric energy clusters, most
of the (collinearly radiated) photon energy is collected in the
cluster. The momentum of muons tracks, on the contrary, is measured
independently of any photon radiation. The average values of the
distributions lie at about 99% of the original value, meaning that ignoring the effect
entirely would cause a bias on the mass of about 800 MeV. The
theoretical stability of the calculation is thus of critical
importance.
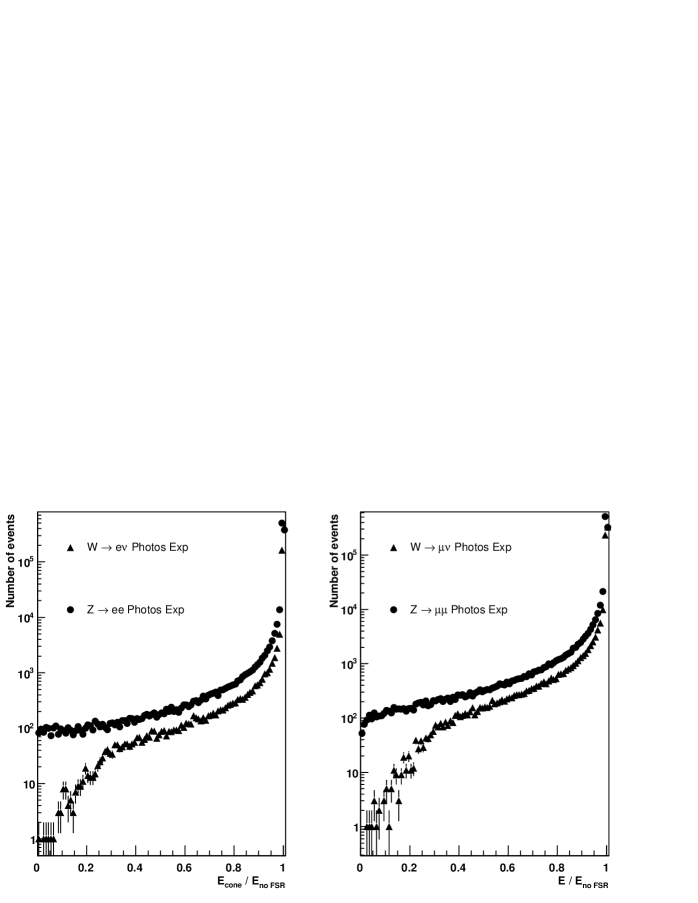
In recent versions of PHOTOS, it is possible to switch between
several theoretical assumptions. In particular, and boson decays can be simulated with photon emission up to O(), O(), O(), or with
photon emission exponentiation [31]. To study the model
differences, we have generated about events for each setting,
and for each production and decay channel (,
, for ).
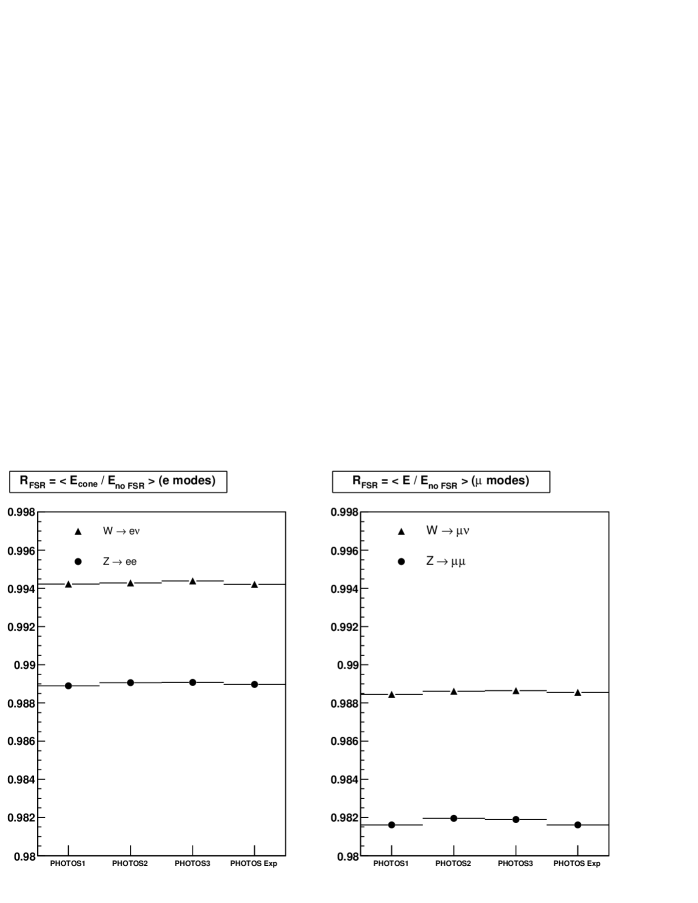
The average values of the energy fractions discussed above are shown
in Figure 15, for successive theoretical refinements.
The different average values for electrons and muons
reflect the different ways their energy or momentum is measured.
The calculation appears stable to about 1-2, the
residual differences being compatible with coming from the finite sample
statistics only. It is unfortunately not practical to further increase
the samples sizes and quantify the stability to better precision.
To improve on the above argument, consider the boson
mass measurement at LEP1 [3]. Similarly to our case, QED
corrections, in the form of initial state radiation off the electron
beams, have a large impact on the lineshape, inducing a
decrease of the cross-section of about
30%, and a shift of the peak position of about
100 MeV. Nevertheless, the theoretical uncertainty on these effects
are estimated to 0.3 MeV, compared to a total measurement uncertainty
of 2.1 MeV. The theory of QED radiation thus carries negligible
uncertainty.
For the QED induced uncertainty to be as small, the event
generators used to produce our templates thus need to have similar
theoretical accuracy, with the additional complication that the
present analysis requires an exclusive description of the final state
(i.e, a complete description of the photon distributions), whereas
the lineshape analysis only relies on the effective energy of the
beams after radiation. In Ref. [32], the accuracy of the
PHOTOS algorithm is upgraded to NLO accuracy. Similarly, the
HORACE event generator [25] contains QED and weak
corrections to NLO accuracy. Both programs implement photon emission
exponentiation.
We thus assume that ultimately MeV can be
reached. This assumption is conditioned by the availability of the
necessary tools in time for the measurement.
Let us finally note that and events behave differently under QED radiation. The average energy fraction in events is 5-7 smaller than in events, depending on the final state. The energy scale measurement (cf. Section 3.1) and the mass measurement should properly account for the difference in the respective QED radiation patterns. We will come back to this point in Section 6.
4.3 distributions
The rapidity and transverse momentum distributions result from the interplay of the proton structure functions, and strong interaction effects at the production vertex. To simplify the discussion, we will consider the longitudinal and transverse distributions independently, as respective results of parton distributions and QCD higher orders.
4.3.1 Rapidity distribution:
The rapidity distribution is essentially driven by the proton parton
density functions (PDFs).
Our study is based on the CTEQ6.1 structure functions sets [33],
which provide, in addition to the global best fit, PDFs corresponding
to the variation of each diagonal parameter (i.e, the linear
combination of input parameters that diagonalize the covariance
matrix) within its estimated uncertainty. The PDF-induced
uncertainty for an observable is obtained by computing its value
with all sets, taking the central value as given by the best fit, and
quadratically summing the biases (w.r.t the best fit value) obtained
from the uncertainty sets.
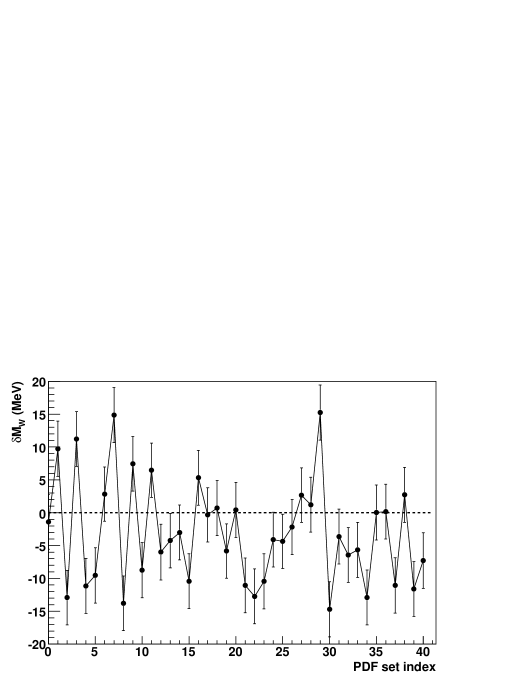
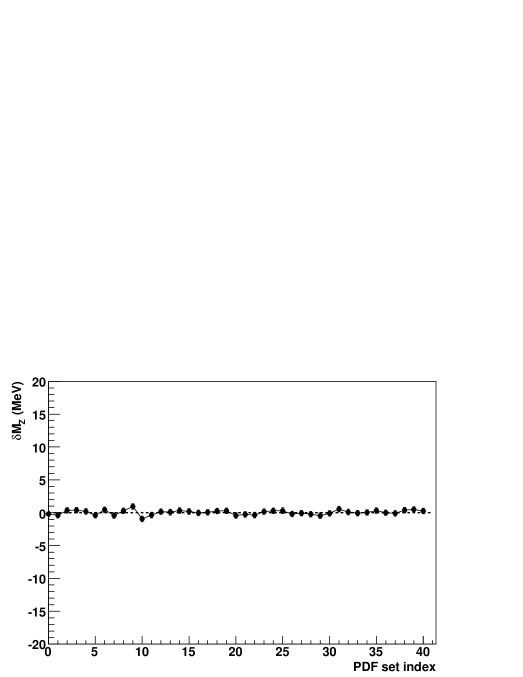
As illustrated in Figure 16 (see also Ref. [14]), the
current PDF uncertainties induce an uncertainty in the rapidity
distributions which, through acceptance effects, propagates a
systematic uncertainty on the mass determination of 25 MeV. We
present below an attempt to estimate how this will improve with the LHC data.
At the LHC, and particles are essentially produced through sea
quark interactions; the influence of valence quarks is small. Low-,
high- sea quarks mainly evolve from higher , lower
gluons, and a consequence from perturbative QCD flavour symmetry is
that up to initial asymmetries and heavy-quark mass effects, the
different quark flavours should be represented democratically. This
then implies that the impact of sea quark PDF uncertainties on and production should be very similar. In other words, when varying PDFs
within their uncertainties, one expects a strong correlation
between the induced variations of the and distributions.
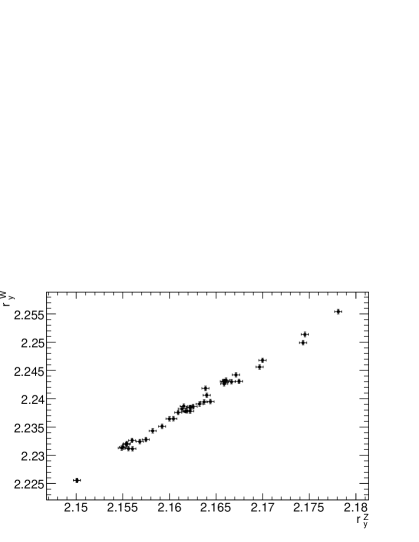
This is confirmed by Figure 17 111This plot is
reminiscent of Figure 2 in [34], displaying
similar correlations in the production rates. Note that for our
purpose, normalizations are irrelevant and we are interested only
in the distributions..
On the left, the correlation between the widths of the and boson
rapidity distributions is displayed. We choose to use the
distributions RMS, denoted and , to quantify
their width. The
current CTEQ6.1 prediction, , will be
refined to a precision of . Exploiting
Figure 17 (right), which quantifies the correlation between
and , this can be translated into a prediction of
the boson rapidity distribution, , to
be compared to the current prediction .
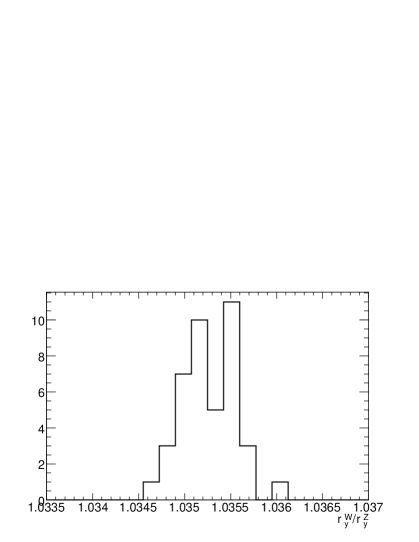
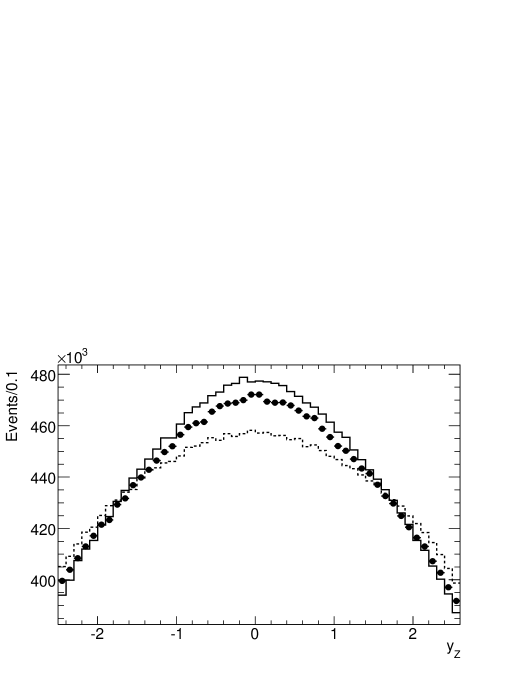
One thus expects an improvement on the rapidity distribution by a
factor 30. This is also illustrated in Figure 18, where
two extreme predictions (with current knowledge) of the rapidity
distribution are compared with an example distribution representing
the same measurement. Given the residual decorrelation between the and distributions, this translates into an improvement on the rapidity distribution by a factor .
Starting with 25 MeV, putting in a precise
measurement of the rapidity distribution at the LHC, and exploiting
the strong correlation between the and production mechanisms, we
thus anticipate a final uncertainty from the description of the rapidity distribution of 1 MeV.
In practice, the analysis will of course proceed a formal QCD
analysis to the LHC data: the measured differential
cross-section , together with
other measurements (see below), will be fed to parton distribution fits, and
the systematic from the improved PDF sets will be
evaluated as above. The present discussion however allows to estimate
the expected improvement while avoiding these complications.
Let us also note that rapidity distribution can be analyzed over a
domain that fully includes the range relevant for production. In ATLAS (as in CMS), the usual acceptance, given by
for both decay leptons, can be extended in the electron
channel by allowing one of the electrons to be detected within . In addition, high-rapidity events will be produced and
detected at LHCb (for example, the geometric acceptance of the muon
detector is approximately ). Accounting for
this, and as illustrated in Figure 19, the rapidity
range selected for the measurement is entirely included in the one. This remains true in terms of the parton momentum fractions.
We conclude this section with some caveats. The above results partly
are a consequence of the assumed flavour and charge symmetry in the
low- proton; notably, the parton parametrisations used in the fits
used above assume that at
low-, and at all . This implies the strong
correlation discussed above, since the production rate is
proportional to , and the rate
is proportional to . It is thus
important to quantify the dependence of our result on these hypotheses.
The anti-quark flavour asymmetry was measured to be non-0
in the region , and [35, 36], in contradiction with the
flavour symmetry assumption. The relative asymmetry,
, is however of the order , decreasing towards higher . Starting from
and full correlation between and production (i.e. and distributions have the same
rate of change under PDF variations), induces a
decorrelation of order , where both factors are of order (see for
example Figure 1 in [33]). Hence, even in the presence of
non-vanishing , the freedom of the distributions is very limited once ones have been precisely
measured. We thus assume that our estimates remain correct;
nevertheless, measurements of the charge asymmetry, sensitive
to , will allow to verify this hypothesis.
Additional information will be provided by measuring in and
events separately.
The proton strangeness asymmetry, , is constrained
by neutrino scattering
data [37, 38, 39]. The relative asymmetry
is rather small, even at low : at . It will only become smaller at , where most of the strange sea is generated
radiatively. We consider, as above, that the contribution of the
asymmetry is small in terms of the overall production and its
uncertainty. However, the impact on the measurement would need to
be studied specifically. At the LHC, the analysis of production should provide additional insight.
Finally, one may argue that the influence of heavy quark PDFs on and
production is different, thus a source of decorrelation between the
two processes. The charm quark contribution to production is significant (), but
smaller for production (). On the other hand, the -quark
content contributes to production (), but
negligibly to production (), due to the smallness of
the off-diagonal third generation CKM matrix elements. These
differences are however accounted for by the present analysis, since
the heavy quark PDFs are included the CTEQ6.1 PDF sets; heavy flavours
are actually understood to cause in part the small decorrelation
between the and boson distributions. Our conclusions thus remain
unchanged.
The present study has been repeated using the MRST2001 PDF sets [40]. The same correlation is observed between and , and the same result is obtained. Non-global parton density fits, such as those performed by the H1 and Zeus experiments, are based on similar hypotheses and claim slightly smaller uncertainties [41], again preserving our result. Finally, during the course of this work, CTEQ6.5 PDF sets became available [42], which improves on the treatment of heavy quark masses in the QCD evolution. The flavour symmetry assumptions are however unchanged, so that the present discussion is not affected.
4.3.2 Transverse momentum distribution:
The prediction of vector boson distributions at hadron colliders
has long been an active subject [43, 44, 24].
It is also a crucial input
for the mass analysis, especially when using the observable. We discuss below the impact of uncertainties on
the mass determination in this hypothesis.
The measurable and distributions are the result of several
effects, most notably the repeated, partly non-perturbative parton
radiation occurring in the transition from the low- proton
towards the hard process (commonly referred to as parton showers, or
soft gluon resummation). Another source is the transverse momentum intrinsic
to the partons in the proton. We choose not to discuss these effects
separately. Rather, reckoning that although and production differ
in several respects (the coupling to initial partons is different in
both phase space and flavour), the non-perturbative mechanisms are
universal, we evaluate how precisely their combined effect can be
measured in neutral current events, and how this improves the predictions. Notice that heavy flavour PDF have caused only a small
decorrelation between and events in the previous section; this is
assumed to remain true in this discussion.
First, the relation between the bias in the modeling of and the
measurement of is investigated by applying scaling factors to
the distributions in our pseudo-data, deducing the
corresponding distributions, and fitting against
un-distorted templates. The bias in appears to be a linear
function of the mis-modelling, with a slope of order 0.3, meaning
a 3 MeV bias on results in a 1 MeV bias on , when exploiting the
distribution. When is used, the effect is negligible.
Neutral current dilepton events allow to measure the distribution, as a function of mass, over a large
mass range. Assuming usual selections, this distribution will be
measured precisely for GeV. This large lever
arm, in addition to the very precise determination of the distribution on the peak, provides a precise control of when
. This is illustrated in Figure 20, which
displays the dilepton mass dependence of its average transverse
momentum, , as predicted by PYTHIA.
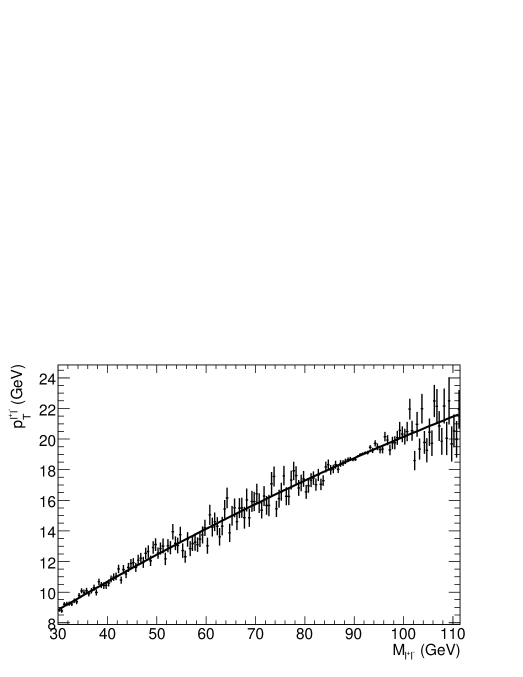
On the peak, will be known to about 7 MeV with an
integrated luminosity of 10 fb-1. Thanks to the Drell-Yan
continuum, the accuracy in the region of is still
8 MeV. This precision can be used to constrain the
non-perturbative parameters governing the parton shower or resummation
computations, and to predict the distribution with similar accuracy.
This leads to an uncertainty on of about 3 MeV.
Arguably, the distribution cannot be summarized by its mean value. However, in the low region (selected by the recoil cut, cf. Section 2), it can be empirically described by a two-parameter function. As an exercise, the mass-dependence of the parameters were determined on Drell-Yan events, their values and uncertainties in the region were used to produce pseudo-data as above, and corresponding fits to were performed. The spread in resulting from the uncertainty in the empirical parameters was found compatible with the above estimate.
5 Environmental uncertainties
5.1 Backgrounds
The leptonic final states benefit from low backgrounds, mostly
coming from vector boson decays; notably (irreducible), (where one lepton is not
reconstructed), and . QCD dijet
events will, despite their large cross section, not be dominant. The
backgrounds from and events are negligible.
The systematic error on arises from uncertainties on the
background shape and normalization in the fitting range of the and spectra.
Uncertainties on the and background size, relative to the signal
size, depend on cross-sections, branching fractions and
acceptances. These are obtained from the PDG
[28] and take into account the studies described in
Section 3.2 and 4.3. Note that in
contrast to the studies presented until now, the background
uncertainty does not scale with statistics.
The background shapes are determined from simulation. They are
essentially unaffected by variations in the production, decay, and
resolution model, and play only a minor role in the overall systematic
errors. For QCD background, as a separate study, both normalization
and shape will have to be measured directly from the data.
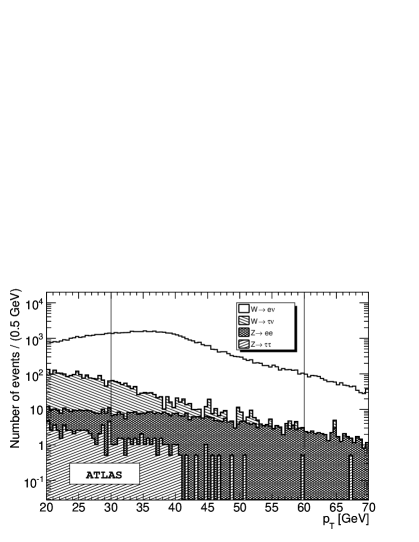
The distributions, including signal and backgrounds, are
illustrated in Figure 21.
events:
The largest background is from events, where the
decays into a lepton. This background is irreducible, as the
final state is identical to the signal; however, its and are on average lower, leaving a tail into the fitting range.
Though being the main background, its uncertainty is small, as only
decay parameters and the acceptance enter, with respective
uncertainties of 1% and 2.5%.
events:
The second largest background is from events, where
one lepton is either undetected or not identified. This background can
be reduced using a veto rejecting events, where the lepton and
a second isolated object (track and/or cluster) form an object with
an invariant mass between 80 and 100 GeV (see Figure 22).
Due to the high mass of the boson, the distribution extends well into the fitting range. The distribution is again at low values, due to
the smallness of missing momentum.
The size of this background has uncertainties from both the to cross section ratio , and from the acceptance/veto
efficiency. It is expected to be larger for muons than for electrons,
as the former cannot be vetoed for .
events:
A small background originates from
the process, where one
decays leptonically, while the other is not identified. While
the cross section for such a process is small, it contains
significant .
Jet production:
The QCD background cannot be obtained reliably from simulation. It
will thus have to be measured directly from data. For the Run I mass
measurement at CDF, this background could be estimated to a precision
of 50% [45], limited by lepton identification
performances and statistics. At ATLAS, a precision of 10% is
assumed in the electron channel, where this background is expected
to be significant. The assumed improvement is justified by the superior
granularity and resolution of the EM calorimeter [15].
The muon final state is less contaminated by jet events, muons being
measured behind all calorimetry. A specific background is however
constituted by muons from hadron decays in flight. As we have no
measure of the uncertainty on this background, our results implicitly
assume it is small.
We stress that these estimates are essentially qualititative. A
realistic estimate of their impact on the measurement will only be
possible with data.
Overall impact:
We now estimate the overall impact of the backgrounds. The background
shapes can be empirically described by an exponential
function in the fitting range, as illustrated in
Figure 23 on the example of the
background. The systematic uncertainty on is then derived by
varying the function parameters within their uncertainties as
estimated above. The systematics uncertainty induced by the background
shapes amounts to 20% of that induced by the normalizations.
The overall effect is obtained by repeating this procedure for all backgrounds.
Table 3 summarizes background uncertainty and
its impact on the mass determination.
| Background | Variable | Error | Derivative | Impact (MeV) |
|---|---|---|---|---|
| 2.5 % | -0.5 MeV/% | 1.5 | ||
| 2.5 % | -0.7 MeV/% | 2.0 | ||
| 2.8 % | 0.08 MeV/% | 0.22 | ||
| 2.8 % | 0.09 MeV/% | 0.26 | ||
| 4.5 % | 0.02 MeV/% | 0.09 | ||
| 4.5 % | 0.03 MeV/% | 0.14 | ||
| QCD events | 10 % | 0.04 MeV/% | 0.40 | |
| 10 % | 0.05 MeV/% | 0.50 | ||
| Total | 1.6 | |||
| 2.1 |
Combining the systematic errors from the backgrounds yields a total of 1.6 and 2.1 MeV for the and distributions, respectively.
5.2 Pileup and underlying event
The soft hadronic activity accompanying the hard process (underlying
event), and the overlap with soft events produced in the same bunch
crossing (pile-up) generate additional particles that contribute to
the detector occupancy. In particular, the additional calorimetric
energy overlaps with the electron signal and distorts the electron scale
measurement.
Typically, a soft event produces about 10 particles per unit rapidity
(integrated over ), with average transverse momentum [46, 47]. An electron cluster of
typical size is
expected to contain about 40 MeV of hadronic background, to be
subtracted from the electron signal.
In particular, the hadronic background may have a non-negligible
-dependence, generating a non-universality between and
events. These effects are small but need to be properly
accounted for when aiming at a precision on the absolute electron scale of
.
This aspect was not studied here, but we follow the argument
of [15]. By measuring the energy flow away from any
high-objects, as a function of , independently in and events, a 2% precision on the hadronic energy flow looks
achievable. Such a result would bring down the size of the
effect from 40 MeV to about 1 MeV.
We thus conclude that although soft hadronic interactions generate
shifts in the energy measurements that are large compared to the
statistical sensitivity to , these shifts can be measured in the
data with sufficient accuracy. The final contribution to
is small.
This source of uncertainty affects the electron scale; the muon scale is not affected. The impact on the recoil measurement is not discussed here; this section is thus relevant for based measurements.
5.3 Beam crossing angle
At the LHC, the proton beams are brought to collision at a crossing angle
of 142.5rad [48]. In terms of momentum, this translates into a
boost in the
horizontal plane (-direction), per beam proton. However, in the
simulation protons collide head-on, giving rise to a systematic shift in
of all particles produced.
Figure 24 shows the difference in the transverse momentum
before and after taking this effect into account, , which is expected to be up to
.
However, since the boson line of flight has azimuthal symmetry, the
impact on the transverse momentum distribution is smaller, as most
of the effect is averaged out by the rotational symmetry.
The size of the effect is estimated as usual, by including the in the pseudo-data and letting the templates unchanged. We find that the effect is smaller than 0.1 MeV.
6 Correlations
So far, all main sources of systematic uncertainties have been
investigated independently. Before we move to the combination of our
results, we need to address the question whether important
correlations are to be expected between the sources.
It is, however, beyond the scope of this work to discuss this issue
extensively, and we limit this section to the most important
examples.
The uncertainty related to the absolute scale has the strongest lever arm on the determination of (). Therefore, we investigate below whether uncertainties which affect the mass measurement can also bias the absolute scale.
6.1 Absolute scale vs. lepton reconstruction efficiency
We repeat the procedure described in Section 3.1. As
before, boson invariant mass templates are produced for
different scale and resolution hypotheses, and pseudo-data with scale
parameters to be determined. The impact of a -dependent lepton
reconstruction efficiency
is assessed by assuming perfect efficiency in the templates
(), and injecting the efficiency function discussed in
Section 3.2 in the pseudo-data.
The result is displayed in Figure 25. It appears that
the injected inefficiencies merely induce a reduction of statistics,
and hence some loss of precision in the scale determination, but no
appreciable bias: in spite of the reduction in
statistics, the reference invariant mass distribution is not
significantly distorted. Note that, since the efficiency is assumed perfect
in the templates, and realistic in the pseudo-data, any observed bias
would have been a large overestimation of the effect, representing
100% uncertainty on the effect.
6.2 Absolute scale vs. PDFs
Similarly as above, and also as in Section 4.3.1, we
compare boson mass templates produced with the CTEQ6.1 central
set to pseudo-data produced with the 40 uncertainty sets.
The results of the 40 fits are displayed in Figure 26, in
the form of biases with respect to position of the mass peak obtained
in the templates. The CTEQ6.1 uncertainty sets induce typical biases
of 0.5 MeVwith respect to the central value. Summing over all
uncertainty sets gives a total scale uncertainty of about 2.5
MeV. This translates into MeV.
In other words, with current knowledge, the PDF
uncertainties induce a direct systematic uncertainty of about 25 MeV distortions of the distributions (cf. Section 4.3.1), and an indirect uncertainty of 2.2 MeV distortions of the lineshape, propagating to the absolute
scale determination.
Hence, the conclusions of Section 4.3.1 are essentially unchanged. Using measurements of the boson distributions, the PDF induced systematic uncertainty should drop to about 1 MeV.
6.3 Absolute scale vs. QED corrections
QED corrections affect the determination of the absolute scale in two
ways. First, as was mentioned in Section 4.2, the
observed and decay lepton spectra are strongly
affected by photon emission. This effect needs to be taken into
account properly when producing the mass templates.
In muon final states, the theoretical distributions are based on the
final muons, after simulation of the QED photon emissions. Final state
electrons cannot be separated experimentally from the mostly
collinear photons. Hence, the simulation needs to reproduce this
recombination precisely. This demands precise theoretical control of
the photon distributions, an aspect which seems under sufficient
control (cf. Section 4.2).
Likewise, a precise description of the detector geometry and EMC
shower development in the simulation are needed to properly simulate
the fraction of photon energy recombined in a given electron cluster.
Secondly, as a consequence of the above, the absolute scale extracted
from events actually corresponds to a mixture of photons and
electrons. In ATLAS, the EMC response to electrons and photons is
different by about 1%, an effect coming from calorimeter geometry
(because their showers develop differently, electrons and photons of a
given energy do not “feel” the same sampling fraction) and from the
passive material in front of the EMC, which causes early showers or
conversions, with different probabilities for both particle
types [49]. It is thus important to know whether and
behave similarly in this respect, and if any difference is
well understood theoretically.
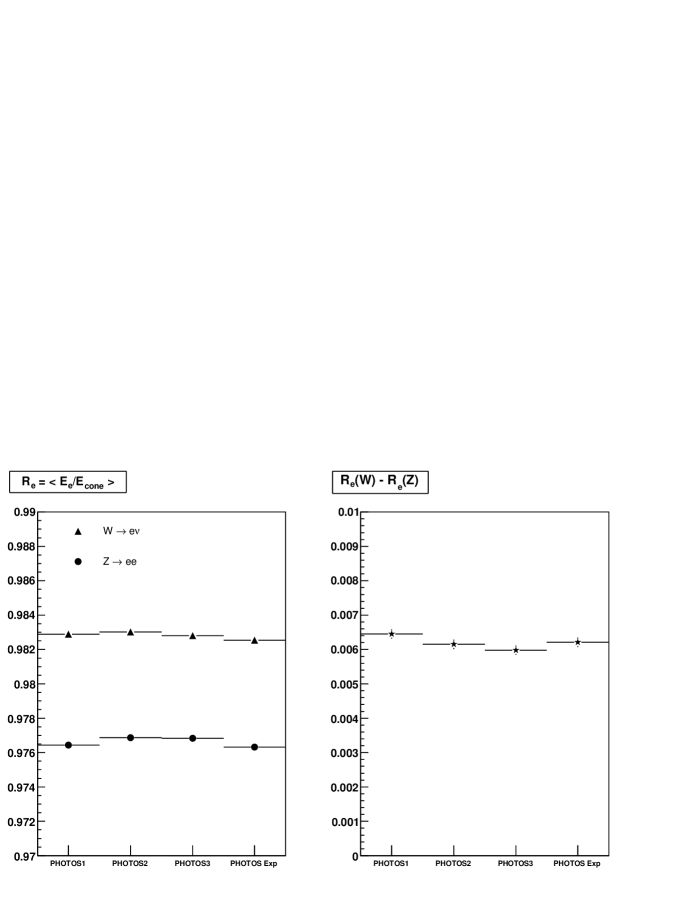
As is shown in Figure 27, the electron energy fraction
in EM clusters differs by about 0.6% between and events, meaning that the energy scale measured in events needs
to be corrected by a factor 1% 0.6% = 6 .
Failing to take this factor into account would induce a bias of MeVon the fit. However, Figure 27 also shows a
good stability of the theoretical prediction. Hence, although this
correction is not negligible, it does not carry a significant
uncertainty.
7 Impact on the mass measurement
We summarize below our main results. Table 4 recalls
the main systematic contributions to the - and -based measurement, with 10 fb-1 of data. In both tables, numbers are given
for the electron and muon channels separately when applicable.
The major difficulty is, as expected, the determination of the
absolute energy scale of the final state leptons
and the hadronic recoil. The analysis of the peak however allows to strongly constrain the lepton scale
uncertainty. The analysis is non trivial, because in addition to the
mass parameters, many other effects enter the theoretical
description of the lineshape; most notably, QED radiation. Although
the effect is large, the theoretical understanding is adequate, as the
LEP1 mass measurement indicates. The mass measurement relies on
an analytical formulation of the inclusive radiation spectrum; the
mass measurement at the LHC however requires a complete
Monte-Carlo implementation, providing an exclusive description of the
final state at the same level of precision. Such tools are critically
needed in the context of this measurement.
The analysis of the transverse mass requires in addition a precise
calibration of the hadronic recoil using events, and an unbiased
transport of the calibration to events. Such an algorithm is not
discussed here; the corresponding systematic uncertainty assumed here
is a compromise between the high statistical sensitivity of
the in situ calibration in ATLAS, and the actual result recently
obtained at the Tevatron [10].
The electron channel appears somewhat more difficult than
the muon channel. The first reason is the -dependent electron
identification efficiency, which distorts the Jacobian distributions;
this effect is essentially absent in the muon channel. The second
reason is again related to QED radiation: since the muons do not
recombine with the emitted photons, the description of the effect is
purely theoretical. In the case of electrons, a large fraction of the
radiated energy is included in the electron cluster. Determining this
fraction requires a precise description of the detector geometry and
reliable simulation of EM showers.
We estimate that uncertainties related to the description of the and distributions will be small once the differential
cross-section will have been measured. As discussed in
Sections 4.3.1 and 4.3.2, this result
relies on two assumptions. The first assumption concerns the light quark
flavour and charge symmetry in the low-, high- proton. We
estimated that relaxing these hypotheses within bounds allowed by the
existing data is unlikely to invalidate our result. Another assumption
is that the non-perturbative mechanisms controling the and distributions remain essentially universal, although heavy flavour
contributions to and production are different. The effect of
heavy flavours on the distribution has been
studied [50], but a study comparing these effects on W
and production is currently lacking. The largest remaining systematic
comes from the modeling of , in the -based measurement, contributing
a 3 MeV uncertainty. The -based measurement is more stable in this
respect, but suffers additional experimental complications related to
the experimental control of the reconstruction.
Backgrounds contribute an uncertainty MeV. Of all
components, the background from jet production is the least well known,
but its contribution is expected to be small. We did not investigate
the possible impact of cosmic rays and hadron decays in flight, which
occur in the muon channels, but Tevatron experience indicates the
impact is small.
All in all, a total uncertainty of about 7 MeV can be achieved, in
each channel, using either the or the method, with
the equivalent of 10 fb-1 of data. Most sources of systematic
uncertainty seem to scale with the accumulated statistics;
notable exceptions are backgrounds, QED radiative corrections and
the underlying event. Their contribution to is however subdominant.
Combining channels, and allowing for more data, we can therefore
expect further improvement.
| Source | Effect | (MeV/%) | (%) | (MeV) |
|---|---|---|---|---|
| Prod. Model | width | 1.2 | 0.4 | 0.5 |
| distribution | 1 | |||
| distribution | 3 | |||
| QED radiation | 1 (*) | |||
| Lepton measurement | Scale & lin. | 800 | 0.005 | 4 |
| Resolution | 1 | 1.0 | 1 | |
| Efficiency | 4.5 (e) ; 1 () | |||
| Recoil measurement | Scale | |||
| Resolution | ||||
| Backgrounds | 0.15 | 2.5 | 2.0 | |
| 0.08 | 2.8 | 0.3 | ||
| 0.03 | 4.5 | 0.1 | ||
| Jet events | 0.05 | 10 | 0.5 | |
| Pile-up and U.E | 1 (e); | |||
| Beam crossing angle | 0.1 | |||
| Total () | 7 (e); 6 () |
| Source | Effect | (MeV/%) | (%) | (MeV) |
|---|---|---|---|---|
| Prod. Model | width | 3.2 | 0.4 | 1.3 |
| distribution | 1 | |||
| distribution | 1 | |||
| QED radiation | 1 (*) | |||
| Lepton measurement | Scale & lin. | 800 | 0.005 | 4 |
| Resolution | 1 | 1.0 | 1 | |
| Efficiency | 4.5 (e) ; 1 () | |||
| Recoil measurement | Scale | -200 | ||
| Resolution | -25 | |||
| Combined | 5 (**) | |||
| Backgrounds | 0.11 | 2.5 | 1.5 | |
| -0.01 | 2.8 | 0.2 | ||
| 0.01 | 4.5 | 0.1 | ||
| Jet events | 0.04 | 10 | 0.4 | |
| Pile-up and U.E | 1 (e); | |||
| Beam crossing angle | 0.1 | |||
| Total () | 8 (e); 7() |
Let us briefly compare our results with the recent prospects presented by the CMS Collaboration [14]. We base our comparison on the -based measurement and 10 fb-1 of data. CMS claims 2 MeV from the absolute scale, agreeing with our average scale result of Section 3.1.1. A simplified treatment of non-linearities leaves a systematic uncertainty of 10 MeV, and the assumed 8% relative knowledge on the resolution contributes 5 MeV; these numbers can be compared to the 4 MeV we obtain in Section 3.1.2. We include a discussion of the reconstruction efficiency uncertainty, which is omitted in [14]. On the theoretical side, the present note and Reference [14] agree on the initial uncertainties related to PDFs and the description of the transverse momentum distribution. Our improvements in this respect rely on an analysis of the constraints provided by the analysis of the boson differential cross-section at the LHC. Finally, we claim a statistical sensitivity of about 2 MeV, compared to 15 MeV in [14]. This is explained by CMS choosing to base the templates on measured events ( the scaled observable method, or scaling the kinematics event by event), thus paying for the smaller boson production rate. Such a procedure is in principle justified by the reduction of other systematic uncertainties, but as we saw throughout this paper this does not seem to be a worthy trade.
8 Conclusions and perspectives
We investigated the most important systematic uncertainties affecting
the mass determination at the LHC, and found that the analysis
of production constrains the systematic uncertainties to a
total of about 7 MeV per channel, exploiting 10 fb-1 of
data. Combining independent measurements may bring further improvement.
Among all investigated sources of systematic uncertainty, two items
in particular rely on assumptions. The first one concerns the treatment of
QED radiation. We argued that the theory is under very good control,
having notably allowed a very precise mass measurement at
LEP1, where QED effects are large, but the uncertainties finally have
an almost negligible contribution. To preserve this situation at the
LHC, the measurement requires QED simulation tools providing the
same level of accuracy.
The second assumption concerns the effect of the light and heavy flavours in the
proton. Releasing the light flavour symmetry assumption in use in the
current global QCD fits will cause a decorrelation between and production at the LHC. This decorrelation can be expected to
be small, but will have to be measured at the LHC, notably
using the rapidity-dependent charge asymmetry and the study of
associated / + charm production. Similarly, heavy flavour PDFs
generate some decorrelation. This
decorrelation was verified to be small in the and distributions, and the same was assumed true for the and distributions. To verify this assumption requires a theoretical study
comparing the heavy flavours influence on soft gluon resummation in and events.
A number of sources have not been studied explicitly, notably
the recoil measurement, affecting the distribution; the
underlying event, affecting the electron energy scale; and
polarization effects, affecting the leptonic angular
distributions. Other sources, like backgrounds from jets, cosmic
muons, or induced by the machine can only be studied reliably using
real data. We believe these mechanisms can be brought under sufficient
control, on the time scale of the LHC measurement of .
The results presented here have only exploited boson measurements. Many other calibration processes exist, that give additional constraints on the detector performance and on the physics mechanisms influencing production. While first providing a way to verify the robustness of the -based calibrations, these processes can help to reduce the uncertainties further in the case of consistent results. We reserve these refinements to the analysis of the forthcoming LHC data.
9 Acknowledgements
This work has continuously benefitted from feedback, suggestions and discussions. Within the ATLAS Collaboration, we would like to thank Lucia di Ciaccio, Amanda Cooper-Sarkar, Fares Djama, Daniel Froidevaux, Joey Huston, Karl Jakobs, Max Klein, Ashutosh Kotwal, Witek Krasny, Tom LeCompte, Dan Levin, Guillaume Unal, and many others. We are also grateful to Philippe Charpentier and Olivier Schneider from LHCb. From the theoretical community, we acknowledge discussions with Stefan Berge, Walter Giele, Staszek Jadach, Pavel Nadolsky, Fred Olness, Fulvio Piccinini, and Zbyszek Was.
References
- [1] M. Awramik, M. Czakon, A. Freitas and G. Weiglein, Phys. Rev. D69, 053006 (2004).
- [2] M. Awramik, M. Czakon and A. Freitas, JHEP 11, 48 (2006).
- [3] ALEPH, DELPHI, L3, OPAL and SLD Collaborations, Phys. Rept. 427, 257 (2006).
- [4] D0 Collaboration, Phys. Rev. Lett 74, 2632 (1995).
- [5] CDF Collaboration, Phys. Rev. Lett. 74, 2626 (1995).
- [6] ALEPH, DELPHI, L3 and OPAL Collaborations, hep-ex/0612034.
- [7] S. Heinemeyer, W. Hollik and G. Weiglein, Phys. Rept. 425, 265 (2006).
- [8] UA2 Collaboration, Phys. Lett. B276, 354 (1992).
- [9] CDF and D0 Collaborations, Phys. Rev. D70, 092008 (2004).
- [10] CDF Collaboration, Phys. Rev. Lett. 99, 151801 (2007).
- [11] K. Melnikov and F. Petriello, Phys. Rev. D74, 114017 (2006).
- [12] ATLAS Collaboration, CERN/LHCC/99-15.
- [13] S. Haywood et al., hep-ph/0003275.
- [14] V. Buge et al., J. Phys. G34, N193 (2007).
- [15] ATLAS Collaboration, CERN/LHCC/99-14.
- [16] T. Sjostrand, S. Mrenna and P. Skands, JHEP 05, 026 (2006).
- [17] P. Golonka and Z. Was, Eur. Phys. J. C45, 97 (2006).
- [18] C. Balazs and C. P. Yuan, Phys. Rev. D56, 5558 (1997).
- [19] D. Froidevaux, L. Poggioli and E. Richter-Was, ATL-PHYS-98-131.
- [20] A. Rimoldi et al., ATLAS detector simulation: Status and outlook, Prepared for 9th ICATPP Conference on Astroparticle, Particle, Space Physics, Detectors and Medical Physics Applications, Villa Erba, Como, Italy, 17-21 Oct 2005.
- [21] ATLAS Collaboration, The ATLAS Experiment at the CERN Large Hadron Collider, submitted to JINST (2008).
- [22] E. Mirkes and J. Ohnemus, Phys. Rev. D50, 5692 (1994).
- [23] D0 Collaboration, Phys. Rev. D61, 032004 (2000).
- [24] S. Berge, P. Nadolsky, F. Olness and C. P. Yuan, Phys. Rev. D72, 033015 (2005).
- [25] C. M. Carloni Calame, G. Montagna, O. Nicrosini and M. Treccani, Phys. Rev. D69, 037301 (2004).
- [26] N. Besson and M. Boonekamp, ATL-PHYS-PUB-2006-007.
- [27] ATLAS Electromagnetic Barrel Calorimeter Collaboration, Nucl. Instrum. Meth. A568, 601 (2006).
- [28] Particle Data Group, J. Phys. G33, 1 (2006).
- [29] CDF and D0 Collaborations, Phys. Rev. D70, 092008 (2004).
- [30] CDF Collaboration, Phys. Rev. Lett. 100, 071801 (2008).
- [31] D. R. Yennie, S. C. Frautschi and H. Suura, Ann. Phys. 13, 379 (1961).
- [32] G. Nanava and Z. Was, hep-ph/0607019.
- [33] J. Pumplin et al., JHEP 07, 012 (2002).
- [34] P. M. Nadolsky, AIP Conf. Proc. 753, 158 (2005).
- [35] NA51 Collaboration, Phys. Lett. B332, 244 (1994).
- [36] FNAL E866/NuSea Collaboration, Phys. Rev. D64, 052002 (2001).
- [37] NuTeV Collaboration, Phys. Rev. D65, 111103 (2002).
- [38] V. Barone, C. Pascaud and F. Zomer, Eur. Phys. J. C12, 243 (2000).
- [39] F. Olness et al., Eur. Phys. J. C40, 145 (2005).
- [40] A. D. Martin, R. G. Roberts, W. J. Stirling and R. S. Thorne, Eur. Phys. J. C23, 73 (2002).
- [41] S. Alekhin et al., HERA and the LHC - A workshop on the implications of HERA for LHC physics: Proceedings Part A, (2005), hep-ph/0601012.
- [42] J. Pumplin et al., JHEP 02, 053 (2007).
- [43] J. C. Collins, D. E. Soper and G. Sterman, Nucl. Phys. B250, 199 (1985).
- [44] G. Miu and T. Sjostrand, Phys. Lett. B449, 313 (1999).
- [45] A. S. Gordon, Measurement of the W boson mass with the Collider Detector at Fermilab, FERMILAB-THESIS-1998-10.
- [46] A. Moraes et al., ATL-PHYS-PUB-2005-007.
- [47] A. Moraes et al., ATL-PHYS-PUB-2005-015.
- [48] O. S. Bruning, W. Herr and R. Ostojic, LHC-Project-Report-315.
- [49] ATLAS Collaboration, CERN/LHCC/96-41.
- [50] S. Berge, P. M. Nadolsky and F. Olness, Phys. Rev. D73, 013002 (2006).