Monitoring Supergiant Fast X-ray Transients with Swift.
Rise to the outburst in IGR J164794514.
Abstract
IGR J164794514 is a Supergiant Fast X–ray Transient (SFXT), a new class of High Mass X–ray Binaries, whose number is rapidly growing thanks to the INTEGRAL observations of the Galactic plane. It was regularly monitored with Swift/XRT since November 2007, to study the quiescent emission, the outburst properties and their recurrence. A new bright outburst, reaching fluxes above 10-9 erg cm-2 s-1, was caught by the Swift/BAT. Swift immediately re-pointed at the target with the narrow-field instruments so that, for the first time, an outburst from a SFXT where a periodicity in the outburst recurrence is unknown could be observed simultaneously in the 0.2–150 keV energy band. The X–ray emission is highly variable and spans almost four orders of magnitude in count rate during the Swift/XRT observations covering a few days before and after the bright peak. The X–ray spectrum in outburst is hard and highly absorbed. The power-law fit resulted in a photon index of 0.98, and in an absorbing column density of 51022 cm-2. These observations demonstrate that in this source (similarly to what was observed during the 2007 outburst from the periodic SFXT IGR J112155952), the accretion phase lasts much longer than a few hours.
Subject headings:
X-rays: individual: IGR J164794514. Stars: individual: IGR J1647945141. Introduction
Supergiant Fast X–ray Transients (SFXT) are a new class of High Mass X–ray Binaries associated with blue supergiant companions, several members of which were discovered thanks to the INTEGRAL observations of the Galactic plane (Sguera et al., 2005). They are sources with transient X–ray emission concentrated in short and bright flares (with a typical duration of a few hours), a peak luminosity in the range of 1036–1037 erg s-1 and a quiescent level of 1032 erg s-1 (e.g. in’t Zand, 2005). The short duration flaring activity is part of a longer accretion phase at a lower level (Romano et al., 2007).
IGR J164794514 is a hard X-ray transient discovered by INTEGRAL in 2003 August (Molkov et al., 2003). Hard X–ray activity was observed on August 8 and 9, at a level of mCrab (18–25 keV), while the following day the flux increased by a factor of 2. Other outbursts caught with INTEGRAL in 2003 and 2004–2005 were reported by Sguera et al. (2005) and Sguera et al. (2006), respectively, with peak fluxes above 10-9 erg cm-2 s-1 (20–60 keV). The recurrent and short outbursts observed from this source led to a suggestion that it belongs to the SFXT class.
A frequent hard X–ray (E20 keV) flaring activity was recently discussed by Walter & Zurita Heras (2007), who report on 27 short (duration 15 ks) flares and on 11 long (15 ks) flares in archival INTEGRAL data, spanning times from 2003 January 11 to 2005 December 2, with variable fluxes.
IGR J164794514 was observed once with XMM–Newton (Walter et al., 2006) in 2004 March, when it displayed a low level X–ray emission. The joint EPIC pn and ISGRI/INTEGRAL spectrum was successfully fit with an absorbed Comptonized spectrum, with an intrinsic column density of (7.7)1022 cm-2, an electron temperature keV, and optical depth . The unabsorbed 2–100 keV flux was 1.810-10 erg cm-2 s-1. An upper limit to the presence of an iron line could be placed at EW eV.
This source is normally detected in the Swift/BAT transient monitor111http://swift.gsfc.nasa.gov/docs/swift/results/transients/weak/IGRJ16479-4514/ (15–50 keV) at a level of 4 mCrab and showed 23 flares above 300 mCrab and 4.5 significance during the Swift mission up to 2008 March, including the ones that triggered the Swift/BAT on 2005 August 30 (Kennea et al., 2005), 2006 May 20 (Markwardt & Krimm, 2006), June 24, and 2007 July 29.
As reported in Romano et al. (2007), the Swift monitoring of the outburst of the periodic SFXT IGR J112155952 in 2007 February represents the deepest and most complete set of X–ray observations of an SFXT in outburst. We showed that the accretion phase during the bright outburst lasts longer than previously thought: days instead of hours, with only the brightest phase lasting less than one day. Stimulated by these Swift results, we are performing the first sensitive X–ray monitoring campaign of the activity of four SFXTs, IGR J164794514, IGR J173913021, IGR J175442619, and IGR J184100535, with the main aim of characterizing their activity on long timescales, both the quiescent state and the outbursts recurrence, and to test our model for the outburst mechanism (Sidoli et al., 2007), which involves the presence of a denser and slower equatorial wind component from the supergiant companion star. The results of the first four months of the on-going campaign with Swift, can be found in a companion paper (Sidoli et al., 2008, Paper I, see Fig. 1), where X–ray activity outside outbursts in IGR J164794514 is discussed. Here we report on the detailed data analysis of the 2008 March 19 outburst caught by Swift/BAT (Barthelmy et al., 2008) and followed at softer energies with Swift/XRT (Romano et al., 2008).
2. Observations and data analysis
Swift/BAT triggered twice on IGR J164794514 on 2008 March 19, first at 22:44:47 UT (trigger 306829, Barthelmy et al., 2008) while Swift had been observing it as part of our monitoring program, and then at 22:59:59 UT (trigger 306830). The spacecraft immediately slewed to the target, so that the narrow-field instruments started observing it s after the first trigger (the slew caused a s gap in the XRT data, and the XRT points up to s after the first BAT trigger were collected as one of our pointed observations).
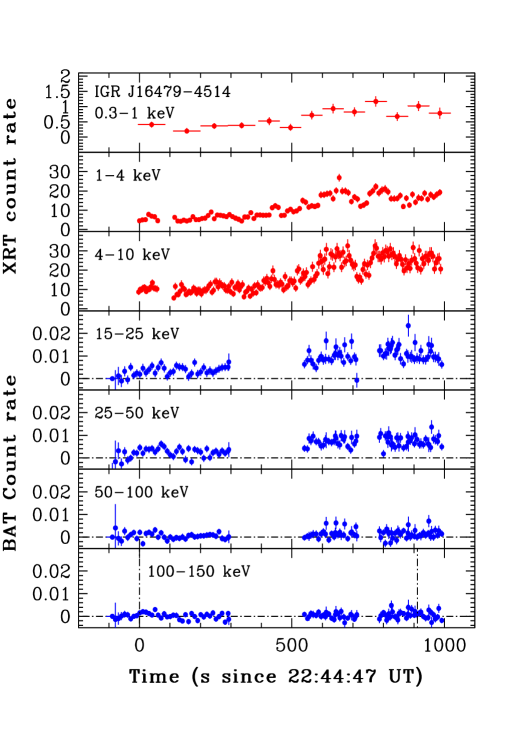
The BAT data were analysed using the standard BAT software within FTOOLS (Heasoft, v.6.4). Mask-tagged BAT light curves were created in the standard 4 energy bands, (Fig. 2), and rebinned to achieve a signal-to-noise of 5. BAT mask-weighted spectra were extracted over three time intervals strictly simultaneous with XRT data (Sect. 3, Fig. 3) from the three continuous streams of BAT data in Fig. 2. Response matrices were generated with batdrmgen.
The XRT data were processed with standard procedures (xrtpipeline v0.11.6), filtering, and screening criteria by using FTOOLS. We considered both WT and PC data, and selected event grades 0–2 and 0–12, respectively. To account for the background, we also extracted events within source-free regions. Ancillary response files were generated with xrtmkarf, and they account for different extraction regions, vignetting, and PSF corrections. We used the latest spectral redistribution matrices (v010) in CALDB. All quoted uncertainties are given at 90% confidence level for one interesting parameter unless otherwise stated.
3. Results
3.1. Light curves
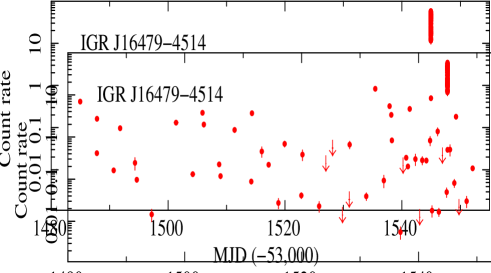
Figure 1 shows the Swift/XRT 0.2–10 keV light curve of IGR J164794514 throughout our 2008 monitoring program, background-subtracted and corrected for pile-up, PSF losses, and vignetting. All data in one segment were generally grouped in one point (with the exception of the March 19 outburst, which shows up as a vertical line on the adopted scale). The monitoring program started on 2007 October 26 with approximately two observations per week, but when the source showed signs of increased activity on March 10, the observations became almost daily.
Figure 2 shows the detailed light curves during the brightest part of the March 19 outburst in several energy bands. Figure 3 shows the 4–10/0.3–4 keV, 50–150/15–50 keV hardness ratios. Fitting the 4–10/0.3–4 keV hardness ratio as a function of time to a constant model yields a value of and for 8 degrees of freedom (d.o.f.). A general trend is observed for a spectral softening as the flux increases in the XRT bands.
During the 2008 March 19 outburst the peak count rate exceeded the one recorded on 2005 August 30 (Kennea et al., 2005; Sidoli et al., 2008) by a factor of . The total (0.3–10 keV) XRT light curve (Fig. 3a) shows an increase in count rate by a factor of in minutes, and an increase by a factor of in hours (comparing with the first earliest point, not shown in Fig. 3). A corresponding increase is observed in the BAT flux on timescales of minutes.
A timing analysis was performed on WT data ( s), after having converted the event arrival times to the Solar System Barycentric frame. We searched for coherent periodicity, but found no evidence in the range 10 ms–100 s.
3.2. Spectra
We extracted the mean spectrum of the brightest X-ray emission (obs. 00306829000) and performed a fit in the 0.3–10 keV band of the WT data, which were rebinned with a minimum of 20 counts bin-1 to allow fitting. An absorbed power-law model yielded an absorbing column of cm-2, a photon index , and (563 d.o.f., see Table 1). The unabsorbed flux in the 2–10 keV band is erg cm-2 s-1. A high-energy cutoff power-law model (cutoffpl in XSPEC) yielded cm-2, , , (562 d.o.f.). The Ftest probability with respect to the absorbed power-law model is (2.95 ), hence, since the cutoff energy is not well constrained, we favour the absorbed power-law model for the XRT data alone. We note however that a cutoff power-law yields a good fit to the joint XRT+BAT data. We also note that the derived is in excess of the one along the line of sight, cm-2.
The X-ray spectrum of the fainter emission (PC data, unabsorbed 2–10 keV flux of erg cm-2 s-1) is significantly softer: fitted using Cash statistics and adopting an absorbed power-law model model, we obtain and cm-2 (C-stat for 68.93% of 104 Monte Carlo realizations with statistics C-stat).
Upon examination of the best XRT hardness ratio (Fig. 3b), we accumulated spectra in five time bins which maximized the variations in hardness ratio and yielded –7500 counts per spectrum. Table 1 reports our results.
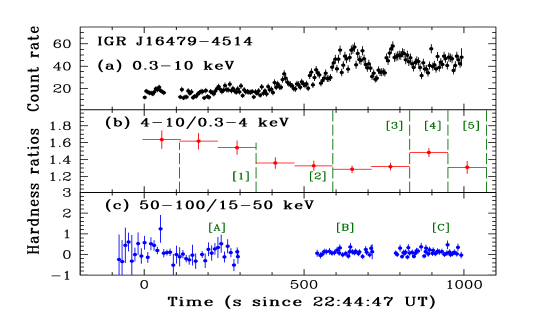
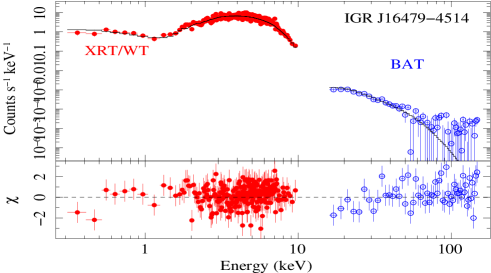
We extracted three XRT spectra simultaneous with the three BAT spectra in the time intervals 120–303 s, 541–723 s, and 793–1092 s since the BAT trigger ([A], [B], and [C] in Fig. 3), and performed joint fits in the 0.3–10 keV and 14–150 keV energy bands, for XRT and BAT, respectively, and applied an energy-dependent systematic error vector to the BAT data. Factors were included in the fitting to allow for normalization uncertainties between the two instruments, which were constrained to be within their usual ranges (0.9–1.1). Several models typically used to describe the X–ray emission from accreting pulsars in HMXBs were adopted. The results are reported in Table 2 and Fig. 4. We note that the fit to the BAT data alone obviously results in a steep power law with .
All models allow a good deconvolution of the 0.5–100 keV emission, resulting in a rather flat continuum below 10 keV together with a high–energy exponential cutoff (model highecut in XSPEC) at 8–20 keV (depending on the time interval). In the Comptonization model (compTT in XSPEC, Titarchuk 1994), we adopted a spherical geometry for the Comptonizing plasma, since both geometries allow an equally good deconvolution.
4. Discussion
| Spectrum | Mid Time | (d.o.f.)/ | ||
|---|---|---|---|---|
| (MJD) | (1022 cm-2) | C-stat (%) | ||
| Total WT | 54544.9551 | |||
| Part 1 | 54544.9511 | |||
| Part 2 | 54544.9522 | |||
| Part 3 | 54544.9555 | |||
| Part 4 | 54544.9569 | |||
| Part 5 | 54544.9596 | |||
| Total PC | 54544.9986 | 471.0 aaCash statistics and percentage of Monte Carlo realizations with statistic C-stat. |
We report on the first simultaneous broad band X–ray spectrum of IGR J164794514 in the 0.3–100 keV energy range. The source emission is well fit with the spectral models usually applied to the accreting X–ray pulsars: power laws with a high energy cutoff (White et al., 1983) and Comptonization models (Titarchuk, 1994). The resulting parameters are also very similar to those of this kind of X–ray binary sources.
The time-resolved spectroscopy of the joint XRT–BAT spectrum during the bright flare reveals that the initial part of the flare (part [A]) shows the flattest continuum below 10 keV, together with the lowest high energy cutoff, with respect to the subsequent brighter part of the emission (see Table 2, parts [B] and [C]), in all the three models adopted. No evidence is found for variability in the absorbing column density during the evolution of the bright flare, and also in comparison with the out-of-outburst emission (Sidoli et al., 2008). From optical/IR observations of the supergiant companion, Rahoui et al. (2008) derived an extinction A mag, which translates into an absorbing column density of 1022 cm-2 (Predehl & Schmitt, 1995) which is in excess of the total Galactic in the source direction (see Sect. 3). Thus there is evidence for neutral absorbing matter local to the binary system. Among the different models used to fit the broad-band spectrum, the Comptonization model yieded an compatible with the optical extinction, thus there is no strong evidence that an excess of absorption is local to the X–ray source (and that could be linked to the accreting clumps, if the supergiant wind is inhomogeneous). This could imply that the bulk of the neutral absorbing matter is circum-binary matter, instead of being associated with the accreting clumps (whose matter is very likely totally ionized when approaching the X–ray source). Although the statistics allow a constant value of (Table 2), a trend is found in the hardness ratio (Fig. 3b), which is decreasing with increasing flux, during the outburst. This is probably the indication of a reduced neutral gas column density, as the circumstellar gas is progressively ionized by the X–ray flare.
Before these observations, IGR J112155952 was the only SFXT observed in depth during an outburst (Romano et al. 2007, Sidoli et al. 2007). In that case, the occurrence of the outburst was predictable thanks to the periodic recurrence (Sidoli et al., 2006). For IGR J164794514 the outburst could only be caught thanks to our Swift monitoring campaign (Sidoli et al., 2008).
The source light curve before 54525 MJD (Fig. 1) has already been reported and discussed in Sidoli et al. (2008). It shows a smoothly variable flux, with a dynamic range of more than one order of magnitude, which apparently is sinusoidally modulated with a period of 24 days (although we caution that only about 2 periods of this suggested periodicity have been covered). During the most frequent monitoring (between 54535 and 54544 MJD) preceding the outburst, a highly variable source intensity was observed, with rates going up and down on short time scales of 1–2 days and spanning two orders of magnitude at maximum, before reaching the brightest peak. In the total light curve monitored with Swift, IGR J164794514 spanned almost four orders of magnitudes in flux in a few days. Moreover, the flux is highly variable on different time scales, from seconds to minutes, days and weeks, revealing a very intense flaring activity, both during the outburst and outside it (Sidoli et al., 2008).
The rise time to the peak (at an average rate of 17 counts s-1 on 54544.95 MJD) is at most 3 hrs. After the peak (also monitored by the BAT), the nearest XRT observation ( days later) found the source at a much fainter rate (0.085 counts s-1). This implies that the brightest phase of the outburst lasts one day at most, which is a behaviour similar to what observed in IGR J112155952 (Romano et al., 2007), where the bright emission lasted less than 1 day, and then was followed by a much weaker emission, although highly variable, with several shorter (but fainter) flares. This is also consistent with the duration of previous outbursts detected by the BAT.
| Spectrum | Parameters | ||||
|---|---|---|---|---|---|
| highecutplaa is the neutral hydrogen column density ( cm-2), the power law photon index, the cutoff energy (keV), the exponential folding energy (keV). | (keV) | (keV) | (dof) | ||
| Part A | 5.6 | 0.74 | 7.2 | 9.9 | 0.823 (150) |
| Part B | 5.7 | 1.24 | 6.9 | 17.7 | 0.982 (264) |
| Part C | 6.2 | 1.15 | 6.6 | 15.3 | 1.046 (301) |
| ccIn units of 1037 erg s-1 derived assuming a distance of 4.9 kpc. | ccIn units of 1037 erg s-1 derived assuming a distance of 4.9 kpc. | ||||
| Part A | 0.94 | 2.05 | |||
| Part B | 2.66 | 5.46 | |||
| Part C | 2.82 | 5.73 | |||
| cutoffplaa is the neutral hydrogen column density ( cm-2), the power law photon index, the cutoff energy (keV), the exponential folding energy (keV). | (keV) | (dof) | |||
| Part A | 5.4 | 0.170.40 | 7.4 | 0.845 (151) | |
| Part B | 5.8 | 1.0 | 15.3 | 1.042 (265) | |
| Part C | 6.5 | 0.97 | 13.5 | 1.108 (302) | |
| compTTbb is the temperature of the Comptonized seed photons, and are the temperature and the optical depth of the Comptonizing electron plasma (spherical geometry). | (keV) | (keV) | (dof) | ||
| Part A | 3.2 | 1.57 | 7.1 | 7.8 | 0.829 (150) |
| Part B | 2.8 | 1.360.11 | 12.0 | 5.3 | 0.962 (264) |
| Part C | 3.2 | 1.41 | 10.8 | 5.5 | 1.00 (301) |
Rahoui et al. (2008) classify the optical companion as an O8.5I star located at 4.9 kpc. This, together with the highly variable X–ray flux, confirms the classification as a SFXT. In these sources, a subclass of HMXBs, the accretion onto the compact object is very likely through the strong wind from the supergiant donor. The orbital parameters of IGR J164794514 as well as the nature of the compact object are still unknown, although the X–ray spectral properties are similar to those of accreting pulsars. Thus, the compact object is probably a neutron star, as in IGR J112155952, which hosts a pulsar with a period of 187 s (Swank et al., 2007).
Assuming the compact object is a neutron star and the typical parameters for an O-type supergiant (mass, –, a radius –, a beta-law for the supergiant wind with an exponent , a wind terminal velocity of 1800–2200 km s-1, and a wind mass loss of 2.510-6 yrs-1; Wilson & Dopita 1985), we can compare the expected X–ray luminosity for Bondi-Hoyle accretion with the observed X–ray emission. The fast ( hrs) rise to the brightest emission during outburst is difficult to explain with an enhanced accretion rate when the compact object approaches the O-type supergiant companion, along its orbit, if we assume a symmetric and homogeneous wind. The same behaviour was observed in the periodic IGR J112155952 (Sidoli et al., 2007). In this framework, the fainter X–ray emission (1034–1035 erg -1) preceding the bright outburst cannot be explained with an orbit with a period shorter than days, and an eccentricity lower than 0.5. A more detailed light curve modeling cannot be performed at this time, since the orbital parameters are currently unknown.
Facilities: Swift.
References
- Barthelmy et al. (2008) Barthelmy, S. D. et al. 2008, GRB Coordinates Network, 7466, 1
- in’t Zand (2005) in’t Zand, J. J. M. 2005, A&A, 441, L1
- Kennea et al. (2005) Kennea, J. A., Pagani, C., Markwardt, C., Blustin, A., Cummings, J., Nousek, J., & Gehrels, N. 2005, The Astronomer’s Telegram, 599
- Markwardt & Krimm (2006) Markwardt, C. B., & Krimm, H. A. 2006, The Astronomer’s Telegram, 816
- Molkov et al. (2003) Molkov, S., Mowlavi, N., Goldwurm, A., Strong, A., Lund, N., Paul, J., & Oosterbroek, T. 2003, The Astronomer’s Telegram, 176
- Predehl & Schmitt (1995) Predehl, P., & Schmitt, J. H. M. M. 1995, A&A, 293, 889
- Rahoui et al. (2008) Rahoui, F., Chaty, S., Lagage, P.-O., & Pantin, E. 2008, ArXiv e-prints 0802.1770
- Romano et al. (2008) Romano, P. et al. 2008, The Astronomer’s Telegram, 1435
- Romano et al. (2007) Romano, P., Sidoli, L., Mangano, V., Mereghetti, S., & Cusumano, G. 2007, A&A, 469, L5
- Sguera et al. (2005) Sguera, V. et al. 2005, A&A, 444, 221
- Sguera et al. (2006) —. 2006, ApJ, 646, 452
- Sidoli et al. (2006) Sidoli, L., Paizis, A., & Mereghetti, S. 2006, A&A, 450, L9
- Sidoli et al. (2008) Sidoli, L. et al. 2008, ApJ, in press (Paper I)
- Sidoli et al. (2007) Sidoli, L., Romano, P., Mereghetti, S., Paizis, A., Vercellone, S., Mangano, V., & Götz, D. 2007, A&A, 476, 1307
- Swank et al. (2007) Swank, J., Smith, D., & Markwardt, C. 2007, The Astronomer’s Telegram, 997
- Titarchuk (1994) Titarchuk, L. 1994, ApJ, 434, 570
- Walter & Zurita Heras (2007) Walter, R., & Zurita Heras, J. 2007, A&A, 476, 335
- Walter et al. (2006) Walter, R. et al. 2006, A&A, 453, 133
- White et al. (1983) White, N. E., Swank, J. H., & Holt, S. S. 1983, ApJ, 270, 711
- Wilson & Dopita (1985) Wilson, I. R. G., & Dopita, M. A. 1985, A&A, 149, 295