BEAUTY AND CHARM PRODUCTION CROSS SECTION MEASUREMENTS AT THE TEVATRON
Heavy quark production probes QCD at the interface of the perturbative and non-perturbative regimes. Studying the production of heavy quarks is an important test of models in both regimes. In this article, recent results on beauty and charm production from the CDF and DØ experiments at the Tevatron are reported. These include measurements of correlated production, the production cross section, and and polarization.
1 Introduction
The study of heavy quark production is an important test of models of both perturbative and non-perturbative quantum chromodynamics (QCD). Since the development of nonrelativistic QCD (NRQCD), the agreement between theoretical predictions and measured values of heavy quark production cross sections has improved greatly. However, recent and polarization measurements at the Tevatron indicate the understanding of heavy quark production is not yet complete.
The Tevatron at the Fermi National Accelerator Laboratory produces collisions with a center of mass energy of TeV. The Collider Detector at Fermilab (CDF) and DØ experiments employ general multipurpose detectors to reconstruct particle physics events from these collisions. With -hadron cross sections of 30 b , CDF and DØ have a wealth of experimental data on -hadrons.
2 Correlated Production
The cross section for producing, in hadronic collisions, both the and quarks centrally and above a given threshold is referred to as the correlation . The exact next-to-leading order (NLO) prediction of appears to be a robust perturbative QCD prediction, differing by only a few percent from the leading order (LO) prediction. However, Run I measurements of at the Tevatron are inconclusive, with an average ratio of the measured over the exact NLO prediction () of with a RMS deviation.
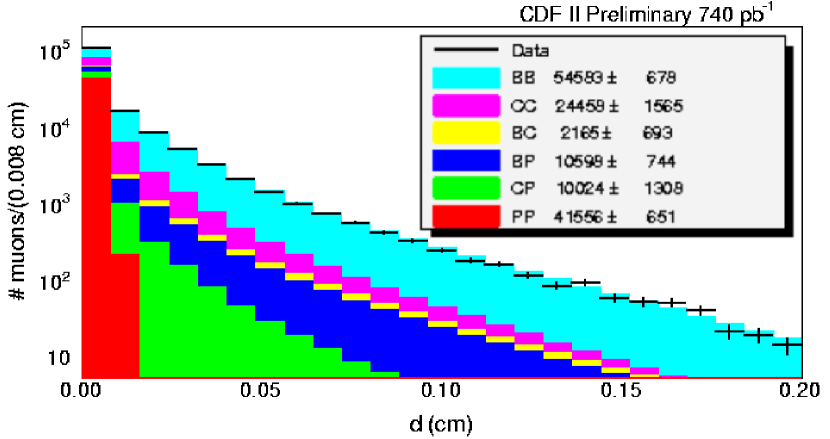
In this measurement, is obtained in pb-1 of CDF data using dimuon events with GeV/, , and invariant mass GeV/. This corresponds to pairs with GeV/ and rapidity . At the Tevatron, dimuon events mainly result from the decay of heavy quark pairs ( or ), the Drell-Yan process, the decay of charmonium and bottomonium, and the decay or misidentification of or mesons. To determine the and content of the data, we fit the impact parameter distribution of the muon tracks. The impact parameter is defined as the distance of closest approach of the track to the primary event vertex in the transverse plane, and it is proportional to the decay time of the parent particle.
The one-dimensional impact parameter distributions of muons from and decays are modeled by a tuned Herwig simulation, while the distributions of prompt muons are reconstructed using muons from decays in the data. Because the impact parameters of the two muons are to first order uncorrelated, the three 1D templates may be combined into six 2D templates to represent each possible dimuon source (, , , prompt-prompt, prompt-, and prompt-). These six templates are then used to perform a maximum likelihood fit to the 2D distribution of the impact parameter of both muons to extract the and components. The projection of the 2D impact parameter distribution is compared to the fit result in Figure 2.
From this fit, we measure the dimuon cross sections to be pb and pb, where the quoted error is the sum in quadrature of statistical and systematic uncertainties. In order to compare with theoretical predictions, we evaluate the NLO dimuon cross section using the MNR generator with the events decayed by EvtGen. This gives a value of pb, resulting in a ratio of . This measurement is in agreement with the NLO theoretical prediction, and does not confirm the anomalously high dimuon cross section observed in Run I.
3 Production Cross Section
Charmonium production provides another arena in which to test our understanding of QCD. The development of NRQCD was prompted in part by the CDF Run I measurements of and production cross sections. A new CDF measurement of the production cross section pushes the range farther into the perturbative QCD regime than was possible with Run I data.
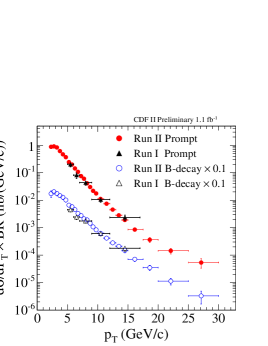
We reconstruct using 1.1 fb-1 of CDF data. We then perform an unbinned maximum likelihood fit in the mass and proper decay length distributions. The mass fit separates the signal from the background, while the fit separates promptly-produced from originating from secondary decays of long-lived particles (predominantly mesons). The range of 2 to 30 GeV/ is divided into 25 bins, and the signal yield and prompt fraction in each bin are extracted by the likelihood fit.
The acceptance depends upon the polarization. The CDF measurement of polarization is statistically limited, with only three measured data points. We take the average of these three data points as the effective polarization , where is defined according to Equation (1), and use this value to calculate the acceptance in each bin of .
The final result is shown in Figure 2, where the promptly produced are separated from those produced in decays. The CDF Run I measurement is also shown in Figure 2. The integrated cross section has increased by % from the Run I measurement, compared to a theoretical prediction of % for the change in center of mass energy from TeV to TeV. The integrated inclusive differential cross section is measured to be
4 Polarization of and
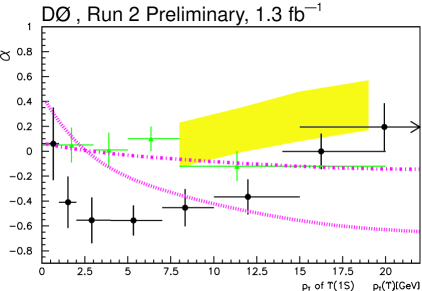
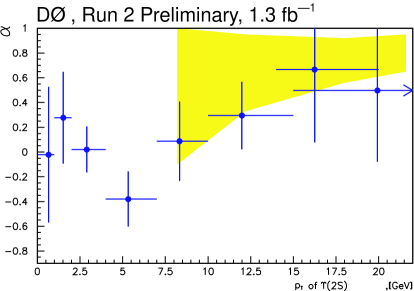
Recent measurements of the and polarization at CDF show significant longitudinal polarization with increasing , while NRQCD predicts transverse polarization at sufficiently high for -wave quarkonia produced in collisions. Now DØ presents new measurements of the and polarization, another important test of the theoretical approaches to QCD.
The polarization is measured in the parameter , defined as:
| (1) |
where and are the transverse and longitudinally polarized components of the cross section respectively. If the transverse and longitudinal states are equally populated, one measures ; for longitudinal polarization, , while for transverse polarizaton, . In quarkonia decay to a lepton and anti-lepton, may be obtained from the angular distribution
| (2) |
where is the angle between the in the lab frame and the positive lepton in the rest frame.
Using fb-1 of DØ data, we find 420 000 candidates. The data are divided into several bins in and , and the number of and in each bin are extracted from a fit to the mass distribution. The mass signal consists of three peaks, the , , and , where the mass differences between the peaks are fixed to the measured values. Unfortunately, the number of was insufficient to extract the angular distributions. The angular distribution in each bin is compared to and Monte Carlo samples which were generated with the parameter set to zero. The measured value of for the data is then determined by reweighting the angular distributions in the Monte Carlo. The dependence of on is plotted in Figure 3 for both and , along with various theoretical predictions. While statistics for the are insufficient to draw a conclusion, in the there is significant dependent longitudinal polarization which is only marginally consistent with any of the theoretical predictions.
5 Conclusions
Recent measurements of the correlation and the cross section at the Tevatron are in agreement with NLO and NRQCD predictions. However, measurements of quarkonia polarization in the same perturbative regime show discrepancies from theoretical predictions. Theoretical models are now challenged to match the polarization measurements while continuing to describe the cross section data.
Acknowledgments
We thank the Moriond QCD organizers for the invitation to attend this conference, and are grateful for the receipt of a travel grant from the European Union Marie Curie Program. We also thank the Fermilab staff and the technical staffs of the participating institutions for their vital contributions to this work, as well as the funding agencies supporting this work.
References
References
- [1] A. Abulencia et al. (CDF Collaboration), Phys. Rev. Lett. 99, 132001 (2007).
- [2] D. Acosta et al. (CDF Collaboration), Phys. Rev. D 71, 032001 (2005).
- [3] V. Abazov et al. (DØ Collaboration), Nucl. Instrum. Methods A 565, 463 (2006).
- [4] The detectors use a cylindrical coordinate system with the -axis along the proton beam direction. Rapidity is denoted by , while the pseudorapidity is defined as . Transverse momentum, , is the component of the particle momentum in the plane.
- [5] F. Happacher, P. Giromini, and F. Ptohos, Phys. Rev. D 73, 014026 (2006).
- [6] T. Aaltonen et al. (CDF Collaboration), submitted to Phys. Rev. D (Preprint hep-ex/0710.1895).
- [7] F. Abe et al. (CDF Collaboration), Phys. Rev. Lett. 79, 572 (1997).
-
[8]
CDF Collaboration, CDF Note 9074 (2007)
and references therein,
http://www-cdf.fnal.gov/physics/new/bottom/071018.blessed-psi2S-xsec. - [9] V. Abazov et al. (DØ Collaboration), submitted to Phys. Rev. Lett. (Preprint hep-ex/0804.2799).
- [10] W. M. Yao et al. (Particle Data Group), J. Phys. G 33, 1 (2006).
- [11] D. Acosta et al. (CDF Collaboration), Phys. Rev. Lett. 88, 161802 (2002).
- [12] E. Braaten and J. Lee, Phys. Rev. D 63, 071501 (2001).
- [13] S. P. Baranov and N. P. Zotov, Pis’ma v ZhETF 86, 499 (2007) (Preprint hep-ph/0707.0253).