Direct spectroscopic observations of clumping in O-star winds.
Abstract
We report the detection and monitoring of transient substructures in the radiation-driven winds of five massive, hot stars in different evolutionary stages. Clumping in the winds of these stars shows up as variable, narrow subpeaks superposed on their wide, wind-broadened (optical) emission lines. Similar patterns of emission-line profile variations are detected in the Of stars Puppis and HD93129A, in the more evolved hydrogen-rich, luminous, Of-like WN stars HD93131 and HD93162, and in the more mass-depleted WC star in Velorum. These observations strongly suggest that stochastic wind clumping is a universal phenomenon in the radiation-driven, hot winds from all massive stars, with similar clumping factors in all stages of mass depletion.
Subject headings:
line:profiles – stars: emission-line, Be – stars: mass-loss – stars: winds, outflows – stars: Wolf-Rayet1. Introduction
Evidence has been accumulating in the last two decades that hot stellar winds are far from being the smooth flows of escaping matter that were often conveniently assumed. Current observations are of sufficient quality to show that the strong, hot stellar winds of bright, population I Wolf-Rayet (WR) stars are systematically pervaded by inhomogeneities on different scales. Variability on time scales of minutes to hours is so far best described by a fully clumped wind with no smooth component (Lépine & Moffat, 1999; Lépine et al., 1999). This clumping may very well be related to small-scale radiative instabilities leading to strong shocks in the wind (Gayley & Owocki, 1995).
Is this phenomenon unique to the extremely dense winds of WR stars, or do other hot stars also have similar globally clumped winds which have been difficult to detect due to their weaker emission lines? Subsequent to our WR studies, we found that the Of star Puppis shows identical structure in its wind, as found (statistically) in WR stars (Eversberg et al., 1998): Pup’s optical He II 4686 emission line varies in exactly the same manner as the isolated HeII 5411 line in WN stars or CIII 5696 in WC stars. The variable emission component observed at very high S/N in Pup is also the same fraction of the total emission-line flux as in WR spectra, whose absolute amplitude is significantly less in O stars. This may explain why it had remained virtually unnoticed before in O stars. If this one O star is typical, then we expect to find the same stochastic emission-line variability in other O-star winds.
Other types of hot stars also exhibit clumpy structure in their winds. Examples include the [WC] nuclei of planetary nuclei (Grosdidier et al., 2003), novae (Lépine et al., 1999), supernovae (Mathewson et al., 2000) and possibly others that have not been examined properly yet.
Turbulent clumping in hot-star winds has a number of very important consequences, e.g. among the most important are: (1) Most current estimates of mass-loss rates, which are sensitive to the square of the density, have to be revised downwards by about a factor three with important implications for stellar evolution (Moffat & Robert, 1994). (2) Since clumps follow the mean flow, on average, they are turning out to be extremely useful in constraining the empirical wind velocity law, v(r), that is quite fundamental, but poorly known at present in hot-star winds; in particular, the convenient, popular interpolation -law appears to be only a rough approximation (Lépine & Moffat, 1999). (3) Wind clumps may ultimately provide the necessary means of compression and shielding required to form dust in some WR and nova winds (Williams et al., 1987; Cherchneff et al., 1995; Bode, 1995; Marchenko & Moffat, 2007). This might be relevant for dust formation in any type of star. The presumed associated decrease in the mass-loss rates could have a major effect on their evolution, slowing down the shedding of their envelope and delaying their eventual transfer to a WR stage.
| HD number | Other name | RA(2000) | Dec(2000) | V magnitude | Spectral type | Comment |
|---|---|---|---|---|---|---|
| HD 66811 | Puppis | 08 03 35.04 | -40 00 11.3 | 2.21 | O4I(n)f | single runaway |
| HD 93129A | 10 43 57.46 | -59 32 51.3 | 6.97 | O3If* | visual binary11Companion 0.05″from the primary (Nelan et al., 2004). | |
| HD 93131 | 10 43 52.25 | -60 07 04.0 | 6.48 | WN6ha | single | |
| HD 93162 | 10 44 10.33 | -59 43 11.4 | 8.11 | WN6ha | spectroscopic binary22Orbital period 207.7 days (Gamen et al., 2006). | |
| HD 68273 | Velorum | 08 09 31.95 | -47 20 11.7 | 1.81 | WC8+O7.5III-V | spectroscopic binary33Orbital period 78.5 days (De Marco et al., 2000). |
One way out, however, is via the still poorly-understood, intermediate, luminous blue variable (LBV) stage, which may provide the necessary strong episodic mass-loss to ultimately allow O stars to pass to WR stars (Smith, 2007). In the meantime, massive-star models have been vastly improved. Including rotation in the models, which is generally quite rapid for O stars, will tend to feed more H-rich fuel into the core region and increase the luminosity for a given mass, thereby allowing more O stars to become WR, and relaxing the requirement for unexplainably high mass-loss rates in the HRD isochrone fits to observations (Maeder & Meynet, 2000). Therefore, it appears particularly urgent to examine the clumping question in O-star winds of all types, so that evolutionary models for massive stars on/near the main sequence can be checked/constrained. This will increase our confidence in the age determinations of clusters and starbursts, which are turning out to be crucial tracers of star formation in the early Universe. It is also relevant in the question of the progenitors of the slow gamma-ray bursts, believed to arise in rapidly rotating WR stars (van den Heuvel, 2007). The rotation rate will be higher if the progenitor loses less mass on the way to becoming a WR star. In this context, it is interesting to note that clumping is still as strong in SMC WR stars at Z as at Z⊙ in the Galaxy (Marchenko et al., 2007).
Very recent studies using the indirect approach have revealed decreased mass-loss rates in O-star winds by factors of 3 or more (Bouret et al., 2005) to 10 or more (Fullerton et al., 2006). These are based on weak resonance and other lines in the far UV with the FUSE satellite. In the UV, the emission lines are stronger, but often saturated and in any case, it is difficult to obtain sufficiently high S/N. A recent complementary approach in the UV has been successful, however, in revealing variable features in the strong P Cygni absorption edges in the FUSE UV spectrum of the single WC8 star WR135 by Marchenko et al. (2006), linking the presence of overdense clumps with observed shocks.
In this study, we look for direct evidence for wind clumping in optical emission-lines generated in O-star and related winds. Clumping is detected in the acceleration zone near the base of the wind as transient, moving subpeaks on the emission-line profiles. Among O stars, Of stars are the easiest to examine, since they have emission lines in the optical, where it is possible to obtain high S/N spectra of these normally weak lines.
2. Observations
We observed two Of (one a repeat of previous observations of Pup) and two late-type, H-rich, weak-line, Galactic WN (super Of-like) stars intensively during three nights, 2000 January 25/26-27/28, at the 4m telescope at CTIO. Apart from Pup, the other three stars are all located in the Carina Nebula. Parallel observations of the bright WR star Vel (WC8 + O7.5III-V) were also observed as a check star for known clumps (Lépine et al., 1999). Basic data on our five targets are found in Table 1.
We used the bench-mounted échelle spectrograph giving an inverse dispersion of 0.06 Å per pixel and (2.7-pixel) resolving power R 30,000 over the 4200 - 5700 Å range. The slit was 1 wide. Typical elementary exposures of 10-1000 sec, depending on the stellar brightness, were combined from the CCD detector into one spectrum every 1-2 hours for each star, yielding net S/N 500 per pixel (no binning) after wavelet filtering (see below). Wavelengths were calibrated using Th-Ar spectra. An internal quartz-lamp was used for flat-fielding.
The bright échelle B3V flux standard Hya (Hamuy et al., 1992) was observed in an attempt to calibrate and splice together the échelle orders; however, its standard flux values turned out to be of too low resolution to be useful, so its use was abandoned. This forced us to treat each échelle order separately. In any case, this was not a serious impediment, as we chose to focus on the strongest, most isolated optical emission lines of HeII 4686 and HeII/H 4860 in each star. After some experimentation, we obtained final extracted spectra of good quality by dividing the spectra in order 9 by those in order 8 for HeII 4686 and order 7 by order 6 for HeII/H 4860. In all the stars, orders 8 and 6 were essentially devoid of emission lines and thus could be used as continuum reference spectra. This division by neighboring orders allowed us to eliminate the strong order sensitivity-function, and rectify the spectra without polluting the target emission lines significantly.
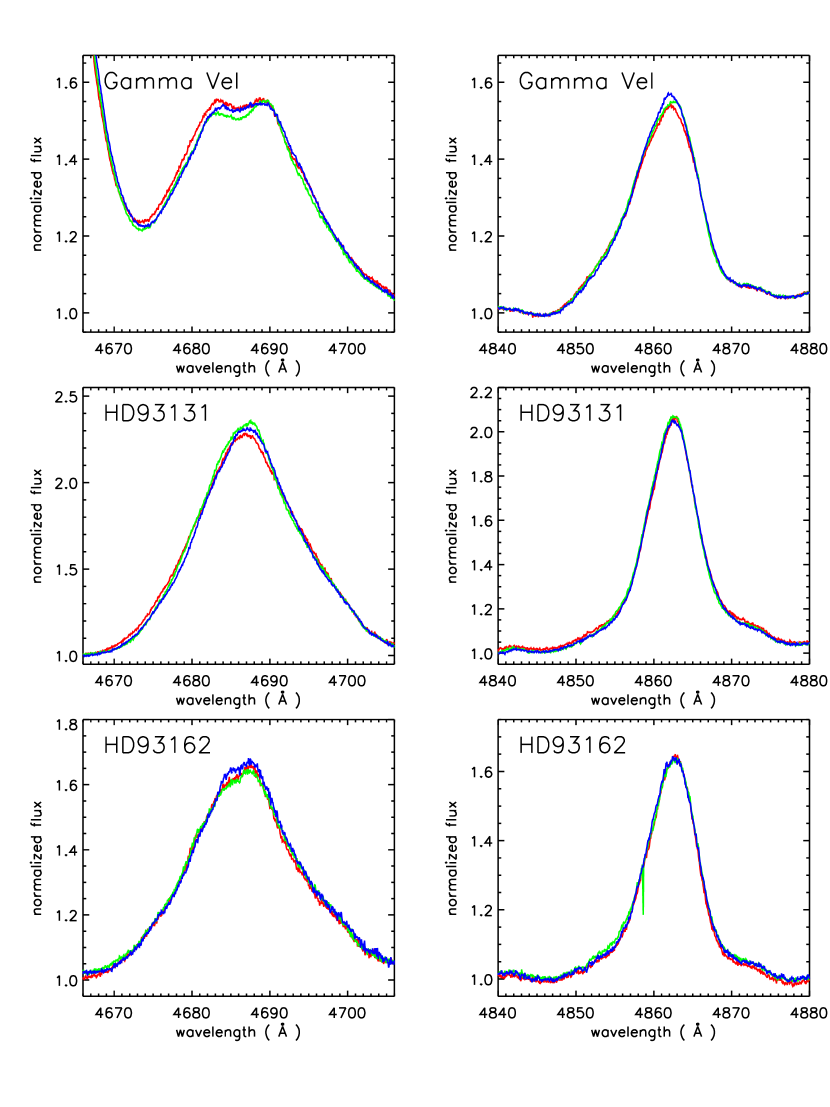
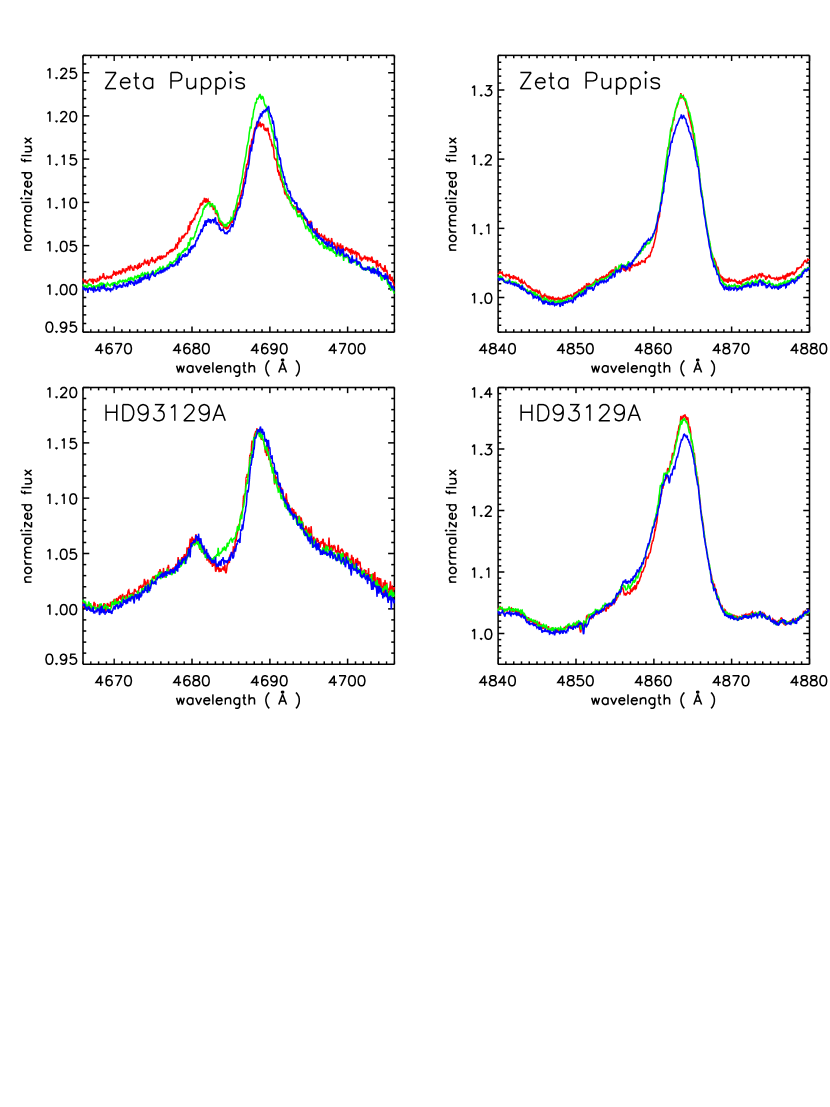
Nightly mean spectra for each of our 5 targets, are displayed in Figure 1 for the échelle orders covering the HeII 4686 and HeII/H 4860 atomic lines. All stars show those atomic lines strongly in emission, with large equivalent widths and very broad profiles which are typical of Wolf-Rayet and Of stars with strong, radiation-driven winds. Profiles from the Wolf-Rayet stars are dominated by the emission component, while profiles from the two Of stars show a slightly blue-shifted dip which is due to P Cygni type absorption from the stellar wind.
3. Analysis and results
We first examine whether there are significant global line variations from night to night in the P Cygni component, as seen before in the nightly spectra of Pup (Moffat & Michaud, 1981; Eversberg et al., 1998). The nightly means from each of the three nights are shown in Fig.1 in different colors. Significant night-to-night variations are observed in the WC star Vel and in the two Of stars Pup and HD 93129A. Variations are also apparent in the HeII 4686 line of the two WNha stars HD 93131 and HD 93162. The HeII 4686 line in Pup is found to display the most pronounced variations, which suggest that the intense line-profile variations discovered by Eversberg et al. (1998) might be an exceptional case.
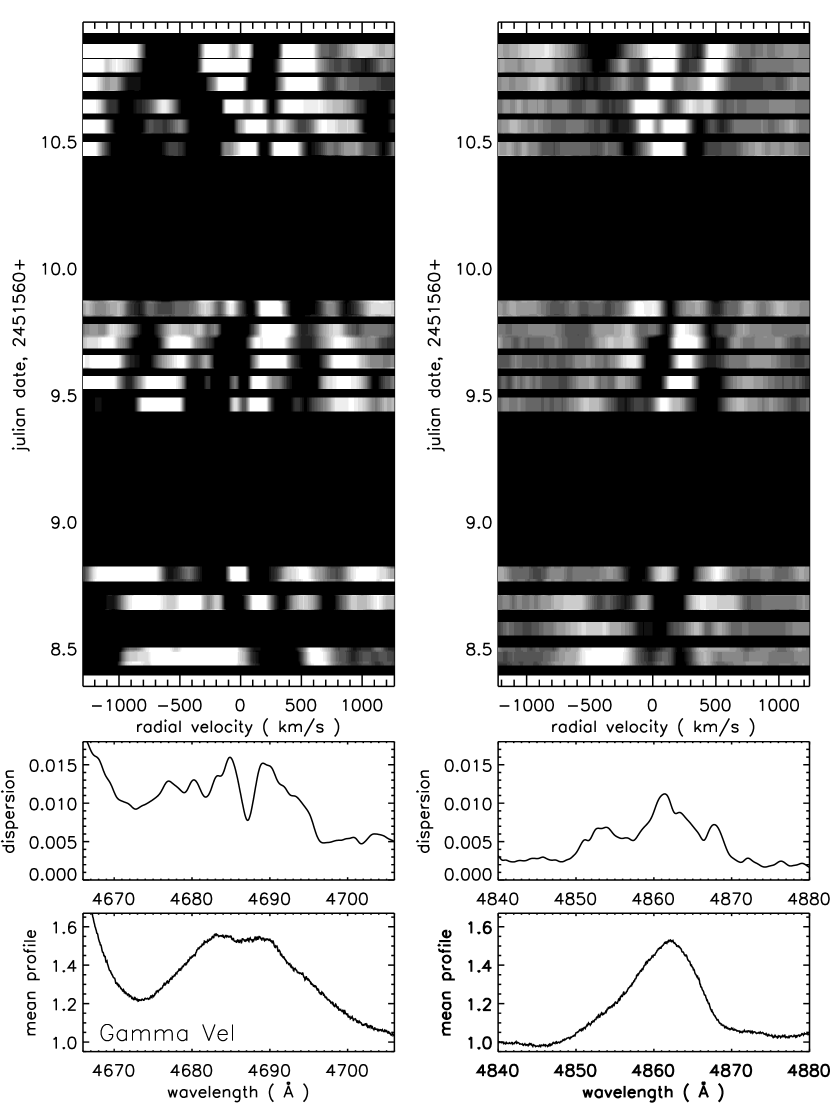
Variations on timescales of hours turn out to be much more interesting in all the stars. For each spectrum collected during the observing run, we subtracted the mean profile for the run. Despite all the calibration steps described in §2, many instrumental artifacts remain in the spectra at the 1% level. While these artifacts have little effect on the mean spectra, they do show up prominently in the residuals. Most artifacts are either of low or high frequency in wavelength/pixel space. We thus filtered all of these out below 0.5 Å and above 8 Å using wavelet transforms following the method of Lépine et al. (1999). This is fortunate, given that most of the intrinsic variations in Wolf-Rayet and Of star lines occur as narrow emission line features (subpeaks) on a 1-2 Å scale.
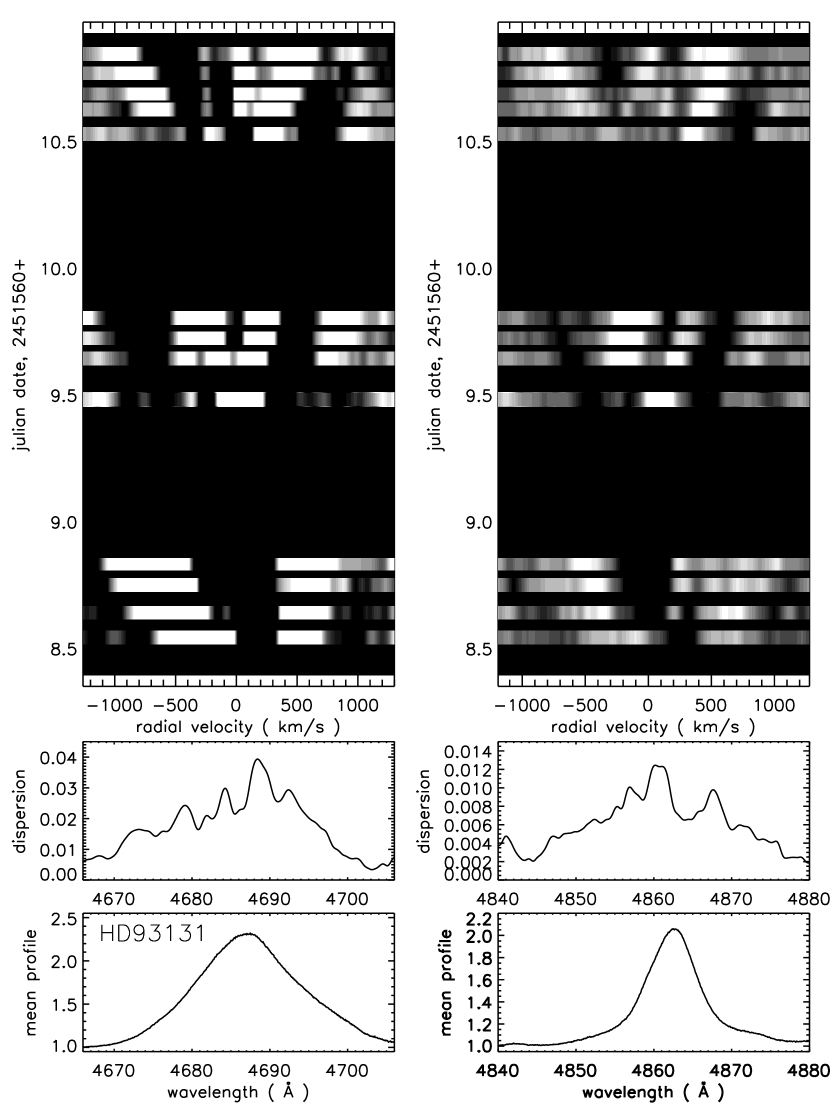
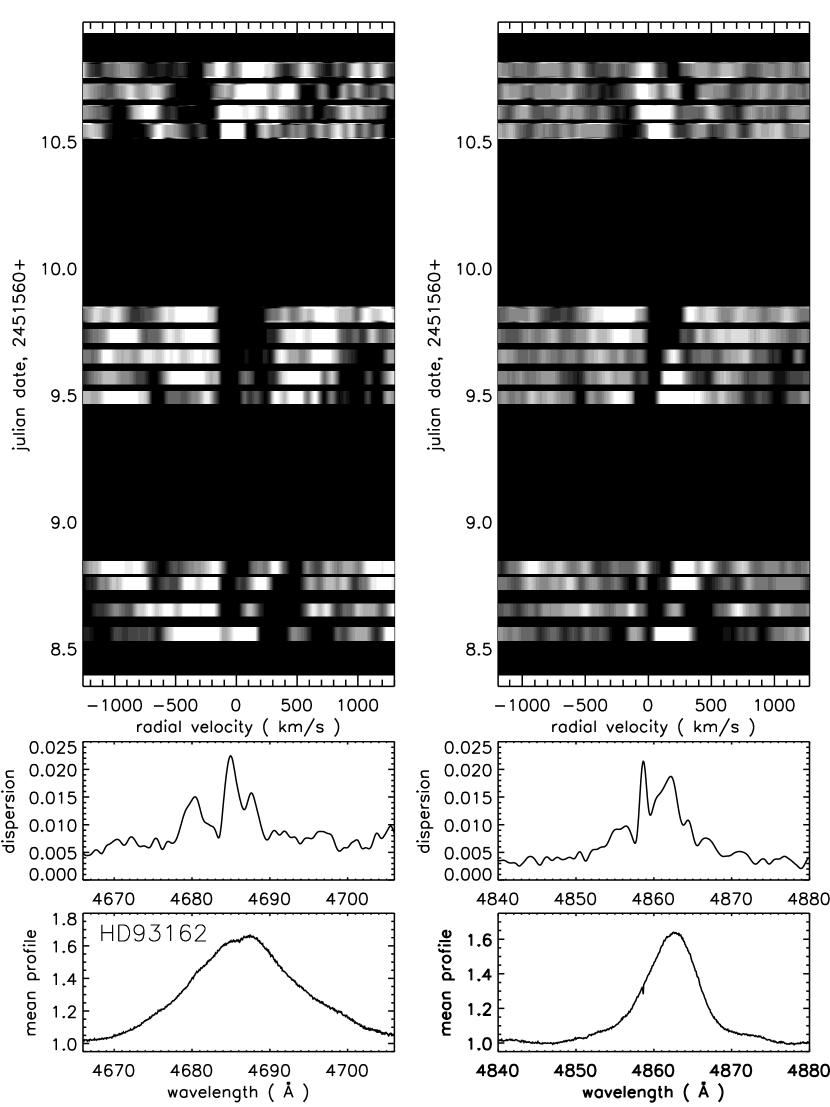
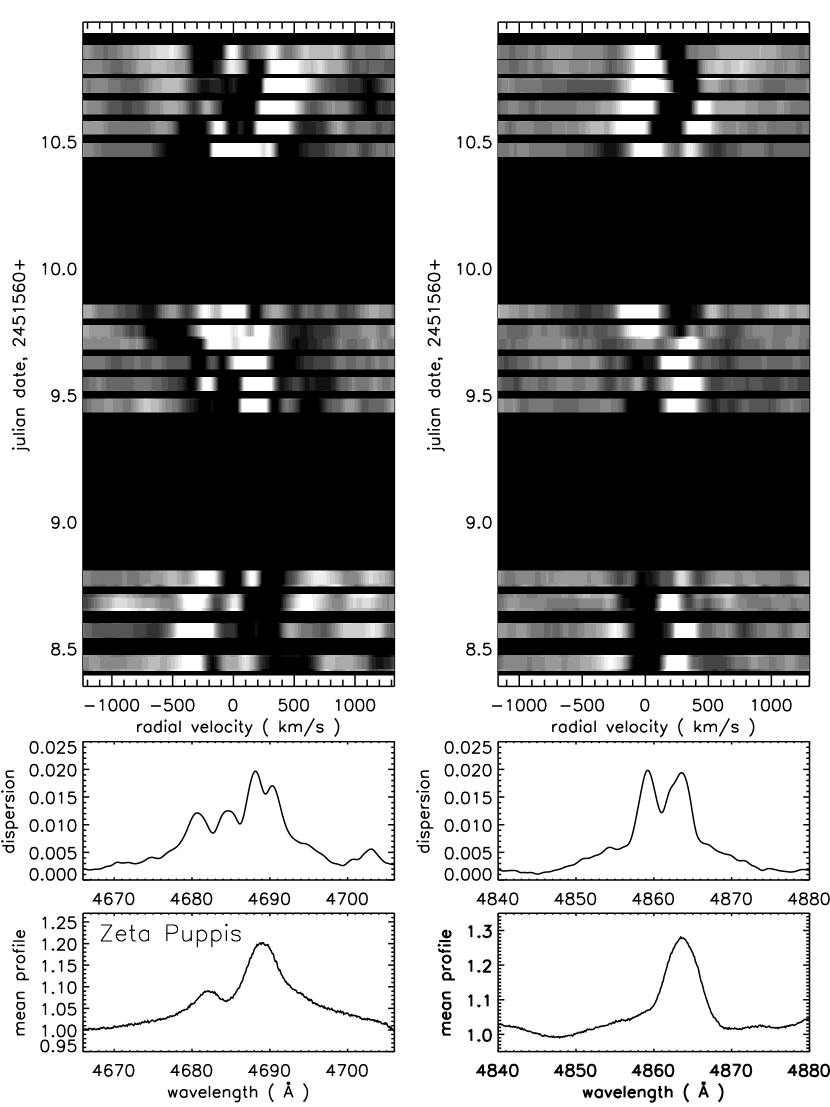
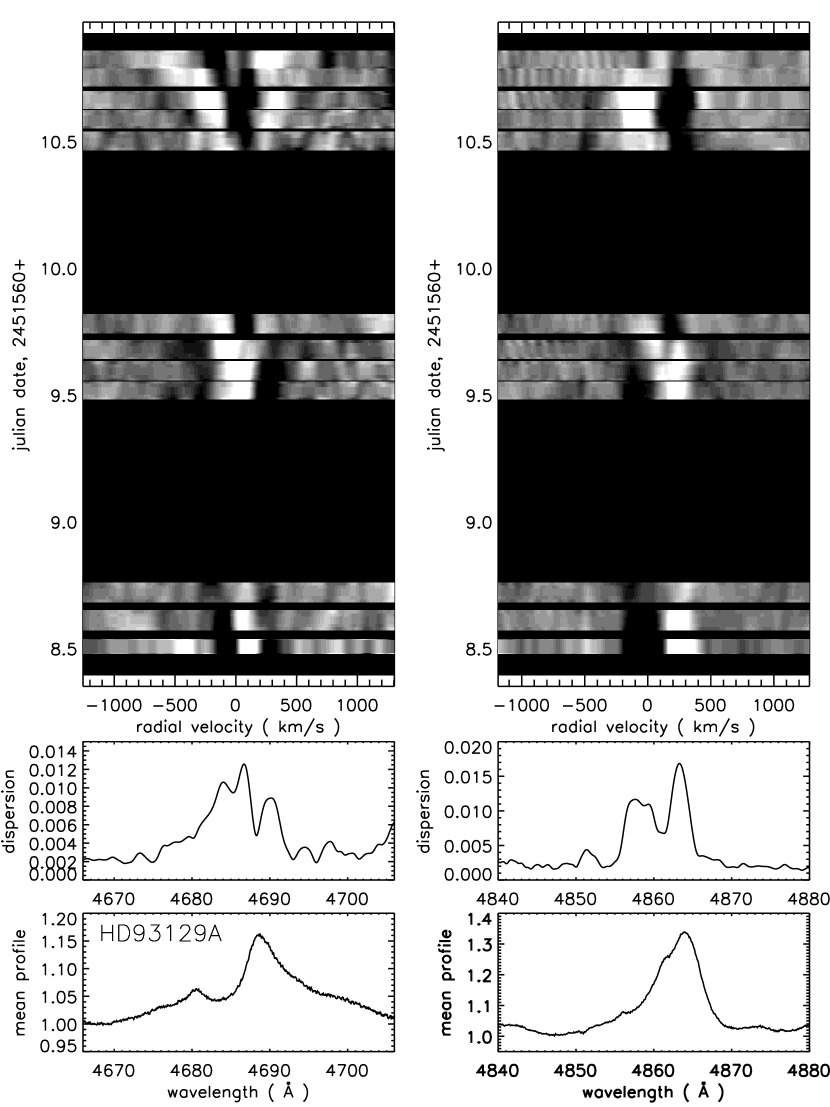
In Figs. 2, 3, and 4, variability in the emission lines of HeII 4686 (left) and HeII/H 4860 (right) are shown for each of our target stars. The mean profile for each line is displayed in the bottom panel. The middle panel plots the dispersion at each pixel for the entire observing run. The top panel is a two dimensional plot of the residuals (i.e. the instantaneous deviation from the mean profile) as a function of time and wavelength. Time runs upward on the vertical axis. The horizontal axis is labeled in units of radial velocity, calculated based on the redshift/blueshift of the emission line under consideration.
Significant variations are observed in all the lines examined. With variability occurring on timescales of hours, it is clear that at least some of this variation will average out in the nightly mean. The night-to-night variations noted in Figure 1 thus underestimate the variability in the line profiles. Conversely, the mean from all three nights can be confidently used as a base profile, and the residuals from this means (as shown in Figs.2, 3, and 4) will provide a good representation of the variable elements, be they either excess emission subpeaks or excess absorption troughs.
In all the target stars, both the HeII 4686 and HeII/H 4860 lines show variability which is extremely similar to that previously observed in WR spectra. The same general pattern of propagation outwards from the line center is apparent in all the stars for at least one of the nights. These indicate outwards acceleration in the winds of all these stars. According to the phenomenological models of Lépine & Moffat (1999), emission subpeaks in the line profile do not necessarily trace the acceleration of single, overdensities (clumps) in the wind. Rather, the emission subpeaks are likely the combined signature of numerous clumps, so the outwards motion of subpeak elements across the line may not be a measure of the true wind acceleration. In any case, in the one star where the acceleration is most apparent (HD 93131) subpeak profiles on the blue and red edges are observed to move by about 400 km/s over the course of one night (8 hours). This suggests an outward wind-acceleration rate on the order of 14 m s-2, which is consistent with acceleration rates measured in other Wolf-Rayet stars (Lépine & Moffat, 1999).


In Figure 5, we condense the variable information into plots of standard deviation per pixel across each line profile for all spectra collected over the three nights. Standard deviation profiles are all multiplied by a factor of 35, and compared with the mean profiles for each star. On this scale, the deviation profiles and mean emission-line profiles have similar amplitudes, which suggest that all lines show variability at the 3% level. This level of variability is on a par with previous data for 9 WR stars (Lépine & Moffat, 1999), the Of star Pup (Eversberg et al., 1998), and Vel (Lépine et al., 1999). The only exception is the He II profile in HD93162, whose variability is below the 1% level.
4. Discussion and conclusions
Our spectroscopic time-series show systematic variability on a timescale of hours in bright emission-line profiles from hot, massive stars with moderately strong winds. The emission lines examined here include lines which are significantly fainter, relative to the continuum, than the bright lines from Wolf-Rayet stars, where the phenomenon was first examined (Lépine & Moffat, 1999). We find that the amplitude of the variations are at the 1%-3% level of the line emission. This suggests that variability is universal in all emission lines, but that it is only apparent in the strongest of the lines.
While the variability profiles (), after rescaling, generally follow the underlying line profiles (), they do not match exactly on close examination. There are two possible causes for this: (1) the variability is strictly proportional to line emission, but the profile is distorted by an underlying absorption component, and/or (2) there exists an additional source of variability in the line profile, e.g. because of variations in an underlying absorption component, as in P Cygni absorption edges (e.g. Robert, 1992). The effects from distorted line profiles are most apparent in the lines of the Of stars, which are flanked by a blueward absorption component, and are strongly asymmetric relative to the rest wavelength. Despite this, however, we clearly observe (Fig.4) that the variability profile is roughly symmetric about the rest wavelength, which confirms our assertion that the variability is associated mainly with the emission component.
Overall, it appears that the clumps in the winds that cause the variable subpeaks across the emission lines, do indeed trace the wind. This would suggest that, within their turbulent speeds, the clumps obey essentially the same acceleration and velocity laws as the average wind itself. Indeed, the clumps are the wind! In fact, using extremely simple assumptions, Lépine & Moffat (1999) were able to simulate strong WR emission lines and their observed variability solely using a superposition of a very large number of discrete wind-emitting elements, without recourse to any kind of continuous background wind. This may not be proof of concept, but at least it is consistent with other astrophysically turbulent media such as the ISM (e.g. Stutzki, 1993). We would thus claim that hot-star winds are the (supersonic compressible) turbulent result of some kind of energy-input driving. Whether this occurs predominantly as a process of cascading dissipation from large to small scales (e.g. Henriksen, 1994) or of shock-merging aggregation from small radiative instabilities on sub-Sobolev (Owocki, 1994) to large scales (Feldmeier, 1995), remains to be demonstrated observationally.
The ratio is observed to vary between different lines, though only by a factor of a few at most for the same line in different stellar winds. The more pronounced case here is the star HD193162 in which HeII 4686 is more variable than HeII/H 4860 by about a factor of 3. This could be related to enhanced HeII 4686 emission from the highly turbulent zone of wind-wind collision between the components in this massive binary system. The variability levels are however remarkably similar between the various stars observed here. Since the intensity variations across optical (recombination) spectral lines vary with the square of the density, the clumping filling factor, which varies as the square root of this quantity, must actually show much less dispersion compared to the observed line-intensity variations, from one wind to another. From this, we deduce that most hot-star winds (O, WR, LBV) require nearly the same reduction factor in mass-loss rate of typically 3 (2-5 in the extreme) when the mass-loss rates are based on density-squared mechanisms. This result is in accord with the consensus on the ubiquity of the clumping phenomenon that came out of the recent workshop devoted entirely to clumping in hot-star winds (Hamann et al., 2008).
Our conjecture is that spectroscopic observations with even higher signal-to-noise ratio should reveal similar variability patterns in all emission-line profiles of stars with hot winds. Wind clumping is the probable source of the variability. The timescale is set by the time it takes for individual clumps to propagate through the layer in the wind from which line emission occurs. Different lines will show different patterns, depending on the height and depth of the layer where emission occurs. Emission lines formed in overlapping layers will have similar line-profile variability patterns. From a typical timescale of 6 hours and a wind velocity speed of km s-1, the typical depth of the emission layers is 2 107 km, or about 30 R☉, consistent with the idea that the lines are formed relatively close to the hydrostatic surface. All of these things should be tested with better future data.
References
- Bode (1995) Bode, M.F. 1995, IAU Symp. 163, 363
- Bouret et al. (2005) Bouret, J.-C., Lanz, T., & Hillier, D.J. 2005
- Cherchneff et al. (1995) Cherchneff, I., & Tielens, A. G. G. M. 1995, IAU Symp. 163, 346
- De Marco et al. (2000) De Marco, O., Schmutz, W., Crowther, P.A., Hillier, D.J., Dessart, L., de Koter, A., Schweickharddt, J. 2000, A&A, 358, 187
- Eversberg et al. (1998) Eversberg, T., Lépine, S., Moffat, A.F.J. 1998, ApJ, 494, 799
- Feldmeier (1995) Feldmeier, A. 1995, A&A, 299, 523
- Fullerton et al. (2006) Fullerton, A.W., Massa, D.L., Prinja, R.K. 2006, ApJ, 637, 1025
- Gamen et al. (2006) Gamen, R., Gosset, E., Morrell, N., Niemela, V., Sana, H., Nazé, Y., Rauw, G., Barbá , R., Solivella, G. 2007, A&A, 460, 777
- Gayley & Owocki (1995) Gayley, K.G., Owocki, S.P. 1995, ApJ, 446, 801
- Grosdidier et al. (2003) Grosdidier, Y., Moffat, A.F.J., Acker, A. 2003, IAUS, 212, 192
- Hamann et al. (2008) Hamann, W.-R. et al. 2008, International Workshop on Clumping in Hot-Star Winds, Potsdam, Germany, in press.
- Hamuy et al. (1992) Hamuy, M., Walker, A. R., Suntzeff, N. B., Gigoux, P., Heathcote, S. R., Phillips, M. M. 1992, PASP, 104, 533
- e.g. Henriksen (1994) Henriksen, R. N. 1994, Ap&SS, 221, 25
- van den Heuvel (2007) van den Heuvel, E. P. J. 2007, ASPC, 367, 549
- Lépine & Moffat (1999) Lépine, S., Moffat, A.F.J. 1999, ApJ, 514, 909
- Lépine et al. (1999) Lépine, S., Eversberg, T., Moffat, A.F.J. 1999, ApJ, 117, 1441
- Lépine et al. (1999) Lépine, S., et al. 1999, ApJ, 522, 121
- Lépine et al. (2001) Lépine, S., et al. 2001, AJ, 122, 3407
- Maeder & Meynet (2000) Maeder, A., Meynet, G. 2000, ARA&A, 38, 143
- Marchenko et al. (2006) Marchenko, S.V., Moffat, A.F.J., St-Louis, N., Fullerton, A.W. 2006, ApJ, 639, L75
- Marchenko & Moffat (2007) Marchenko, S.V., Moffat, A.F.J. 2007, in Proc. of Workshop “Massive Stars in Interacting Binaries”, eds. N. St-Louis & A.F.J. Moffat, ASPC, 367, 213
- Marchenko et al. (2007) Marchenko, S. V., Foellmi, C., Moffat, A. F. J., Martins, F., Bouret, J.-C., Depagne, E. 2007, ApJ, 656, 77
- Mathewson et al. (2000) Mathewson, T. et al. 2000, AJ, 120, 1499
- Moffat & Michaud (1981) Moffat, A.F.J., & Michaud, G. 1981, ApJ, 251, 133
- Moffat & Robert (1994) Moffat, A.F.J., & Robert, C. 1994, ApJ, 421, 310
- Nelan et al. (2004) Nelan, E.P., Walborn, N.R., Wallace, D.J., Moffat, A.F.J., Makidon, R.B., Gies, D.R., Panagia, N. 2004, AJ, 128, 323
- Owocki (1994) Owocki, S. P. 1994, Ap&SS, 221, 3
- e.g. Robert (1992) Robert, C. 1992, PhD thesis, Université de Montréal
- Smith (2007) Smith, N. 2007, in Proc. of Workshop “Massive Stars: Fund. Par. & Circumstellar Interactions”, eds. G. Bosch, C. Cappa, P. Benaglia, in press
- e.g. Stutzki (1993) Stutzki, R. 1993, Rev. in Modern Astronomy, no.6, p. 209.
- Williams et al. (1987) Williams, P.M., van der Hucht, K.A., Thé, P.S. 1987, A&A, 182, 91