A New Algorithm for Interactive Structural Image Segmentation
Abstract
This paper proposes a novel algorithm for the problem of structural image segmentation through an interactive model-based approach. Interaction is expressed in the model creation, which is done according to user traces drawn over a given input image. Both model and input are then represented by means of attributed relational graphs derived on the fly. Appearance features are taken into account as object attributes and structural properties are expressed as relational attributes. To cope with possible topological differences between both graphs, a new structure called the deformation graph is introduced. The segmentation process corresponds to finding a labelling of the input graph that minimizes the deformations introduced in the model when it is updated with input information. This approach has shown to be faster than other segmentation methods, with competitive output quality. Therefore, the method solves the problem of multiple label segmentation in an efficient way. Encouraging results on both natural and target-specific color images, as well as examples showing the reusability of the model, are presented and discussed.
1 Introduction
Semi-automated, or interactive, image segmentation methods have successfully been used in different applications, whenever human knowledge may be provided as initial guiding clues for the segmentation process. Examples of such methods are the region-growing technique, marker-based watersheds [16], the IFT [7], graph-cuts and Markov-random fields [1, 14, 15], amongst others.
Another source of a priori information for segmentation are image models, which consist of representative instances of desired objects, conveying different types of features (e.g. color, shape, geometry, relations, etc.) that describe such entities. Approaches guided by models are widely used for a variety of image processing purposes such as medical imaging [9, 11, 12, 13], face recognition and tracking [3, 6], and OCR [10].
Though the aforementioned interactive approaches have established remarkable contributions to the image segmentation domain, most of them have not attempted to consider image structure to aid the segmentation procedure. An attributed relational graphs (ARG) is a particularly useful representation not only for embedding structural information when modelling a problem, but also for expressing appearance features.
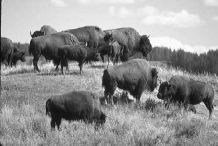
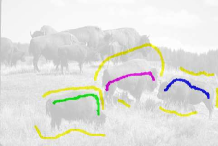
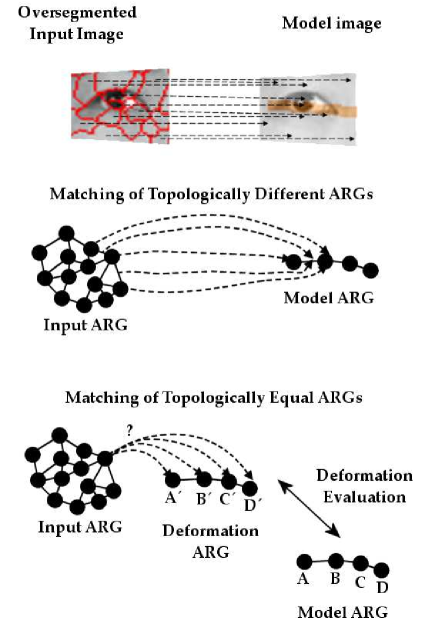
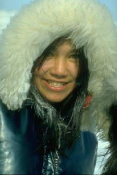
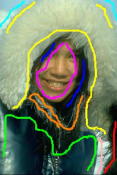
Regarding the segmentation issue, the present paper proposes a new algorithm for segmenting color images using both interactive cues and a model using an ARG-based representation. An object (fig. 1 left) is considered to be a set of parts (subset of pixels of an image) and their relations. An object model image is defined by a user according to traces drawn over the input (fig. 1 right). The input and model images are then represented by means of attributed relational graphs, in which objects and their relations are represented, respectively, as vertices and edges. Under this formulation, the segmentation problem is viewed as a graph matching procedure.
|
|
The introduced algorithm substantially improves the approach described in [4], in which structure was taken into account when segmenting an input gray-scale image according to a model, but the structures under comparison, represented by ARGs, often presented different topologies. Such differences imply difficulties to determine a suitable mapping between the input and model graphs, as well as high computational cost. As fig. 2 shows, the graph matching problem allows many possible solutions and therefore the optimization procedure not only has to consider vertex similarities, but it also has to evaluate various structural match configurations in order to rule out those which are not plausible for a final segmentation. However, this might be misleading when both topologies are distinct and cause the method to look down on potential solutions, such as when evaluating a match between an input edge connecting two input vertices which represent adjacent oversegmented regions related to two distinct objects and a model edge connecting model vertices which represent the the same previous objects.
In this paper, we propose a novel algorithm for the graph matching step. Each possible matching from an input ARG vertex to a model ARG vertex is seen as a deformation of the model graph (fig. 2), expressed by the introduction of the deformation ARG, which represents an altered version of the model ARG that preserves its topological properties while entailing attributes from the given input vertex. This new interpretation addresses the problem of matching two topologically different structures and results in a significantly faster segmentation method.
This paper is organized as follows. Section 2 presents our formal definition of attributed relational graphs for image representation. Section 3 gives an overview of all the steps of the segmentation method proposed herein. Section 4 describes the problem of image segmentation as a graph matching task, whereas Section 5 introduces the proposed segmentation algorithm based on an optimization technique for matching the input and model graphs. Finally, experimental results are discussed in Section 6 and a few conclusions, as well as suggestions for future work, are the topic of Section 7.
2 Graph-based representation
The representation of images using graphs and the matter of graph matching applied to pattern recognition and image processing have been explored in a variety of situations, such as those reported in the works of Bunke [2] and Conte et al [5], as well as in the method proposed by Felzenzswalb and Huttenlocher [8], and the classic work of Wilson and Hancock [17], among others.
In this paper, an attributed relational graph (ARG) is a directed graph formally expressed as a tuple , where stands for its set of vertices and , its set of edges. Typically, a vertex represents a single image region (subset of image pixels) and an edge is created between vertices representing two image regions. assigns an object attribute vector to each vertex of , whereas assigns a relational attribute vector to each edge of . denotes the number of vertices in , while denotes the number of edges in .
For color images, the object attribute vector is composed of the three average RGB values which characterize the corresponding image region, i.e. . When dealing with gray-scale images, , where denotes the average gray-level of the image region associated to vertex . Each component of is normalized between 0 and 1 with respect to the minimum and maximum possible gray-levels. Similarly, the relational attribute of an edge , , is defined as , where and are the centroids of their respective corresponding image regions. The factor is the largest distance between any two points of the input image region. Other attributes may easily be employed, since the methodology presented herein does not impose any restriction on the nature of and .
For the purpose of the segmentation method, three instances of such ARGs are considered: an input ARG , derived from the input image, a model ARG , representing the objects of interest selected by the user, and a deformation ARG , used as an auxiliary data structure for measuring deformations implied in the model when matching a vertex to another .
Subscripts shall be used to denote the corresponding graph, e.g. denotes a vertex of , whereas denotes an edge of . Similar notations are used for and as well.
3 Methodology overview
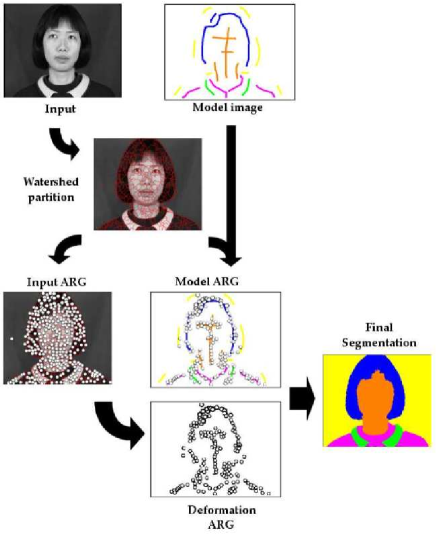
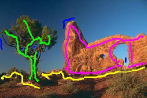
The segmentation process is depicted step-by-step in fig. 3. Given an input image to be segmented, the user first points out the target objects by placing traces over the input, thus creating a model image in which each color identifies an object of interest. Next, an oversegmentation is performed using the watershed algorithm to obtain a partition image where the real contours of each object are present.
This oversegmented image is used to create both an input ARG and a model ARG . The first is obtained in the following fashion: each watershed region gives rise to a vertex and its attributes, whereas adjacent regions devise an edge and its respective attributes. is obtained similarly, but only those watershed regions which intercept the user-defined traces result in a model vertex. Clearly, the input and model ARGs present different topologies and this fact must be accounted for when using structure as a segmentation guide.
Since the topological discrepancy is due to the oversegmentation caused by the watershed, the final segmentation should be a mapping of all such that input vertices related to image regions corresponding to the same model object are assigned to the same model vertex. This is equivalent to merging regions of an oversegmented object into a single region. The mapping of vertices from to those in characterizes a graph matching problem [2, 5]. Although many mappings are possible, a desirable solution should correspond to an image partition as similar to that defined by the model as possible. Thus, to ensure that the final mapping follows the model ARG topology, the deformation ARG is introduced. This graph is initialized as a copy of and it is used to help evaluate the local deformation effect that a given assignment between a vertex and another induces in the model. The pursued solution is one that minimizes such effects. In the next section, we discuss how these deformations are computed and how they fit in the graph matching problem solution.
4 The graph-matching algorithm for model-based image segmentation
A segmentation of the input image according to the model under the graph-based representation is a solution for the graph matching problem between and , characterized as a mapping . This implies finding a corresponding model vertex to each input vertex. Clearly, there are possible assignments for each input vertex and the decision of which to choose depends on an optimization procedure.
Let be an ARG initially equal to , i.e., , , , and . Let also and be two corresponding vertices in and respectively. Suppose that an assignment from a vertex to a vertex is under consideration. The quality of such an assignment may be assessed by computing the deformation which occurs in the model when this new vertex is merged with , causing the attributes of and to be fused with those from . After such merge, becomes a distorted version of the model in which:
| (1) |
and
| (2) |
or and with .
The impact of such deformation is then measured according to the following cost function:
| (3) |
The term is a measure of the deformation between the object attributes of and and it is defined as:
| (4) |
Although the RGB color space was chosen to describe the color appearance feature of an object, other color spaces, such as the Lab, might as well be used with appropriate metrics adaptation.
Similarly, if and is its corresponding edge, then is a measure of the deformation between both edges defined as:
| (5) |
The value is the angle between and , whereas, the parameter , , controls the weights of the modulus and angular dissimilarities. Thus, the total impact caused on the edges directly connected by is computed as the modulus and angular differences between the relational attribute vectors of each pair .
Therefore, the cost function measures how the merging of a vertex with a copy of a model vertex affects the local structure of the graph, as well as the appearance attributes it holds. The parameter , , controls the importance of the appearance or structural effects of all vertex mappings.
5 The optimization algorithm
To map to and estimate the adequacy of each vertex assignment using , the following algorithm was devised:
-
1.
define
-
2.
define
-
3.
for each vertex
-
4.
-
5.
-
6.
for each vertex
-
7.
-
8.
-
9.
for each s.t. or ,
-
10.
vector between centroids of and
-
11.
compute the value of the cost function (eq. 3)
-
12.
if
-
13.
-
14.
-
15.
label()
All possible assignments for each vertex are evaluated and the final label of corresponds to the model vertex which was affected the least by the deformation caused by the introduction of . At each iteration, a vertex from receives a label. is the minimum deformation cost obtained so far and is the corresponding model vertex to which was mapped resulting in such minimal deformation. The output of the algorithm is a mapping of all vertices of to vertices of .
6 Experimental results
|

|


|
|
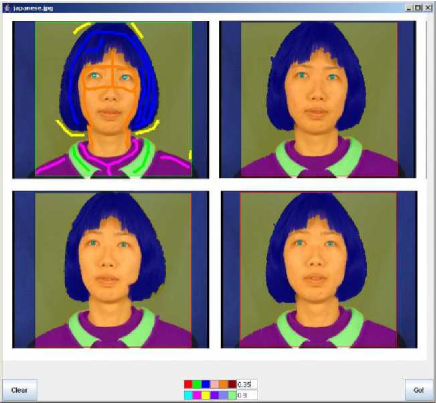
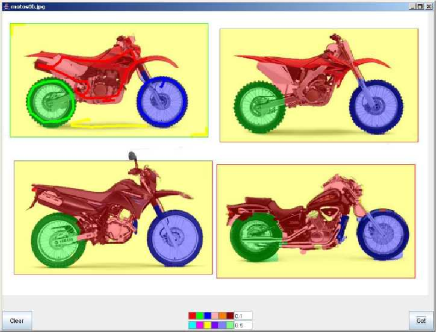
In order to test the presented technique, a Java application was designed and implemented 111Please refer to the accompanying demo video.. Its interface allows the user to load images to be segmented, define a model according to traces drawn over different regions of interest, and choose the and parameters of the cost function (eq. 3), therefore specifying how to favor structure against appearance features.
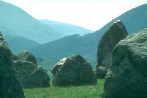
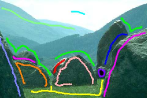
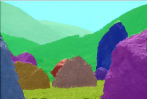
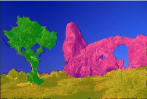
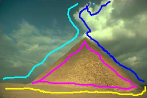
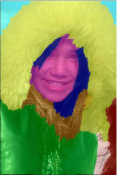
Figure 4 shows a few segmentation results for the application of the methodology to natural color images obtained from the Berkeley Image Segmentation Database 222http://www.eecs.berkeley.edu/Research/Projects/CS/vision/grouping/segbench/. All resulting images depict the final regions labelled according to the color of the traces defined by the user. Transparency was used over the labelled segmented images in order to visualize more precisely what areas have been classified as a given object. Although certain image regions, such as the mountains and the face, present high variability due to textures or different objects grouped as one in the model, the final segmentation remains accurate and robust thanks to the structural constraints embedded in the model.
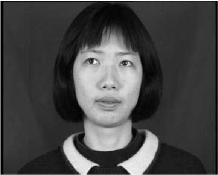
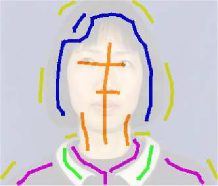
Tests for the reusability and robustness of the model were also performed on sample frames of a moving head video (fig. 5 top) from the XM2VTS Database 333http://www.ee.surrey.ac.uk/CVSSP/xm2vtsdb/ and on a set of similar images retrieved randomly from the web (fig. 5 bottom). Each model was defined once by the user in the first image of each set and then applied to the other similar images. The latter step is interactively accomplished as follows: once the user draws the traces over the first image, a minimum enclosing rectangle of the strokes is automatically defined. This rectangle, called a stamp, can later be applied by the user to other images and segmentation can be performed within such area.
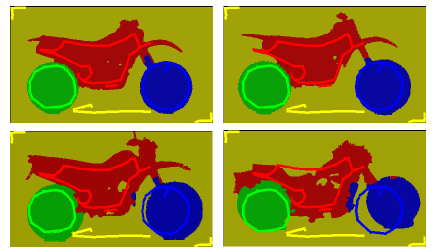
Note that the model ARG is derived only once for the first image and then used in the segmentation process of all other input images. It is important to notice that simply applying the same strokes to the other images would not produce the same model as the one obtained for the first time, as fig. 6 depicts. This also shows that the model is robust enough to treat small variances presented by the input images under analysis. For each image set, the overall structure remained similar and the segmentation was once again satisfactory even though the model was derived from an image with different appearance features.
The new algorithm proposed for the graph matching step presents faster performance than that of the algorithm reported in [4]. While the present algorithm runs in time proportional to , the other is bounded by a function . Besides this, the optimization algorithm does not depend on the order in which vertices from the input are labelled, since each vertex is treated separately when analysed during the graph matching step.
 |
 |
7 Conclusion
This paper proposed a novel algorithm for performing interactive model-based image segmentation using attributed relational graphs to represent both model and input images. This approach allows the usage of information ranging from appearance features to structural constraints. Topological differences between graphs are dealt with by means of a deformation ARG, a structure which allowed the design of an optimization algorithm for graph matching that evaluates possible solutions according to local impacts (or deformations) they determine on the model. The faster performance of the algorithm in comparison with the one proposed in [4], the reusability of the model graph when segmenting several images, as well as the satisfying quality of the results due to the adequate use of structural information, characterize the main contributions of the method.
Our ongoing work is devoted to reducing interaction when reusing the model to segment various images. For now, it is required that the user places the stamp over the area of interest of the image. In the future, we hope to be able to apply the model ARG without the need of this interactive positional information. This shall be accomplished through the investigation of MAP-MRF methods applied within this framework in order to make more robust models and improve segmentation quality under different conditions such as object translation and rotation. Furthermore, we intend to perform a quantitative study to compare the accuracy of our results with those of other related methods.
References
- [1] A. Blake, C. Rother, M. Brown, P. Pérez, and P. H. S. Torr. Interactive image segmentation using an adaptive GMMRF model. In European Conference on Computer Vision, pages 428–441, 2004.
- [2] H. Bunke. Recent developments in graph matching. In Intl. Conference on Pattern Recognition, pages 2117–2124, 2000.
- [3] R. M. Cesar-Jr., E. Bengoetxea, I. Bloch, and P. Larrañaga. Inexact graph matching for model-based recognition: Evaluation and comparison of optimization algorithms. Pattern Recognition, 38(11):2099–2113, 2005.
- [4] L. A. Consularo, R. M. Cesar-Jr, and I. Bloch. Structural image segmentation with interactive model generation. In Proc. of the IEEE International Conference on Image Processing, ICIP 2007, volume 6, pages 45–48, San Antonio, Texas, USA, 2007.
- [5] D. Conte, P. Foggia, C. Sansone, and M. Vento. Thirty years of graph matching in pattern recognition. Intl. Journal of Pattern Recognition and Artificial Intelligence, 18(3):265–298, 2004.
- [6] D. DeCarlo and D. Metaxas. Adjusting shape parameters using model-based optical flow residuals. IEEE Trans. on Pattern Analysis and Machine Intelligence, 24(6):814–823, June 2002.
- [7] A. X. Falcão, J. Stolfi, and R. A. Lotufo. The image foresting transform: Theory, algorithms, and applications. IEEE Trans. on Pattern Analysis and Machine Intelligence, 26(1):19–29, Jan 2004.
- [8] P. F. Felzenszwalb and D. P. Huttenlocher. Efficient graph-based image segmentation. Intl. Journal of Computer Vision, 59(2):167–181, 2004.
- [9] D. Freedman, R. J. Radke, T. Zhang, Y. Jeong, D. M. Lovelock, and G. T. Y. Chen. Model-based segmentation of medical imagery by matching distributions. IEEE Trans. on Medical Imaging, 24(3):281–292, 2005.
- [10] Y.-S. Lee, K. Papineni, S. Roukos, O. Emam, and H. Hassan. Language model based arabic word segmentation. In ACL ’03: Proc. of the 41st Annual Meeting on Association for Computational Linguistics, pages 399–406, Morristown, NJ, USA, 2003. Association for Computational Linguistics.
- [11] W. J. Niessen, C. M. van Bemmel, A. F. Frangi, M. J. A. Siers, and O. Wink. Model-based segmentation of cardiac and vascular images. In ISBI - Proc. of the 2002 IEEE International Symposium on Biomedical Imaging, pages 22–25, 2002.
- [12] S. D. Olabarriaga and A. W. M. Smeulders. Interaction in the segmentation of medical images: a survey. Medical Image Analysis, 5-2:127 – 142, 2001.
- [13] A. Perchant and I. Bloch. A New Definition for Fuzzy Attributed Graph Homomorphism with Application to Structural Shape Recognition in Brain Imaging. In IMTC’99, 16th IEEE Instrumentation and Measurement Technology Conference, pages 1801–1806, Venice, Italy, 1999.
- [14] C. Rother, V. Kolmogorov, and A. Blake. ”GrabCut”: interactive foreground extraction using iterated graph cuts. In ACM SIGGRAPH 2004 Papers, pages 309–314, New York, NY, USA, 2004. ACM Press.
- [15] A. K. Sinop and L. Grady. A seeded image segmentation framework unifying graph cuts and random walker which yields a new algorithm. In Proc. of the International Conference on Computer Vision. IEEE Computer Society, IEEE, October 2007.
- [16] P. Soille. Morphological Image Analysis: Principles and Applications. Springer Verlag, 1999.
- [17] R. C. Wilson and E. R. Hancock. Structural matching by discrete relaxation. IEEE Trans. on Pattern Analysis and Machine Intelligence, 19(6):634–648, 1997.