Statistical Analysis of the Metropolitan Seoul Subway System: Network Structure and Passenger Flows
Abstract
The Metropolitan Seoul Subway system, consisting of 380 stations, provides the major transportation mode in the metropolitan Seoul area. Focusing on the network structure, we analyze statistical properties and topological consequences of the subway system. We further study the passenger flows on the system, and find that the flow weight distribution exhibits a power-law behavior. In addition, the degree distribution of the spanning tree of the flows also follows a power law.
keywords:
passenger flow , transportation , subway , power lawPACS:
89.75.Hc , 89.40.Bb , 89.65.LmComplex networks have been an active research topic in the physics community since models for complex networks were announced [1, 2]. Subsequently, numerous real networks observed in biological and social systems as well as physical ones have been studied [3, 4, 5, 6, 7, 8, 9, 10, 11, 12, 13, 14, 15]. Those studied also include transportation systems such as airline networks, subway networks, and highway systems. For example, studies of world-wide airport networks as well as Indian and Chinese airport networks have disclosed small-world behaviors and truncated power-law distributions [6, 7, 8, 9, 10]. For the subway systems in Boston and Vienna, various network properties, such as the clustering coefficient and network size, have been reported [11, 12]. Further, statistical properties of the Polish public transport network have been examined [13] and the Korean highway system has been analyzed with respect to the gravity model [14].
In this manuscript, we consider the Metropolitan Seoul Subway (MSS) system, which consists of stations, and serves as the major public transportation mode in the greater Seoul area, Republic of Korea. The system in an earlier phase was analyzed with regard to the accessibility measurement [16]. In the present phase, the maximum distance between a pair of stations in the system is while the minimum value is . When we construct the subway network with nodes, each corresponding to a station, the number of links connecting two nearest nodes turns out to be 424. The characteristic path length is defined in terms of the network distance , which represents the shortest path length between nodes and . Usually, the clustering coefficient also provides an important measure for a complex network. However, since a few nodes of the subway system have only one nearest neighbor, the clustering coefficient is not well defined. Accordingly, we define the clustering coefficient of the subway system, excluding the nodes which have one neighbor. The eccentricity of node corresponds to the greatest distance between and other node. The radius and the diameter of a network are then defined to be the minimum eccentricity and the maximum eccentricity, respectively, among all nodes. We further define the efficiency according to
| (1) |
In the ideal case for the efficiency , all nodes are connected to each other, so that the network of nodes has links. Normalizing the efficiency to that in the ideal case, we obtain the network efficiency , which takes a value between zero and unity: .
We carry out measurement of the above quantities for the MSS network and show the results in Table 1. Note that unlike, e.g., an airline network, it is not conceivable for a subway network to have all-to-all connections between stations. The number of links in a real network of stations should be far less than , thus leading to the small value of the network efficiency . On the other hand, it is desirable to build the network in such a way that the physical distance measured along the links between a pair of stations is as short as possible, compared with the actual distance (along the straight line) between the two. Accordingly, it is more appropriate to use the physical distance rather than the network distance in measuring the network efficiency . Whereas the value of in the network distance represents the efficiency with respect to the ideal but unrealistic network (with all-to-all connections), the value in the physical distance measures the efficiency with respect to the optimal network in reality. In terms of the physical distance, the characteristic path length, diameter, and radius are given by km, km, and km, respectively.
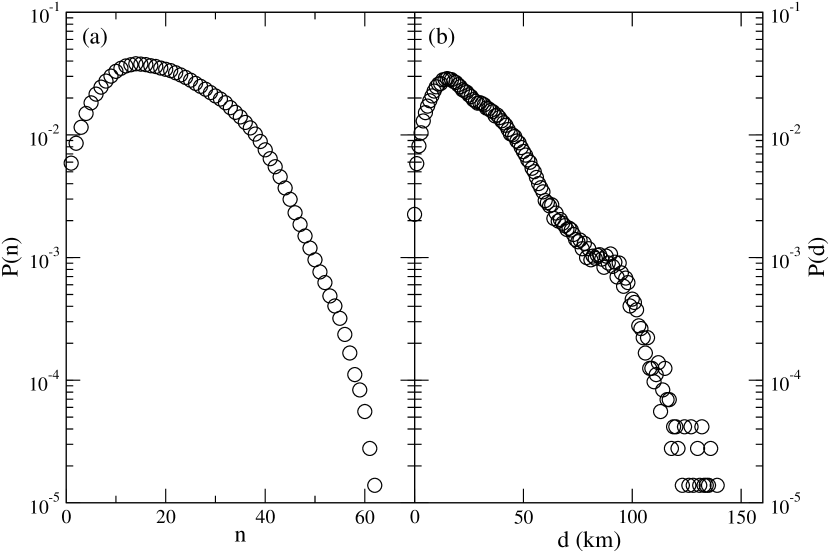
Figure 1 exhibits the distribution of the shortest path lengths, (a) in terms of the network distance (or path length) and (b) in terms of the physical distance. Namely, the horizontal axis of Fig. 1(a) represents the number of links between a pair of nodes (stations) while that of (b) the physical distance between them.
We next investigate the passenger flows on the system. The MSS network operates a smart card system which keeps track of the travel information of every passenger. Here we analyze the passenger flows on a single day, based on the transaction data of the smart card on 24 June, 2005. The total number of transactions or passenger flows in the MSS network was as many as 4,909,316 on that specific day.
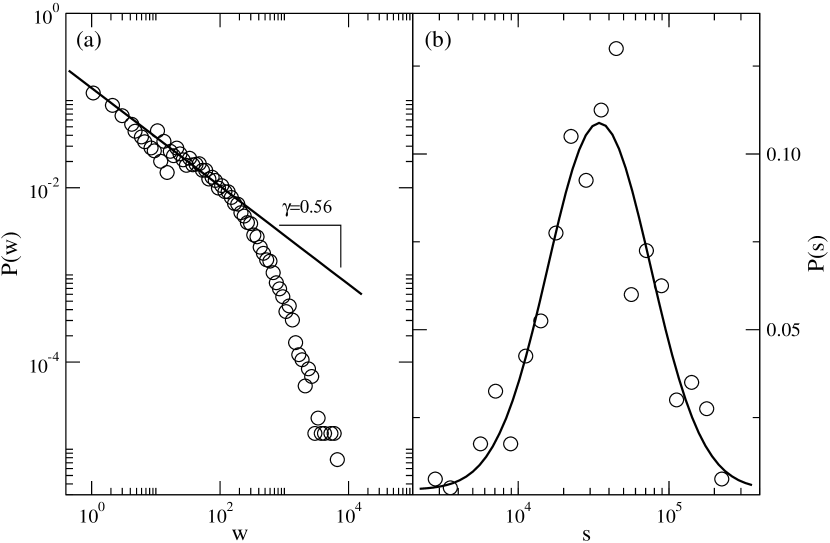
The weight of a link between stations and is taken to be the sum of passenger flows in both directions on the link, i.e., and . The strength of station is then defined to be the sum: . Displayed in Fig. 2 are the obtained distributions of (a) weights and (b) strengths for the MSS network. It is observed that the weight distribution apparently exhibits power-law behavior with an exponent around , albeit restricted due to the finite system size; in contrast, the strength distribution follows a log-normal function with a peak at . Note that in the subway network the weight of a link connecting two stations represents the passenger flow between them and the strength of a station corresponds to the number of passengers arriving at and departing from that station. Accordingly, while passenger flows do not have a characteristic size, numbers of passengers at single stations do have. In a metropolis, most facilities are located near stations, so that each station is naturally abundant in passengers, the number of which reflects the capacity of facilities located near the station. The fact that a majority of stations are used by a similar number of passengers, corresponding to the peak of the strength distribution, thus indicates that with residential and commercial facilities taken into account, places near most stations are already developed fully to accommodate dense and compact location of facilities. The peak of the strength distribution thus gives a measure for the characteristic capacity of the facilities near a station in the fully urbanized Seoul.
Spanning trees are widely used to analyze a complex network [17]. Of particular interest is the minimum spanning tree, which is constructed with weights not larger than those of other possible spanning trees. In the subway system, on the other hand, the link which has a larger passenger flow than others is important, demanding to consider the maximum spanning tree. Figure 3 shows the maximum spanning tree of passenger flows in the MSS system. We then compute the degree distribution of the maximum spanning tree, which is shown in Fig. 4. It is observed to be consistent with a power-law behavior: with exponent , obtained from the least-square fit.
To summarize, we have analyzed the Metropolitan Seoul Subway system consisting of 380 stations, and obtained various network measurements including the path length, clustering coefficient, diameter, and radius as well as the efficiency of the network. The path length, diameter, and radius have also been computed in terms of the physical distance between stations. We have further investigated the passenger flows in the system, and constructed the maximum spanning tree of the flows. It is found that the weight distribution displays a power-law behavior whereas the strength distribution follows a log-normal one. Also revealed is the power-law behavior of the degree distribution of the spanning tree. The detailed analysis and implications are left for further study.
References
- [1] D. J. Watts, S. H. Strogatz, Nature (London) 393 (1998) 440.
- [2] A.-L. Barabási, R. Albert, Science 286 (1999) 509.
- [3] A.-L. Barabási, R. Albert, H. Jeong, Physica A 272 (1999) 173.
- [4] M. E. J. Newman, SIAM Rev. 45 (2003) 167.
- [5] H. Jeong, Physica A 321 (2003) 226.
- [6] L. A. N. Amaral, A. Scala, M. Barthélémy, H. E. Stanley, Proc. Natl. Acad. Sci. U.S.A. 97 (2000) 11149.
- [7] A. Barrat, M. Barthélémy, R. Pastor-Satorras, A. Vespignani, Proc. Natl. Acad. Sci. U.S.A. 101 (2004) 3747.
- [8] R. Guimerà, S. Mossa, A. Turtschi, L. A. N. Amaral, Proc. Natl. Acad. Sci. U.S.A. 102 (2005) 7794.
- [9] G. Bagler, arxiv.org: cond-mat/0409773.
- [10] W. Li, X. Cai X., Phys. Rev. E 69 (2004) 046106.
- [11] V. Latora, M. Marchiori, Physica A 314 (2002) 109.
- [12] K. A. Seaton, L. M. Hackett, Physica A 339 (2004) 635.
- [13] J. Sienkiewicz, J. A. Hołyst, Phys. Rev. E 72 (2005) 046127.
- [14] W.-S. Jung, F. Wang, H. E. Stanley, Europhys. Lett. 81 (2008) 48005.
- [15] D. Brockmann, L. Hufnagel, T. Geisel, Nature (London) 439 (2006) 462.
- [16] K. Lee, H.-Y. Lee, Geograph. Anal. 30 (1998) 1.
- [17] R. N. Mantegna, Eur. Phys. J. B 11 (1999) 193.
| network | physical | |
|---|---|---|
| distance | distance | |
| 380 | ||
| km | ||
| 62 | km | |
| 62 | km | |
| 31 | km | |
| 0.747 |