Charge dynamics in thermally and doping induced insulator-metal transitions of (Ti1-xVx)2O3
Abstract
Charge dynamics of (Ti1-xVx)2O3 with has been investigated by measurements of charge transport and optical conductivity spectra in a wide temperature range of K with the focus on the thermally and doping induced insulator-metal transitions (IMTs). The optical conductivity peaks for the interband transitions in the 3 manifold are observed in the both insulating and metallic states, while their large variation (by eV) with change of temperature and doping level scales with that of the Ti-Ti dimer bond length, indicating the weakened singlet bond in the course of IMTs. The thermally and V-doping induced IMTs are driven with the increase in carrier density by band-crossing and hole-doping, respectively, in contrast to the canonical IMT of correlated oxides accompanied by the whole collapse of the Mott gap.
Insulator-metal transition (IMT) has been an important issue of condensed matter physics MIT . In the conventional semiconductor, the IMT is achieved by the shift of the chemical potential due to the chemical or electrostatic doping, where the electronic band structure is almost rigid in the course of IMT. Even in the metallic state, the carrier density is small and proportional to the amount of doping. In typical Mott transitions of correlated -electron systems such as V2O3 V2O3opt and La1-xSrxTiO3 LSTOopt , on the contrary, the Mott gap collapses with the temperature change or the chemical doping as a result of the reconstruction of the electronic structure on a large energy scale comparable to the Coulomb repulsion ( several eV) upon the IMT. The carrier number estimated by the Hall coefficient is large () compared with the dopant concentration in the metallic state. In the high- cuprate system HTSC , the parent compound is a Mott insulator (to be precise, a charge transfer insulator), but the carrier number is comparable to the dopant concentration in the low-doping and low-temperature region. One of the plausible scenarios for the origin of the doped-insulator-like feature in the normal state is the pseudogap formation due to the preformed singlet pairs or the resonating valence bond (RVB) state RVB .
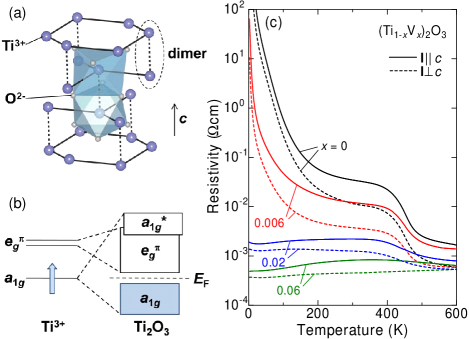
Ti2O3 with an -corundum structure (Fig. 1(a)) shows a unique IMT first . Nominally, there is one 3 electron per Ti site in Ti2O3. The nearest neighbor Ti ions along the -axis show dimerization in the crystal lattice and the two electrons on the Ti-Ti dimer form a singlet pair below the insulator-metal transition temperature ( K). As temperature increases, the dimerization becomes weaker and the metallic state emerges. The low-temperature insulating state cannot be reproduced by the LDA calculations without the explicit consideration of the on-site Coulomb correlation LDA . There are two possible scenarios to explain the IMT. One is the band crossing scenario good ; zeig ; zeig2 ; the IMT is viewed as the transition from the dimerized insulator to the semimetal. If the singlet state is destabilized, the conducting state may cross the Fermi energy. The other is the Mott transition sigma . In this scenario, the formation of the singlet state is compatible with the large on-site Coulomb repulsion, and the electronic structure is expected to be totally reconstructed on a large energy scale in the course of the Mott transition as observed in the optical conductivity spectra for a similar dimer system VO2 VO2opt2 . It is known that the metallic state remains down to the lowest temperature when Ti ions are partially replaced by V ions resV . In order to elucidate the origin of the IMTs in Ti2O3, we have investigated the thermally and doping induced IMTs in (Ti1-xVx)2O3 by optical and transport measurements. We observe the pseudogap feature in optical spectra even in the metallic state. Drude weight as well as the carrier number obtained by the Hall measurement at low temperature is proportional to the V concentration. These features are consistent with the picture of the doped band insulator, while the strong electron correlation on Ti site is essential for the robust singlet formation.
Single crystals of (Ti1-xVx)2O3 with , 0.006, 0.02, and 0.06 were prepared by the floating-zone method in Ar () and H2 () atmosphere. The longitudinal and Hall resistivities were measured with PPMS (Quantum Design). Polarized reflectivity in the temperature range of K were measured between 0.01 eV and 5 eV. The measurements above room temperature were performed in the Ar/H2 or vacuum atmosphere. Reflectivity spectra above 5 eV (up to 40 eV) were measured at room temperature with use of the synchrotron radiation at UV-SOR, Institute of Molecular Science, Okazaki. For the Kramers-Kronig analysis to deduce the optical conductivity, the spectrum above 40 eV was extrapolated by function, while below 0.01 eV the Hagen-Rubens relation and the constant reflectivity were assumed for metallic and insulating samples, respectively. Variation of these extrapolation procedures was confirmed to cause negligible difference in the conductivity spectrum.
We show the temperature and doping dependences of the resistivity in Fig. 1(c). The resistivity for Ti2O3 shows a steep increase around first . The resistivity for the current parallel to the -axis (I ) is about three times as high as that for I seebeck_resA2_Eg . For , the resistivity is much decreased but shows an insulating behavior. Above , the resistivity shows a metallic behavior, and for the increase of the resistivity around is hardly observed. The anisotropy is observed even in the metallic state up to . The measurements of the Hall resistivity hall_Eg and the Seebeck coefficient seebeck_resA2_Eg indicate that V ion is nominally divalent in (Ti1-xVx)2O3 and thus the holes are introduced into the valence band (see also Fig. 3(d)).
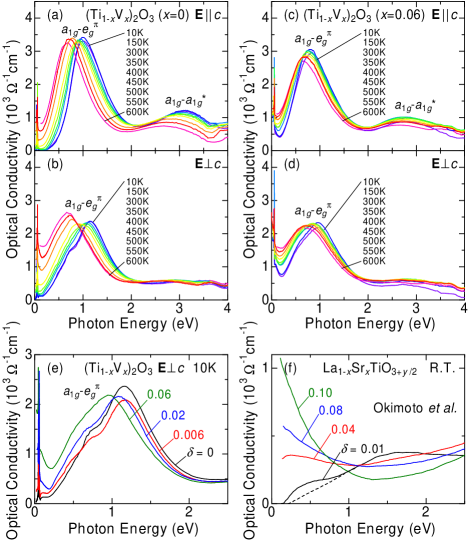
In Figs. 2(a)-(d), we show the optical conductivity spectra at various temperatures in (Ti1-xVx)2O3 with and 0.06 for E and E . For Ti2O3, the E spectrum shows a clear gap structure of about 0.2eV at the ground state (10 K). (Sharp spikes below 0.1 eV are due to the optical phonon modes fir .) The proposed electronic structure of Ti2O3 good is shown in Fig. 1(b). The levels in cubic symmetry split into the and levels due to the trigonal ligand field. Furthermore, the band splits into the bonding and the antibonding bands mainly because of the hybridization within the Ti-Ti dimer. Two peaks around 1 eV and 3 eV are assigned to the - and - interband transitions, respectively nir . The - dipole transition in the dimer is prohibited for E . Because of the anisotropic extension of the orbital along the -axis, the - transition appears stronger for E than for E . With increasing temperature, these peaks markedly shift to lower energy by about 0.4 eV. Nevertheless, the clear band gap feature remains to be observed in the whole temperature up to 600 K. For E , a similar gap structure as well as the conspicuous low-energy shift of the interband transition is also observed. This result is incompatible with the theoretical picture for the IMT of Ti2O3 based on the Mott-Hubbard scheme sigma . For , a Drude peak is observed in the low-energy region, while the peak originating from the - transition is robust as in the high-temperature region of Ti2O3. In Fig. 2(e), we show the doping dependence of the ground-state optical conductivity spectra for E in (Ti1-xVx)2O3 at 10K. With V-doping, the peak energy of the - transition decreases, while the Drude response evolves below 0.2 eV. Nevertheless, the Drude weight remains small compared with the spectral weight of the interband transitions within the manifold.
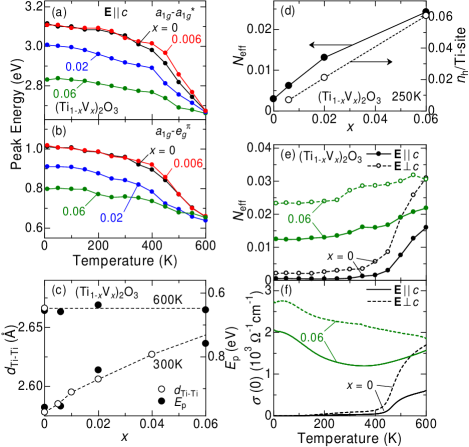
In Figs. 3(a) and (b), the peak energies for the - and - interband transitions for E in (Ti1-xVx)2O3 are plotted as a function of temperature, respectively. The shift of the peaks is clearly related with the change of the , , and band positions. Both peak energies for E in Ti2O3 are nearly temperature independent at low temperatures but show rapid decreases around . The amount of the shift is comparable to, or even larger than, the band gap ( 0.2 eV) in Ti2O3 below room temperature. As increases, the peak energy at low temperatures also reduces. However, the peak position around 600 K is almost independent of , indicating that the conducting state above is common in nature irrespective of the V-doping level. In Figs. 3(c), we plot the peak energy of the - transition for E at 300 and 600 K in comparison with dependence of the Ti-Ti dimer bond length estimated from the ratio crysT ; crysV1 . Notably, the temperature and doping variation of the interband transition energy is parallel to that of the . The V-doping induces the hole type carriers at a rate of -site, as shown in Fig. 3(d). Therefore, the hole accumulation in the valence band appears to relax the Ti-Ti dimer bond, leading to the reduction of the energy gap between the and bands. These results unambiguously show that the local singlet formation on the Ti-Ti dimer is responsible for the robust band gap but amenable to the thermal band-gap excitation or the hole-doping.
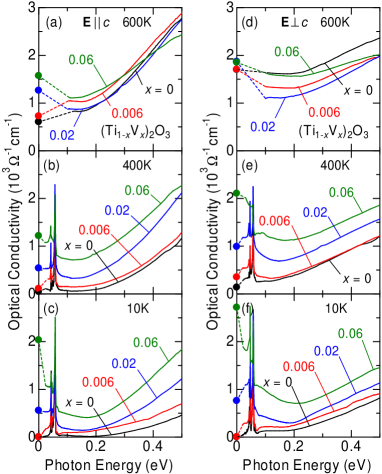
To see the carrier dynamics in more detail, we show in Fig. 4 the low-energy part of the optical conductivity spectra in (Ti1-xVx)2O3 at various temperatures below and above . At 600 K, the low-energy optical conductivity shows rather -flat and less -dependent features both for E and E , indicating the incoherent carrier dynamics in the conducting state above . The spectral weight in the low-energy region decreases with decreasing temperature for any . Above , however, the Drude-like coherent response is observed to grow below 0.2 eV as the temperature decreases.
Figures 3(d) and (e) show the doping and temperature dependence of the effective number of electrons at 0.2 eV in (Ti1-xVx)2O3, respectively, as a measure of Drude weight. The is defined by the following relation,
| (1) |
Here , , and ( eV) are the free-electron mass, the cell volume containing one Ti atom, and the cut off energy adopted as the - gap energy, respectively. (The contribution of the optical phonon was subtracted in Figs 3(d) and (e).) As seen in Fig. 3(d), the at 250K is nearly proportional to the doping level , as well as the hole density . Thus, the metallic conductivity in the V-doped crystal is caused by the doped holes accumulated in the valence band, whose concentration is proportional to as in the doped semiconductor; the conventional Drude formula suggests that (effective mass) at low temperatures. The for Ti2O3 shows a sudden increase around (Fig. 3(e)) and its temperature dependence roughly agrees with that of the dc conductivity for both E and E (Fig. 3(f)). For , the increases with decreasing temperature below , while the decreases monotonically. This can be explained by the temperature dependence of the scattering rate (or mobility) of the carriers in the metallic state. The values at 600 K suggest the effective carrier density as low as in the high-temperature conducting state.
The comparison of these results with those in Mott transition system is meaningful. We show in Fig. 2(f) the doping variation of the optical conductivity spectra in the typical Mott transition system La1-xSrxTiO3+y/2 (LSTO) reported by Okimoto et al. LSTOopt . In LSTO, the large amount of the spectral weight is transferred from the high-energy Mott gap excitation to the low-energy Drude part in the course of the doping (-site) induced IMT. This behavior is quite contrastive with that in (Ti1-xVx)2O3 shown in Fig. 2(e). The coexistence of the pseudo gap feature and the Drude peak with small spectral weight in (Ti1-xVx)2O3 is consistent with the picture of the doped band insulator. Nevertheless, the doping induced low-energy shift of the whole interband transition bands (see Figs. 3(a) and (b)) is appreciable. Thus, the band gap arising from -electron singlet formation in the bond dimer is critically affected by the hole doping level or the thermal gap excitation above . The thermally induced IMT in Ti2O3 can be interpreted with band-crossing picture via the weakened singlet bond by the thermal gap excitation. The recent LDA+DMFT calculation suggests that the effective band width is reduced by the electron correlation, which stabilizes the dimerized state as well DMFT .
In summary, we have investigated the optical and transport properties for (Ti1-xVx)2O3 in the wide temperature range of K. We identify that in the optical conductivity spectra the peaks due to the interband transitions remain to be observed in the thermally and V-doping induced metallic state. The variation of the gap energy in the course of the IMT well scales with that of the Ti-Ti bond length reflecting the singlet-bond strength. The Drude component is small compared with the weight of the interband transition bands and proportional to , as well as the carrier number obtained by the Hall coefficient, whereas the magnitude of the band gap is sensitively affected by the thermal gap excitation and the hole doping. These observations are contrasted with the case of the canonical Mott transition in correlated electron systems, which accompanies the large spectral weight transfer from the gap excitation to the Drude weight.
This work was partly supported by Grants-In-Aid for Scientific Research (Grant No. 15104006, 16076205, 20340086) from the MEXT of Japan.
References
- (1) M. Imada, A. Fujimori, and Y. Tokura, Rev. Mod. Phys. 70, 1039 (1998).
- (2) M. J. Rozenberg et al., Phys. Rev. Lett. 75, 105 (1995).
- (3) Y. Okimoto et al., Phys. Rev. B 51, 9581 (1995).
- (4) T. Timusk and B. Statt, Rep. Prog. Phys. 62, 61 (1999).
- (5) P. A. Lee, N. Nagaosa, and X.-G. Wen, Rev. Mod. Phys. 78, 17 (2006).
- (6) F. J. Morin, Phys. Rev. Lett. 3, 34 (1959).
- (7) L. F. Mattheiss, J. Phys.: Condens. Matter 8, 5987 (1996).
- (8) L. L. Van Zandt, J. M. Honig, J. B. Goodenough, J. Appl. Phys. 39, 594 (1968).
- (9) H. J. Zeiger, T. A. Kaplan, and P. M. Raccah, Phys. Rev. Lett. 26, 1328 (1971).
- (10) H. J. Zeiger, Phys. Rev. B 11, 5132 (1975).
- (11) A. Tanaka, J. Phys. Soc. Jpn. 73, 152 (2004).
- (12) M. M. Qazilbash et al., Phys. Rev. B 74, 205118 (2006).
- (13) G. V. Chandrashekhar et al., Mat. Res. Bull. 5, 999 (1970).
- (14) S. H. Shin et al., Phys. Rev. B 8, 1364 (1973).
- (15) J. M. Honig and T. B. Reed, Phys. Rev. 174, 1020 (1968).
- (16) G. Lucovsky, R. J. Sladek, and J. W. Allen, Phys. Rev. B 16, 5452 (1977).
- (17) S. S. M. Lu, F. H. Pollak, and P. M. Raccah, Phys. Rev. B 17, 1970 (1978).
- (18) C. N. R. Rao, R. E. Loehman, and J. M. Honig, Phys. Lett. 27A, 271 (1968).
- (19) C. E. Rice and W. R. Robinson, J. Solid State Chem. 21, 145 (1977).
- (20) A. I. Poteryaev, A. I. Lichtenstein, and G. Kotliar, Phys. Rev. Lett. 93, 086401 (2004).