High-sensitivity monitoring of micromechanical vibration using optical whispering gallery mode resonators
Abstract
The inherent coupling of optical and mechanical modes in high finesse optical microresonators provide a natural, highly sensitive transduction mechanism for micromechanical vibrations. Using homodyne and polarization spectroscopy techniques, we achieve shot-noise limited displacement sensitivities of . In an unprecedented manner, this enables the detection and study of a variety of mechanical modes, which are identified as radial breathing, flexural and torsional modes using 3-dimensional finite element modelling. Furthermore, a broadband equivalent displacement noise is measured and found to agree well with models for thermorefractive noise in silica dielectric cavities. Implications for ground-state cooling, displacement sensing and Kerr squeezing are discussed.
pacs:
05.40.Jc, Brownian motion. 42.50.Wk, Mechanical effects of light on material media, microstructures and particles. 43.40.+s Structural acoustics and vibration. 78.20.Nv Thermooptical and photothermal effectsI Introduction
The transduction and measurement of small displacements of mechanical oscillators is important in a variety of studies ranging from macroscale gravitational wave detection Braginsky1977 to micron-scale cantilever-based force measurements Rugar2004 . One embodiment that is particularly amenable to measurement of small displacements is the parametric coupling of a high-Q electrical or optical resonance to a mechanical oscillator Braginsky1977 . In the case of a Fabry-Perot interferometer with a harmonically oscillating end-mirror, this parametric coupling manifests itself as a position-dependent shift of the resonance frequency, thereby allowing transducing the mechanical motion into a change of the phase of a resonant field probing the Fabry-Perot cavity.
However, even for a perfect measurement apparatus, the sensitivity is limited by the laws of quantum mechanics. Fundamentally, any linear measurement process entails that it must also exert a backaction onto the mechanical oscillator, as first discussed by Braginsky Braginsky1992 ; Griffard1976 . Braginksy identified two types of backaction: quantum backaction and dynamic backaction. Dynamic backaction occurs when the optical interferometer (or cavity) is excited in a detuned manner. In this case the radiation pressure force exerted by photons in the cavity can become viscous and lead to either amplification or cooling of the mechanical motion. This effect is entirely classical and has been first observed in 2005 in the case of radiation-pressure amplification and oscillation Kippenberg2005 ; Rokhsari2005 and in 2006 also for radiation-pressure cooling Gigan2006 ; Arcizet2006 ; Schliesser2006 . For a recent review see Ref. Kippenberg2007 . For the case of resonant excitation of the cavity or circuit, this effect can however in principle be entirely suppressed. In contrast, quantum backaction cannot be suppressed and arises from the discrete nature of the photons (or electrons) involved in the measurement process. The quantum fluctuations of the intracavity field cause a random force that drives the mechanical oscillator and thereby leads to perturbation of its position. This quantum backaction provides a limit to continuous position measurements and leads to the so called standard quantum limit Braginsky1992 ; Caves1980 . At the standard quantum limit, the measurement imprecision is equal to the zero point motion of the mechanical oscillator, to which both shot noise and quantum backaction contribute in equal amounts. Over the past decades, significant progress has been made in approaching this quantum limit of motion measurement in the context of both electromechanical and optomechanical experiments. Researchers have investigated a variety of mechanisms and devices as motion transducers of mesoscopic oscillators, for example quantum point contacts Cleland2002 ; Poggio2008 , superconducting single-electron transistors Knobel2003 ; LaHaye2004 , atomic point contacts Flowers-Jacobs2007 , microwave interferometers Braginsky1977 ; Regal2008 and magnetomotive transducers Ekinci2002 ; Gaidarzhy2005 . In terms of demonstrated sensitivity, optical transducers Hadjar1999 ; Arcizet2006 ; Corbitt2007a ; Caniard2007a have been unsurpassed, measuring mechanical displacement down to the level for measurement bandwidths up to .
Important to the detection process is that the optical transducer is typically not only sensitive to a single mechanical mode of interest, but sensitive to any differential change in the cavity’s optical path length. Therefore, a variety of mechanical modes of the cavity boundary can contribute and the signal from the mode of interest may be spectroscopically extracted based on its Fourier frequency. The thermal excitation of other modes, and other effective cavity length fluctuations may constitute a measurement background in excess of the quantum shot of the lightused to monitor the mode of interest. Assessing this background therefore proves particularly important if one mode is laser-cooled below the bath temperature as recently achieved Cohadon1999 ; Arcizet2006a ; Gigan2006 ; Kleckner2006 ; Schliesser2006 ; Corbitt2007 ; Corbitt2007a ; Poggio2007 ; Thomson2007 ; Schliesser2008 .
In this letter, we provide a broadband analysis of the noises in the optomechanical transduction of radial displacements in toroidal silica microcavities, revealing in detail the influence of all other mechanical modes. Toroidal microcavities Armani2003 are optical resonators that host both high-quality optical and mechanical modes in one and the same device, and have been used to demonstrate radiation pressure dynamic backaction for the first time Kippenberg2005 ; Rokhsari2005 . Efficient cooling by dynamical backaction Braginsky2002 has been demonstrated both in the “Doppler” Schliesser2006 and the resolved-sideband regime Wilson-Rae2007 ; Marquardt2007 ; Schliesser2008 , rendering them particularly interesting for the goals of the emerging discipline of cavity quantum optomechanics Kippenberg2007 , which pertains to studying quantum phenomena of mesoscopic mechanical oscillators. We report broadband interferometric measurement of their radio-frequency mechanical modes based on parametric coupling to the optical whispering-gallery modes (WGMs). Using adaptations of both the Hänsch-Coulliaud polarization spectroscopy Hansch1980 and optical homodyne measurement, displacement sensitivities at the level of are achieved over a measurement bandwidth of up to .
We find sparse spectra of mechanical modes which allow obtaining a detailed understanding of the modes using 3-dimensional finite-element simulations. More than 20 mechanical modes are observed between DC comprising radial breathing, flexural and torsional modes. We furthermore identify a broadband noise background which is attributed to thermorefractive noise, as previously observed in silica microspheres Gorodetsky2004 . The detailed understanding of these noise processes (both due to mechanical modes and thermorefractive noise) is particularly important for studies such as pondermotive squeezing Fabre1994 , ground state cooling Wilson-Rae2007 ; Marquardt2007 , as well as squeezing using the third order Kerr nonlinearity of glass Slusher1985 .
II Whispering gallery modes for optical motion transduction
Decades of research in the field of gravitational wave astronomy have brought major fundamental Braginsky1992 ; Caves1980 and technological advances in interferometric transduction of mechanical displacements. More recent efforts Tittonen1999 ; Hadjar1999 ; Arcizet2006 have shown that these techniques are well suited for application to much lighter oscillators at the microscale. Such oscillators are expected to display quantum effects at significantly higher temperatures. In the following, we will briefly review the limits for the interferometric detection of micromechanical oscillations using high-quality WGMs Ilchenko2006 . The employed silica toroidal resonators (figure 1) possess ultra-high-Q optical modes which are confined by total internal reflection Armani2003 . In addition, microcavities also exhibit structural resonances giving rise to high frequency vibrational modes Kippenberg2005 ; Rokhsari2005 ; Carmon2007 . Mechanical modes which affect the circumference of the cavity shift the optical resonance frequency, and thereby couple to the optical degree of freedom. This was recognized in early experiments that demonstrated the parametric oscillation instability Kippenberg2005 ; Rokhsari2005 and provides, as shown here, a natural way for highly sensitive motion transduction.

A change of the major radius by a small displacement induces a shift of the resonance frequency of the whispering gallery modes located in the rim of the toroid by an amount . This induces a change in the properties of a field launched into this mode. In the usual coupling geometry using a tapered fibre, the field transmitted through the tapered fibre reads Haus1984
| (1) |
where and are the inverse cavity decay rates due to output coupling to the taper and due to other losses333The times and can also be expressed in terms of the probability of transmission to the taper and loss to the environment within the time of one round-trip via and .. The condition with is usually referred to as critically coupled or impedance matched. To first order, the transmitted amplitude is not affected by small mechanically-induced resonance frequency shifts for a resonant laser , the phase of the field, however, is. By comparison with a phase reference in an interferometric measurement, the displacement can be thereby be detected. For example, the output field may be brought to interference with a strong field at the same frequency using a half-transmissive beam splitter. Choosing the appropriate phase of the reference field , the photon fluxes detected at the two output ports of the splitter are determined by . Subtraction of these two simultaneously measured fluxes yields a differential signal
| (2) |
to first order in , where is the cavity’s total decay rate (i.e. linewidth) and and are the photon fluxes corresponding to the fields and . The coupling efficiency
| (3) |
can take values , approaching for undercoupling () and in the case of overcoupling (), while at critical coupling it is equal to . Physically this quantity thus describes the probability of an intracavity photon coupling to the output fibre. The fundamental noise source in this detection scheme arises from the quantum phase noise of the light being detected. This leads to a spectral density of flux (and thus signal) fluctuations of in the experimentally desirable limit . The resulting minimum detectable displacement is
| (4) |
where the finesse of the WGM was introduced, is the optical wavelength in glass and the measurement bandwidth. Note that the finesse is also affected by the coupling via , where is the “intrinsic” finesse in the undercoupled limit , so that the optimum sensitivity is achieved at critical coupling .
We note that the same result is obtained following a more formal approach, using the linearized quantum Langevin equations (QLE) of the coupled optomechanical system around a stable working point Fabre1994 ; Giovannetti2001 ; Walls2008 . This allows in particular calculating the fluctuations in any arbitrary quadrature of the output field. Comparison of the resulting quantum fluctuations and mechanically induced fluctuations in the detected output phase quadrature yields a minimum displacement of
| (5) |
Compared to (4), this calculation adds only a correction due to the finite response time of the cavity for Fourier frequencies exceeding the cavity cutoff . We note that the full expression (5) can also be derived from a classical calculation of the signal, considering the amplitude of the motional sidebands of the field coupling out of the cavity and comparing it with detection shot noise Schliesser2008 . The detection limit (5) corresponds to a spectral density of measurement imprecision
| (6) |
As first pointed out by Braginsky Braginsky1992 , this measurement inevitably exerts backaction on the mechanical device. In the case of an optical transducer, quantum backaction is enforced by the fluctuations of radiation pressure due to a fluctuating intracavity photon flux. From the linearized Langevin equations, the intracavity force fluctuation spectrum can be calculated to have the form
| (7) |
It is noted that and fulfill the expected uncertainty relation
| (8) |
with an equality in the limit , that is, for a strongly overcoupled cavity. The fluctuating backaction force drives the mechanical oscillator, and therefore induces position fluctuations. Assuming the fluctuations in the amplitude and phase quadratures of the input light field are uncorrelated, the position fluctuations induced by are uncorrelated with the apparent position fluctuations . Thus the total measurement uncertainty is given by
| (9) |
where
| (10) |
is the susceptibility of the mechanical oscillator and is its mechanical damping rate. It is important to note that this susceptibility is modified when the optical resonance is excited in a detuned manner Braginskii1967 . However, for resonant probing as considered here, it is not modified. The total measurement uncertainty is minimized for an input flux of
| (11) |
yielding
| (12) |
called the standard quantum limit Braginsky1992 ; Caves1980 in the case . Its peak value at is
| (13) |
In this calculation we have explicitly considered the effect of the coupling conditions to the cavity, which can—as a unique feature—be varied continuously in the experiment by adjusting the gap between the coupling waveguide and the WGM resonator. The SQL is approached most closely in the overcoupled limit . It is noteworthy that the fibre-taper coupling technique to microtoroids can deeply enter this regime, and () has been demonstrated Spillane2003 . On the other hand, such a strong coupling reduces the cavity finesse and thus comes at the expense of a higher optimum power . Working with weaker coupling, such as critical coupling as typically pursued in this work, brings only a moderate penalty as (12) shows, for example, a factor of for .
In our experiment performed at room temperature, the noise induced by quantum backaction is masked by thermal noise due to a fluctuating Langevin force with as , adding a third term to the total displacement noise Fabre1994 ; Giovannetti2001 ,
| (15) | |||||
This expression constitutes a description of the spectrum that is measured by analyzing the phase quadrature of the transmitted light past the microresonator Giovannetti2001 .
III Experimental implementation
Detection of the phase of a light field with quantum-limited sensitivity is a standard task in quantum optics, and several techniques have been developed to achieve this. In the following section, two techniques which were successfully implemented for motion transduction in whispering gallery mode microresonators are described.
III.1 Homodyne spectroscopy
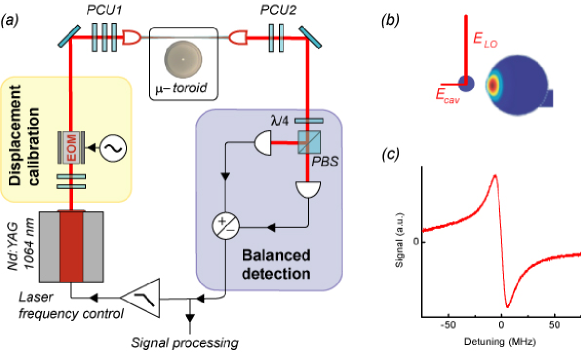
The most common method for quantum-limited phase measurement is a balanced homodyne receiver Yuen1983 as employed in previous optomechanical experiments Hadjar1999 ; Briant2003b ; Caniard2007a . We briefly discuss the experimental protocol used for homodyne spectroscopy. This method is adapted to the ring topology of our resonator by sending the laser beam that is transmitted through the taper to a beam splitter, where it is brought to interference with a strong local oscillator (LO), see figure 2. Signal and local oscillator beams are derived from a monolithic Nd:YAG laser operating at . This source exhibits quantum-limited amplitude and phase noise at Fourier frequencies and power levels of interest. Due to its limited tuning speed and range we use a home-built external-cavity diode laser for pre-characterization of several samples until a suited toroid is found. The Nd:YAG laser beam is split using a polarizing beam splitter (PBS0), the signal beam is sent through the coupling taper in the near field of the excited cavity mode and its phase is shifted depending on the mutual laser-cavity detuning. The local oscillator travels in the reference arm of an effective Mach-Zehnder interferometer and is recombined with the signal beam at a polarizing beam splitter (PBS1). Spatial matching of the incident modes is facilitated by using single-mode fibre as mode filter on the local oscillator. After spatial recombination, interference is enforced using a retarder plate and another polarizing beam splitter (PBS2).
It was found advantageous to actively stabilize the phase of the local oscillator at the combining beam splitter. Since the phase of the signal beam depends on the detuning of the laser from the cavity, which may itself be subject to drifts and fluctuations, it is not suited as a phase reference. However, by purposely introducing a small polarization mismatch (cf. figure 2(b)) between the light in the taper region and the either predominantly TE- or TM-like WGM modes of the microcavity, it is possible to utilize the signal’s polarization component orthogonal to the cavity WGM mode as a phase reference, in order to lock the Mach-Zehnder interferometer to the desired phase angle between WGM and LO fields. WGM and locking polarization components in the signal beam are separated by the first beam splitter (PBS1), after compensation of fibre-induced polarization rotation. An error signal is created by detecting the interference between the locking and the LO beam in a third PBS (PBS3), which provides a feedback signal to the piezoelectric transducer displacing a mirror.
In order to reach quantum-limited detection sensitivity of the signal beam’s phase, the power of the local oscillator has to be chosen such that quantum shot noise exceeds the receiver noise, , where is the noise-equivalent power of the receiver, and the detection efficiency. The employed commercial InGaAs receivers provide , between and . Balancing the detectors avoids the saturation of the amplifiers by the large d.c.-field of the local oscillator. Excess losses due to mode matching and tapered fibre imperfections further reduce the total detection efficiency to (an unoptimized) .
An advantageous feature of the homodyne signal is that its d.c.-component directly provides a dispersive error signal
| (16) |
that can be used for locking the laser to the center of the optical microcavity resonance. At the low signal powers used here, locking is very stable. An example of an experimentally obtained error signal is shown in figure 2(d). Simultaneously, the fluctuations in the differential photocurrent induced by both optical shot noise in the signal and the thermal noises in the cavity displacement can be frequency-analyzed using a high-performance electronic spectrum analyzer. For calibration purposes, we frequency-modulate the laser using a phase modulator external to the laser. The frequency modulation is given by for known modulation depth and frequency , and generates the same signal as would be induced by a radius modulation of Tittonen1999 ; Hadjar1999 ; Gorodetsky2004 ; Schliesser2008 , independent of cavity linewidth and coupling conditions. If the cavity linewidth is known in addition, the spectra can be absolutely calibrated at all Fourier frequencies, taking into account the reduced sensitivity beyond the cavity cutoff at .

III.2 Polarization spectroscopy
A simplified setup may be obtained by co-propagating the local oscillator in the same spatial, but orthogonal polarization mode as compared to the signal beam Schliesser2008 . Since the WGM modes have predominantly TE or TM character and are not degenerate, this guarantees that the local oscillator is not affected by the cavity. Due to common-mode rejection of many sources of noise in the relative phase between signal and LO (for example, frequency noise in the optical fibre), the passive stability is sufficiently enhanced to enable operation without active stabilization (Figure 3).
Enforcing interference between local oscillator and signal beams then corresponds to polarization analysis of the light (comprising both signal and LO) emerging from the cavity. While novel in the present context of a tapered fibre coupled microcavity, this is a well established technique to derive a dispersive error signal from the light reflected from a Fabry-Perot type reference cavity, named after their inventors Hänsch and Couillaud Hansch1980 .
If fibre birefringence is adequately compensated, the error signal reads
| (17) |
identical to (16), and a typical trace is shown in figure 3(c). This is used to lock the laser at resonance with a bandwidth of about . Calibration of the spectra may be performed as described in the previous section.
While this approach obviously allows reducing the complexity of the experiment, this arrangement proved more sensitive to slow temperature drifts in the polarization mode dispersion of the fibres employed, due to the large ratio of signal and LO powers, the magnitudes of which are only defined by the polarization state of the light in the fibre taper region. Improved stability may be obtained by reducing fibre length to its minimum of ca. . For reasons of flexibility and convenience, the actual fibre length totaled to several meters in our experiment. Nonetheless, sensitivities of are achieved in toroids using this method Schliesser2008 . The intrinsic polarization selectivity of WGM renders the introduction of an additional polarizer, mandatory in the original implementation Hansch1980 , obsolete. In an earlier experiment with a Fabry-Perot cavity Hahtela2004 , the losses associated with an intracavity polarization element limited the finesse, and therefore the attained sensitivity to .
IV Observation and analysis of quantum and thermal noises
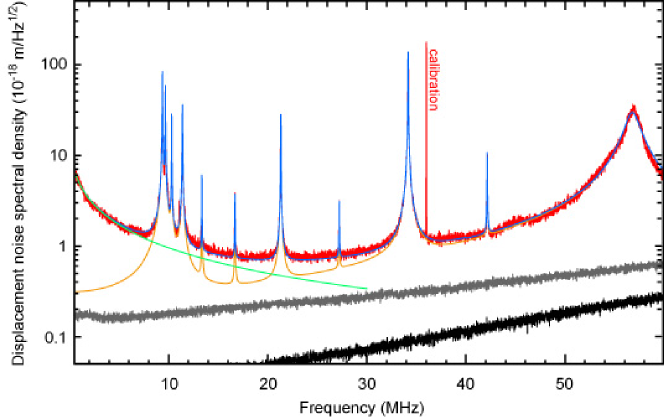
In this section, we present characteristic results obtained with silica microtoroids of typical major radii between and . Figure 4 shows an example of a broadband measurement using homodyne detection. If the taper is retracted from the proximity of the cavity, quantum shot noise exceeds the electronic noise in the receiver. It was verified that the photocurrent noise scales with the square root of the total power as expected for shot noise. While this noise is spectrally flat, the equivalent displacement noise exhibits a calculated frequency dependence beyond the cavity cutoff at .
When the laser is coupled and locked to a WGM resonance, a substantially different spectrum is observed (Figure 4). Its equivalent displacement noise is calibrated in absolute terms using an a priori known phase modulation at , and taking the cavity cutoff into account. The equivalent displacement noise of the cavity exceeds the shot noise at all frequencies for a high enough power in the signal beam, leading to a background level equivalent to a displacement noise of . The superimposed sparse spectrum of peaks fits the sum of several Lorentzians which arise from the thermal noise of several mechanical modes, . In the following, we discuss the features of the spectrum in more detail.
IV.1 Thermorefractive noise
The broadband, low-frequency background noise is attributed to thermorefractive noise, the fluctuations in refractive index induced by the fluctuations of temperature on a microscopic volume Landau1980 . Here denotes Boltzmann’s constant, temperature, density and specific heat capacity. This leads to fluctuations of the resonance frequency via both the dependence of the refractive index on temperature, and the thermal expansion of the material. At room temperature however, the coefficient of thermal expansion is more than twenty times smaller than , so the analysis can be restricted to the resonance frequency fluctuations induced by thermorefractive fluctuations.
Introducing a fluctuating thermal source field in the heat diffusion equation similar to a Langevin approach Braginsky2000 it is possible to derive the spectrum of refractive index fluctuations sampled by a WGM in a silica microsphere Gorodetsky2004 . For high frequencies, an approximate analytic expression, neglecting also the boundary conditions for thermal waves, can be obtained. The result
| (18) |
was found in good agreement with the experimental data obtained on a silica microspheres Gorodetsky2004 between and . Here is the cavity radius, and are transverse mode dimensions and is the thermal diffusivity of silica. For comparison with the toroid measurement calibrated as effective radial displacement, has to be evaluated. Inserting the material parameters of fused silica and the radius of the employed toroid into the model (18), the data between and can be quantitatively reproduced if no parameters except and the absolute magnitude are adjusted by factors of order 2 (Figure 4). These corrections are justified considering the approximations made in the derivation, and potential differences in surface effects in spheres and toroids. It is interesting to calculate the resulting experimental root-mean-square fluctuations of the cavity’s refractive index to be of order , as it constitutes a detection limit for resonance frequency shifts induced by molecules in the evanescent field Schroter2008 .
For the purposes of cavity quantum optomechanics, thermorefractive fluctuations constitute a background noise, at room temperature rolling off to a level of at , where the high-quality radial-breathing modes typically reside. Practically, such experiments are going to be performed in a cryogenic environment, leading to significant changes in the material properties. A level of at may be estimated, assuming a reduction of to as indicated by recent measurements Park2007 . While other sources of noise, such as thermoelastic and photothermal noises Braginsky1999 ; Matsko2007 are not expected to exceed this value, thorough experimental characterization at cryogenic temperatures is necessary.
Such a study is also an important pre-study for experiments aiming at the demonstration of generating broadband intracavity Kerr squeezing. While above-threshold parametric oscillations have been observed in these cavities Kippenberg2004a ; DelHaye2007 , the room temperature experiments reported here indicate that the thermorefractive noise exceeds the quantum noise of the light in the cavity, as evidenced by the homodyne measurement of the cavity output. It therefore has to be suppressed to achieve squeezing of the cavity field.
IV.2 Mechanical modes
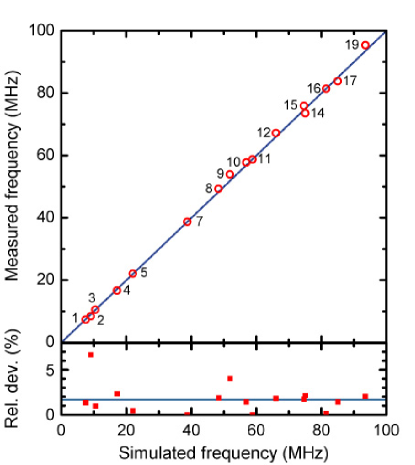
The most prominent features in the noise spectrum are the mechanical modes of the microtoroids. To date, the variety of mechanical modes in silica microcavities (toroids and spheres) has been investigated only to a limited extentKippenberg2007 ; Schliesser2008 , in most cases by driving modes with particularly strong optomechanical coupling into the parametric oscillatory instability Kippenberg2005 ; Rokhsari2005 ; Carmon2007 ; Ma2007 ; Park2007a . Using a Fabry-Perot cavity, however, it was shown that the Brownian motion of a wealth of intrinsic mechanical modes of a cylindrical mirror can be studied Briant2003b . The high sensitivity methods presented in the previous section enable monitoring the Brownian motion of around twenty different mechanical modes in silica microtoroids over a frequency range spanning from below to above . Figure 5 shows a noise spectrum obtained by Hänsch-Couillaud spectroscopy revealing a total of 16 mechanical modes. In order to indentify the observed peaks with the appropriate mechanical mode patterns, a 3D finite element model (FEM) of the microtoroid is employed and implemented111The commercial software Comsol Multiphysics was employed.. Extracting the geometry parameters using an optical microscope (accuracy ) and matching observed and simulated mechanical frequencies, the FEM simulation allows identifying all observed peaks in the spectrum. Thus all 16 observed modes were assigned to the corresponding simulated mode patterns as depicted in figure 5. Figure 6 gives an overview of simulated frequencies and the frequencies deduced from the spectrum shown in figure 5 revealing excellent agreement. The relative frequency deviation between measurement and simulation is on average less than 2%. Moreover, almost all simulated modes are observed experimentally. Only three out of 19 modes (number 6, 13, 18) cannot be observed which may be due to low mechanical Q factors ().
Due to its composite structure comprising several geometric objects microtoroids exhibit a diverse set of eigenmodes. In order to characterize the noise spectra, understanding the complex mode structure of microtoroids is in particular important as all modes contribute to a background noise floor. Indeed, various mode-families can be identified in which the motion of the silica disk, the silica torus, and the silicon pillar partially decouples. The mode showing the strongest optomechanical coupling is the radial breathing mode (mode 14 in figure 5), and most previous work has focused on this mode Kippenberg2005 ; Schliesser2006 ; Schliesser2008 . An equivalent mode has been studied in a microdisk structure Clark2005 where it was termed radial contour mode. In contrast, the optomechanical coupling of the torsional mode (mode number 4) where the silica disk shows an in-plane rotation vanishes to first order. Interestingly, this torsional mode can nevertheless be observed experimentally.
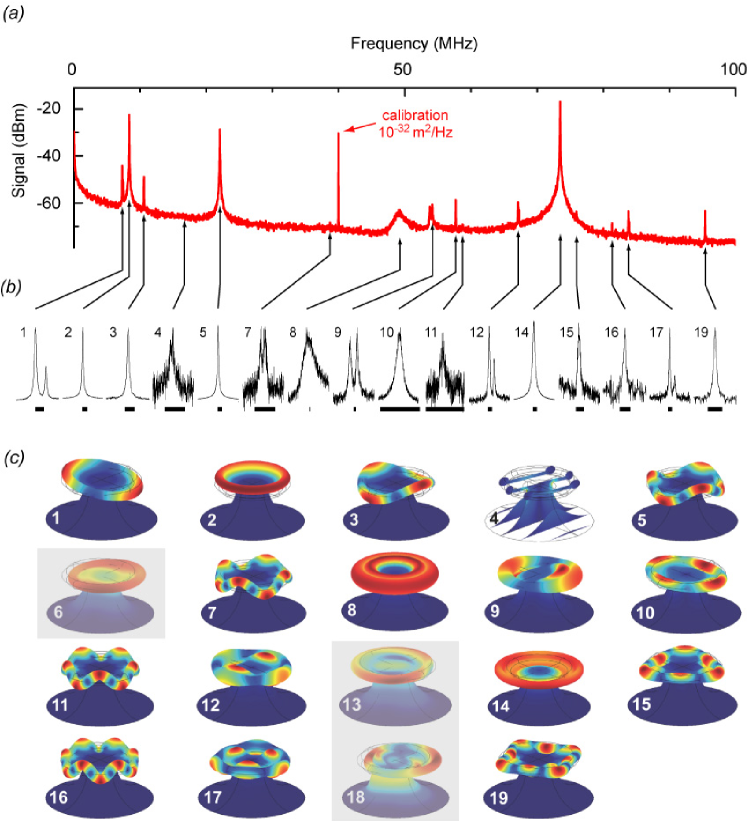
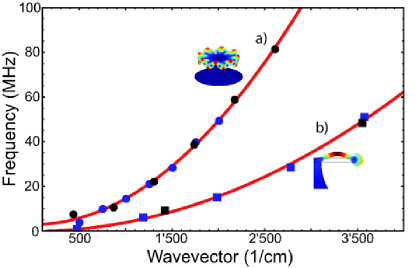
One particular mode family that can be identified are the radially symmetric flexural modes (modes 2, 8) in which the motion of the free standing part of the silica disk resembles the modes of a cantilever. The fundamental frequencies of a cantilever of length can in general be expressed as , where is a material constant and the are given by the solutions of Cleland2003
| (19) |
Figure 7 shows the measured frequencies of the two lowest order flexural modes (modes 2, 8) and, in addition, the first five flexural modes of a different sample plotted as a function of the wavevector , where the free standing part of the silica disk is taken as equivalent cantilever length ( and respectively). Both sets of data allow an accurate single quadratic fit of the fundamental radially symmetric modes. Thus, the latter can indeed be regarded as cantilever modes following a uniform quadratic dispersion even for microtoroids of different sizes. In particular, the quadratic dispersion rules out the presence of radial tensile stress within the silica disk as this would imply a linear dispersion relation.
Another obvious mode family which can be distinguished is characterized by sinusoidal oscillations of the torus itself (modes 1, 3, 5, 7, 11, 16). The dispersion diagram of these modes, which we refer to as crown-modes, is depicted in figure 7 for two different samples. The respective wavelength is given by twice the distance between two adjacent nodes of each mode. The frequencies of the crown modes observed in microtoroids of different circumference and torus diameter (/ and /) allow a simultaneous quadratic fit with the frequencies following a quadratic dependence on the wave vector . This uniform dependence shows that in this mode family the silica torus, despite its attachment to the silica disk, behaves effectively like an independent element. The observed quadratic dispersion relation rules out the presence of tensile stress within the torus in radial direction as this would lead to linear dispersion characteristic of a vibrating string. Since the microtoroids undergo a reflow process Armani2003 indeed all potentially present stresses should get relaxed during this fabrication step. As such, the observed quadratic dispersion characteristic for a rigid ring structure confirms this expectation.
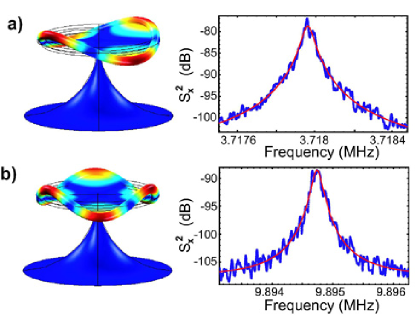
The study of clamping losses in the radial breathing mode and the optimization of its mechanical Q factors Anetsberger2008 also lead to the observation of very high Q crown modes. For these measurements, the cavities are operated in low-pressure environment () in order to reduce viscous damping, which limited the Q’s of the previously discussed modes to values . For such a measurement, figure 8 shows the second and third order crown modes with Q factors exceeding 50’000 at frequencies below . These high Q factors are attributed to low clamping losses which are studied in detail in Anetsberger2008 .
V Conclusions
In conclusion, we have shown that high-finesse whispering gallery modes are extraordinarily well suited as transducers for micromechanical motion. Sensitivities on the order of are achieved, on par with the best reported values Arcizet2006 ; Caniard2007a . The small dimensions of the WGM resonators allow in addition extending the measurement bandwidth by more than an order of magnitude compared to earlier work Arcizet2006 ; Caniard2007a . This enlarged range conicides with the resonance frequencies of the mechanical modes of interest present in the device. For example, the radial breathing mode (RBM), particularly amenable to optomechanical effects due to its small effective mass (), typically exhibits a resonance frequency around . At this frequency, average thermal phonon occupancies below unity are achieved at temperatures . Approaching such temperatures appears feasible using a combination of conventional cryogenics and resolved-sideband cooling Schliesser2008 . It is interesting that the expected spectrum of even the zero-point fluctuations of this mode peaks at a value of , assuming an effective after cryogenic and laser cooling. Such signal levels may be detected on top of the background of the thermal noises studied here, providing a route towards experimental tests of the theory of quantum measurements on mesoscopic objects. Finally, we note that the advantageous properties of WGM resonators may also be exploited for motion transduction of a mechanical oscillator external to the cavity, for example, by bringing it into the near field of the whispering gallery mode.
Acknowledgements
The authors acknowledge discussions with T. W. Hänsch and J. Kotthaus. T. J. K. acknowledges support through an Independent Max Planck Junior Research Group Grant, a Marie Curie Excellence Grant (JRG-UHQ) and the DFG-funded Nanosystems Initiative Munich (NIM). The authors gratefully acknowledge J. Kotthaus for access to clean-room facilities for microfabrication.
References
- [1] V. B. Braginsky and A. B. Manukin. Measurement of Weak Forces in Physics Experiments. University of Chicago Press, 1977.
- [2] D. Rugar, R. Budakian, H. J. Mamin, and B. W. Chui. Single spin detection by magnetic resonance force microscopy. Nature, 430:329–332, 2004.
- [3] V. B. Braginsky and F. Y. Khalili. Quantum Measurement. Cambridge University Press, 1992.
- [4] R. P. Griffard. Ultimate sensitivity of a resonant gravitational wave antenna using a linear motion detector. Physical Review D, 14:2478–2485, 1976.
- [5] T. J. Kippenberg, H. Rokhsari, T. Carmon, A. Scherer, and K. J. Vahala. Analysis of Radiation-Pressure Induced Mechanical Oscillation of an Optical Microcavity. Physical Review Letters, 95(3):033901, 2005.
- [6] H. Rokhsari, T. J. Kippenberg, T. Carmon, and K. J. Vahala. Radiation-pressure-driven micro-mechanical oscillator. Optics Express, 13(14):5293–5301, 2005.
- [7] S. Gigan, H. R. Böhm, M. Paternosto, F. Blaser, G. Langer, J. B. Hertzberg, K. C. Schwab, D. Bäuerle, M. Aspelmeyer, and A. Zeilinger. Self-cooling of a micromirror by radiation pressure. Nature, 444:67–70, 2006.
- [8] O. Arcizet, P.-F. Cohadon, T. Briant, M. Pinard, A. Heidmann, J.-M. Mackowski, C. Michel, L. Pinard, O. Francais, and L. Rousseau. High-sensitivity optical monitoring of a micromechanical resonator with a quantum-limited optomechanical sensor. Physical Review Letters, 97:133601, 2006.
- [9] A. Schliesser, P. Del’Haye, N. Nooshi, K.J. Vahala, and T. Kippenberg. Radiation pressure cooling of a micromechanical oscillator using dynamical backaction. Physical Review Letters, 97:243905, 2006.
- [10] T. J. Kippenberg and K. Vahala. Cavity Opto-Mechanics. Optics Express, 15:17172–17205, 2007.
- [11] C. M. Caves. Quantum-mechanical radiation-pressure fluctuations in an interferometer. Physical Review Letters, 45(2):75–79, Jul 1980.
- [12] A. N. Cleland, J. S. Aldridge, D. C. Driscoll, and A. C. Gossard. Nanomechanical displacement sensing using a quantum point contact. Applied Physics Letters, 81(9):1699–1701, 2002.
- [13] M. Poggio, M. P. Jura, C. L. Degen, M. A. Topinka, H. J. Mamin, D. Goldhaber-Gordon, and D. Rugar. An off-board quantum point contact as a sensitive detector of cantilever motion. arXiv, page 0803.1464v1, 2008.
- [14] R. G. Knobel and A. N. Cleland. Nanometre-scale displacement sensing using a single-electron transistor. Nature, 424:291–293, 2003.
- [15] M. D. LaHaye, O. Buu, B. Camarota, and K. C. Schwab. Approaching the quantum limit of a nanomechanical resonator. Science, 304:74–77, 2004.
- [16] N. E. Flowers-Jacobs, D. R. Schmidt, and K. W. Lehnert. Intrinsic noise properties of atomic point contact displacement detectors. Physical Review Letters, 98:096804, 2007.
- [17] C. A. Regal, J. D. Teufel, and K. W. Lehnert. Measuring nanomechanical motion with a microwave cavity interferometer. arXiv, page 0801:1827v1, 2008.
- [18] K. L. Ekinci, Y. T. Yang, X. M. H. Huang, and M. L. Roukes. Balanced electronic detection of displacement in nanoelectromechanical systems. Applied Physics Letters, 81(12):2253–2255, 2002.
- [19] A. Gaidarzhy, G. Zolfagharkhani, R. L. Badzey, and P. Mohanty. Spectral response of a gigahertz-range nanomechanical oscillator. Applied Physics Letters, 86:254103, 2005.
- [20] Y. Hadjar, P. F. Cohadon, C. G. Aminoff, M. Pinard, and A. Heidmann. High-sensitivity optical measurement of mechanical brownian motion. Europhysics Letters, 47(5):545–551, 1999.
- [21] T. Corbitt, Ch. Wipf, T. Bodiya, D. Ottaway, D. Sigg, N. Smith, S. Whitcomb, and N. Mavalvala. Optical dilution and feedback cooling of a gram-scale oscillator to 6.9 mK. Physical Review Letters, 99(16):160801, 2007.
- [22] T. Caniard, T. Briant, P.-F. Cohadon, M. Pinard, and A. Heidmann. Ultrasensitive Optical Measurement of Thermal and Quantum Noises. Optics and Spectroscopy, 103:225–230, 2007.
- [23] P.-F. Cohadon, A. Heidmann, and M. Pinard. Cooling of a mirror by radiation pressure. Physical Review Letters, 83(16):3174–3177, 1999.
- [24] O. Arcizet, P.-F. Cohadon, T. Briant, M. Pinard, and A. Heidmann. Radiation-pressure cooling and optomechanical instability of a micromirror. Nature, 444:71–74, 2006.
- [25] D. Kleckner and D. Bouwmeester. Sub-kelvin optical cooling of a micromechanical resonator. Nature, 444:75–78, 2006.
- [26] T. Corbitt, Y. Chen, E. Innerhofer, H. Muller-Ebhardt, D. Ottaway, H. Rehbein, D. Sigg, S. Whitcomb, Ch. Wipf, and N. Mavalvala. An all-optical trap for a gram-scale mirror. Physical Review Letters, 98(15):150802, 2007.
- [27] M. Poggio, L. Degen, J. J. Mamin, and D. Rugar. Feedback cooling of a cantilever’s fundamental mode below 5 mk. Physical Review Letters, 99:017201, 2007.
- [28] J. D. Thomson, B. M. Zwickl, A. M. Jayich, F. Marquardt, S. M. Girvin, and J. G. E. Harris. Strong dispersive coupling of a high finesse cavity to a micromechanical membrane. Nature, 452:72–75, 2008.
- [29] A. Schliesser, R. Rivière, G. Anetsberger, O. Arcizet, and T. Kippenberg. Resolved-sideband cooling of a micromechanical oscillator. Nature Physics, 2008.
- [30] D. K. Armani, T. J. Kippenberg, S. M. Spillane, and K. J. Vahala. Ultra-high-Q toroid microcavity on a chip. Nature, 421(6926):925–928, 2003.
- [31] V. B. Braginsky and S. P. Vyatchanin. Low quantum noise tranquilizer for fabry-perot interferometer. Physics Letters A, 293:228–234, 2002.
- [32] I. Wilson-Rae, N. Nooshi, W. Zwerger, and T. J. Kippenberg. Theory of ground state cooling of a mechanical oscillator using dynamical backaction. Physical Review Letters, 99(9):093901, 2007.
- [33] F. Marquardt, J. P. Chen, A. A. Clerk, and S. M. Girvin. Quantum theory of cavity-assisted sideband cooling of mechanical motion. Physical Review Letters, 99(9):093902, 2007.
- [34] T. W. Hänsch and B. Couillaud. Laser frequency stabilization by polarization spectroscopy of a reflecting reference cavity. Optics Communications, 35(3):441–444, 1980.
- [35] M. L. Gorodetsky and I. S. Grudinin. Fundamental thermal fluctuations in microspheres. Journal of the Optical Society of America B, 21:697–705, 2004.
- [36] C. Fabre, M. Pinard, S. Bourzeix, A. Heidmann, E. Giacobino, and S. Reynaud. Quantum-noise reduction using a cavity with a movable mirror. Physical Review A, 49:1337–1343, 1994.
- [37] R. E. Slusher, L. W. Hollberg, B. Yurke, J. C. Mertz, and J. F. Valley. Observation of squeezed states generated by four-wave mixing in an optical cavity. Physical Review Letters, 55:2409–2412, 1985.
- [38] I. Tittonen, G. Breitenbach, T. Kalkbrenner, T. Müller, R. Conradt, S. Schiller, E. Steinsland, N. Blanc, and N. F. de Rooij. Interferometric measurements of the position of a macroscopic body: Towards observations of quantum limits. Physical Review A, 59(2):1038–1044, 1999.
- [39] V. S. Ilchenko and A. B. Matsko. Optical resonators with whispering-gallery modes - part ii: Applications. IEEE Journal of Selected Topics in Quantum Electronics, 12(1):15–32, 2006.
- [40] T. Carmon and K. Vahala. Modal spectroscopy of optoexcited vibrations of a micron-scale on-chip resonator at greater than 1 ghz frequency. Physical Review Letters, 98:123901, 2007.
- [41] H. A. Haus. Waves and fields in optoelectronics. Prentice-Hall, 1984.
- [42] V. Giovannetti and D. Vitali. Phase-noise measurement in a cavity with a movable mirror undergoing quantum brownian motion. Physical Review A, 63:023812, 2001.
- [43] D.F. Walls and G. J. Milburn. Quantum Optics. Springer, 2008.
- [44] V. B. Braginskii and A. B. Manukin. Ponderomotive effects of electromagnetic radiation. Soviet Physics JETP Letters, 25(4):653–655, 1967.
- [45] S. M. Spillane, T. J. Kippenberg, O. J. Painter, and K. J. Vahala. Ideality in a Fiber-Taper-Coupled Microresonator System for Application to Cavity Quantum Electrodynamics. Physical Review Letters, 91(4):043902, 2003.
- [46] H. P. Yuen and V. W. S. Chan. Noise in homodyne and heterodyne detection. Optics Letters, 8:177–179, 1983.
- [47] T. Briant, P.-F. Cohadon, A. Heidman, and M. Pinard. Optomechanical characterization of acoustic modes in a mirror. Physical Review A, 68:033823, 2003.
- [48] O. Hahtela, K. Nera, and I. Tittonen. Position measurement of a cavity mirror using polarization spectroscopy. Journal of Optics A, 6:S115–S120, 2004.
- [49] L. D. Landau and E. M. Lifshitz. Statistical Physics, volume 5 of Course of Theoretical Physics. Pergamon Press, 3rd edition, 1980.
- [50] V. B. Braginsky, M.L. Gorodetsky, and S.P. Vyatchanin. Thermo-refractive noise in gravitational wave antennae. Physics Letters A, 271:303–307, 2000.
- [51] B. Schröter, C. Reich, O. Arcizet, J. O. Rädler, B. Nickel, and T. J. Kippenberg. Chip based, lipid bilayer functionalized microresonators for label-free, ultra sensitive and time-resolved molecular detection. submitted, 2008.
- [52] Y.-S. Park and H. Wang. Regenerative pulsation in silica microspheres. Optics Letters, 32:3104–3106, 2007.
- [53] V. B. Braginsky, M. L. Gorodetsky, and S. P. Vyatchanin. Thermodynamical fluctuations and photo-thermal shot noise in gravitational wave antennae. Physics Letters A, 264:1–10, 1999.
- [54] A. B. Matsko, A. A. Savchenko, N. Yu, and L. Maleki. Whispering-gallery-mode resonators as frequency references. i. fundamental limitations. Journal of the Optical Society of America B, 24:1324–1335, 2007.
- [55] T. J. Kippenberg, S. M. Spillane, and K. J. Vahala. Kerr-nonlinearity optical parametric oscillation in an ultrahigh-q toroid microcavity. Physical Review Letters, 93(8):083904, 2004.
- [56] P. Del’Haye, A. Schliesser, O. Arcizet, T. Wilken, R. Holzwarth, and T. Kippenberg. Optical frequency comb generation from a monolithic microresonator. Nature, 450:1214–1217, 2007.
- [57] R. Ma, A. Schliesser, P. Del’Haye, A. Dabirian, G. Anetsberger, and T. Kippenberg. Radiation-pressure-driven vibrational modes in ultrahigh-q silica microspheres. Optics Letters, 32(16):2200–2202, 2007.
- [58] Y. S. Park and H. L. Wang. Radiation pressure driven mechanical oscillation in deformed silica microspheres via free-space evanescent excitation. Optics Express, 15:16471–16477, 2007.
- [59] J. R. Clark, W. T. Hsu, M. A. Abdelmoneum, and C. T.-C. Nguyen. High-Q UHF micromechanical radial-contour mode disk resonators. Journal of Microelectromechanical Systems, 14:1298, 2005.
- [60] A. N. Cleland. Foundations of Nanomechanics. Springer, 2003.
- [61] G. Anetsberger, R. Rivière, A. Schliesser, O. Arcizet, and T. J. Kippenberg. Demonstration of ultra low dissipation optomechanical resonators on a chip. arXiv:0802.4384, 2008.