-
The Molecular Ridge Close to 30 Doradus in the Large Magellanic Cloud
Abstract:
With the ATNF Mopra telescope we are performing a survey in the 12CO(1-0) line to map the molecular gas in the Large Magellanic Cloud (LMC). For some regions we also obtained interferometric maps of the high density gas tracers HCO+ and HCN with the Australia Telescope Compact Array (ATCA). Here we discuss the properties of the elongated molecular complex that stretches about 2 kpc southward from 30 Doradus. Our data suggests that the complex, which we refer to as the “molecular ridge,” is not a coherent feature but consists of many smaller clumps that share the same formation history. Likely molecular cloud formation triggers are shocks and shearing forces that are present in the surrounding south-eastern H i overdensity region, a region influenced by strong ram pressure and tidal forces. The molecular ridge is at the western edge of the the overdensity region where a bifurcated velocity structure transitions into a single disk velocity component. We find that the 12CO(1-0) and H i emission peaks in the molecular ridge are typically near each other but never coincide. A likely explanation is the conversion of warmer, low-opacity H i to colder, high-opacity H i from which H2 subsequently forms. On smaller scales, we find that very dense molecular gas, as traced by interferometric HCO+ and HCN maps, is associated with star formation along shocked filaments and with rims of expanding shell-like structures, both created by feedback from massive stars.
Keywords: ISM: evolution — ISM: molecules — galaxies: ISM — galaxies: individual(Large Magellanic Cloud) — radio lines: ISM — (galaxies:) Magellanic Clouds
1 Introduction
The study of star formation (SF) in molecular clouds is an area which has seen rapid progress in recent years and the Magellanic Clouds are increasingly seen as one of the most important laboratories for this research. At a distance of about 50–60 kpc and an inclination angle of (van der Marel & Cioni 2001) for the Large Magellanic Cloud (LMC), current and future instruments can resolve individual star-forming regions on sub–parsec scales and, at the same time, assess the global picture on galactic scales. The Magellanic Clouds also contain a large range of very different environments that can be observed to test theories of star formation. The 30 Doradus (30 Dor) region in the LMC, for example, is the most vigorous site of current SF in the Local Group. Consequently, the surroundings of 30 Dor are dominated by a strong far–UV radiation field. Possible triggering of SF on expanding shells can be studied, e.g., in the LMC 4 region toward the northeast of the LMC (e.g. Braun et al. 1997; Yamaguchi et al. 2001; Cohen et al. 2003). In addition, the LMC and the Small Magellanic Cloud (SMC) are gravitationally interacting with each other and with the Galaxy (cf. the numerical models of, e.g., Murai & Fujimoto 1980; Gardiner et al. 1994; Staveley-Smith et al. 2003; Connors et al. 2006), and the motion of the LMC through the Galactic halo causes strong ram pressure effects (e.g. de Boer et al. 1998a). It should be noted, however, that tidal or ram pressure models alone cannot explain the full morphology and dynamics of the gas and stars in the Magellanic System, and a synthesis of both is likely required (Mastropietro et al. 2005). All of these external interactions, as well as factors internal to the LMC (e.g., shocks, density waves, and bar-induced motions), influence the ability to form stars on local and global scales and can potentially be studied in the Magellanic Clouds in great detail.
Also, with metallicities of % and % solar in the LMC and SMC, respectively, cooling and chemistry of gas in the Magellanic Clouds are clearly different than in the Galaxy and the conditions may resemble those at higher redshifts, at times when galaxies were generally less evolved than today. Another important property of the Magellanic Clouds and in particular the LMC is that the numbers of resolved giant molecular clouds with associated star formation is large. For example, Fukui et al. (1999) counted 107 molecular complexes in the 2.6′ (=37 pc) resolution NANTEN 12CO(1-0) survey of the LMC. It is therefore possible to derive statistically meaningful results for a large sample of regions, all at the same distance and therefore resolution.
The location of 30 Dor and the surrounding massive atomic and molecular gas reservoir dominating the south-eastern part of the LMC had led to many speculations on its structure and star forming history. Fujimoto & Noguchi (1990), for example and, more recently, Bekki & Chiba (2007) were able to model this region based on dynamical and hydro–dynamical simulations of the LMC–SMC interaction, not including the Galaxy. Gardiner et al. (1998), on the other hand attempted to simulate the amount of star formation based on the dynamics of the off-center bar in the LMC. Their simulations, though not designed to predict the gas distribution, do show that asymmetries can be induced by the bar. de Boer et al. (1998a) pointed out that the ages of structures in the LMC increase clockwise from the eastern 30 Dor region toward the north. They argued that the LMC may undergo SF triggered by a bow-shock at the eastern edge, where the ram pressure due to the LMC’s motion through the Galactic halo is expected to be greatest. The clockwise rotation of the LMC then turns the newly formed, but now aging stellar populations toward the north. In other words, ram pressure creates a ’hot spot’ of SF (currently 30 Dor) that remains in the eastern part of the LMC while the galaxy rotation brings fresh gas toward and newly formed stars away from it. If this interpretation is correct, one may infer that conditions upstream from 30 Dor, i.e., from the east toward the south, may be those encountered just before stars eventually form. This would be a very fortunate situation as it is usually difficult to predict the timescales and locations of future SF in galaxies.
It is common knowledge that stars form out of molecular gas, and indeed the region south of 30 Dor contains a remarkably straight, elongated CO structure which we refer to as the “molecular ridge.” 12CO(1-0) maps from the Columbia survey (Cohen et al. 1988), the NANTEN telescope (Fukui et al. 1999), and the SEST key project (Kutner et al. 1997; Johansson et al. 1998) show that, with a mass of M⊙, about 1/3 of all of the molecular gas that is traced by CO is found in this structure stretching kpc south of 30 Dor. Johansson et al. (1998) provides an analysis of the N 159 and 30 Dor regions and they find kinetic temperatures in the 10-50 K range. Kutner et al. (1997) were able to describe the southern part of the molecular ridge but they restricted their analysis to a description of the general morphology of the feature and a comparison of line strength to those in Galactic clouds.
In this paper we present first results of a comprehensive, high angular resolution 12CO(1-0) survey of the entire molecular ridge obtained with the ATNF Mopra111The Mopra radio telescope is part of the Australia Telescope which is funded by the Commonwealth of Australia for operation as a National Facility managed by CSIRO. telescope. The observations are the pilot for the MAGMA project (‘The Magellanic Mopra Assessment’) which is currently underway and which will provide high resolution 12CO(1-0) maps of molecular clouds across the entire LMC and SMC, mapping all regions where NANTEN has detected emission, but with a beam size times smaller in area. In terms of sensitivity and resolution, MAGMA is comparable to the SEST key program but MAGMA encompasses all CO traced molecular clouds rather than a selected ensemble. In Sect. 2 we describe the observations and data reduction, which is followed by the presentation of our results in Sect. 3. A discussion of the results is provided in Sect. 4 and a summary in Sect. 5.
2 Observations and Data Reduction
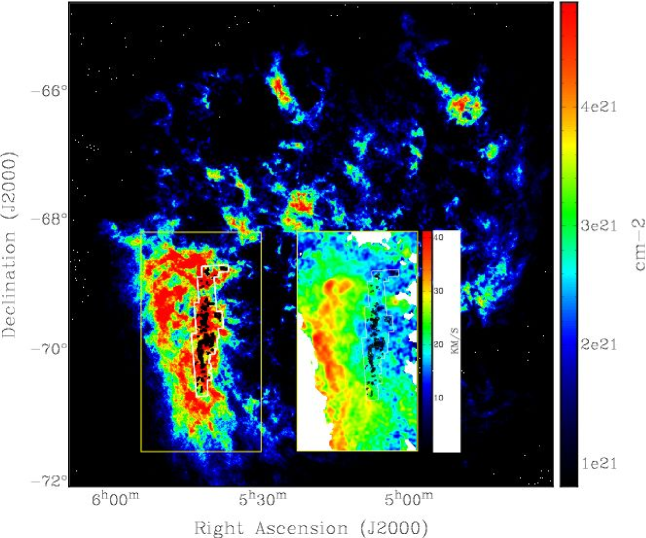
During the 2005 southern winter season, we observed the molecular ridge close to 30 Dor with the single dish Mopra telescope in the 12CO(1-0) molecular transition (rest frequency: 115.271 GHz). Mopra was used in the on–the–fly mapping mode and we observed about maps in two orthogonal scanning directions with 1.8 h integration time each. The total time on source was therefore of order 250 h. The Mopra AT correlator was set up to observe at a bandwidth of 64 MHz split into 1024 channels. This corresponds to a velocity coverage of km s-1 and a resolution of km s-1 and the spectral window was centered on a velocity of 230 km s-1 LSR. The observation of each map was preceded by pointing calibration on the bright SiO maser R Dor, with typical corrections less than 5”. system temperatures of the observations were usually K and the data were calibrated against a warm absorber that was inserted every minutes. The final data set has a size of which, at an assumed distance of the LMC of 50 kpc, corresponds to kpc kpc, the long side along declination. A map of the survey region is shown in Fig. 1. The natural spatial resolution of Mopra at GHz is about . The data was reduced with the ATNF package livedata to derive the quotient against line–free reference positions up to away from the observed fields. First–order baselines fitted to line–free channels were subtracted from the resulting spectra. All data were regridded to produce a position-position-velocity 3-dimensional data cube using gridzilla. The ‘inner’ Mopra error beam is in the range of 40”-80” which is similar to the size of the emission and for the analysis here we applied the extended beam efficiency of (Ladd et al. 2005) to convert to extended beam brightnesses . For better signal–to–noise ratios, the data were eventually smoothed to a resolution of , which corresponds to a physical length of pc. The rms noise of the data is about 0.4 K in a 0.16 km s-1 velocity channel. A comparison with earlier SEST data at a similar resolution (Johansson et al. 1998) toward the molecular gas in N 159 shows that the Mopra and SEST fluxes agree within 10%.
3 Results
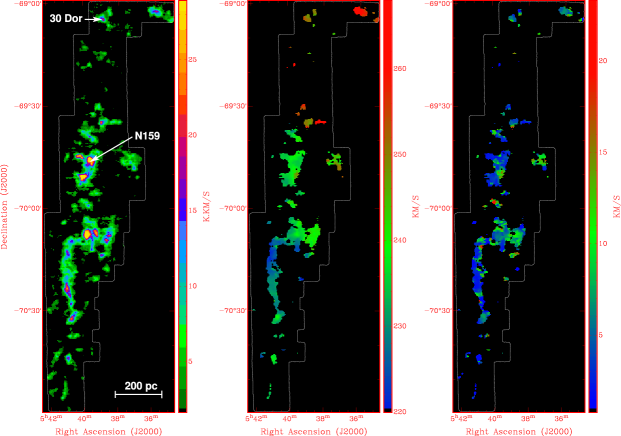
Maps of the molecular ridge derived from the 12CO(1-0) data cube are displayed in Fig. 2. The integrated intensity map clearly shows that the molecular ridge is a slim (width: pc) but long ( kpc) feature along the declination axis. The brightest clumps are toward the N159 region (see Fig. 2) and about half a degree south of it at the ‘kink’ of the ridge. Between N159 and 30 Dor relatively little molecular gas is observed. Using the Strong et al. (1988) ‘standard’ Galactic CO intensity–to–H2 column density () conversion factor of cm-2 (K km s-1)-1 the detection limit (3 consecutive channels with 3 detection each) is at about cm-2 (corresponding to a mass of M⊙ within a beam) and for the molecular ridge we derive a total molecular gas mass of about M⊙. But note that studies of CO with the Columbia 1.2 m, the SEST and NANTEN telescopes have shown that the LMC factor may be a few times larger than this Galactic value (Cohen et al. 1988; Israel 1997; Fukui et al. 1999, but see Pineda et al. 2008). For their NANTEN survey data, Fukui et al. (1999) use of N (K km s-1)-1 and they derive a value of M⊙ for the entire molecular gas in the LMC. If there are no variations of within the LMC, the ratio of the fluxes should equal the ratio of masses and if we compare our values to those of NANTEN, we confirm that the molecular ridge contains about of the total molecular mass of the LMC.
4 Discussion
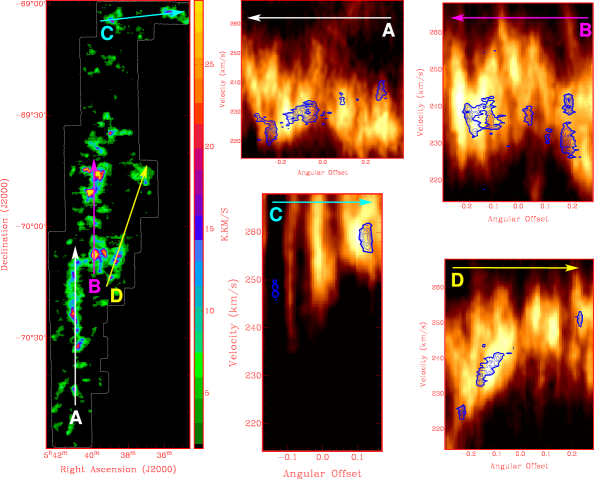
The very thin and long shape of the molecular ridge would argue for it to be a coherent structure. A comparison of the H i and CO velocities in various position–velocity diagrams along the ridge (Fig. 3, ATCA222The Australia Telescope Compact Array is part of the Australia Telescope which is funded by the Commonwealth of Australia for operation as a National Facility managed by CSIRO. H i observations are taken from Kim et al. 1998) shows, however, that the molecular clumps are not confined to a specific velocity component of the atomic gas. In addition, the molecular clumps are somewhat separated from each other, only connected by some faint common molecular envelope. This is even more obvious when the 3-dimensional position-position-velocity data cube is rotated around the declination axis. In a more global context the molecular gas in the ridge finds itself on the western edge of the south-eastern high-column density region in the LMC, at a position where the H i column densities are still high. However, the H i emission is bifurcated in two velocity components, called the disk and ‘L’ component (Luks & Rohlfs 1992). The velocity separation of the two components is very large towards the eastern edge of the LMC, but they start to merge into a single velocity component at about the position of the molecular ridge (see the second moment image in Fig. 1). This suggests that the clumps in the molecular ridge were created by the same large-scale triggering event and thus have similar formation histories, not only in environmental terms but also on similar timescales.
4.1 Molecular Cloud Formation
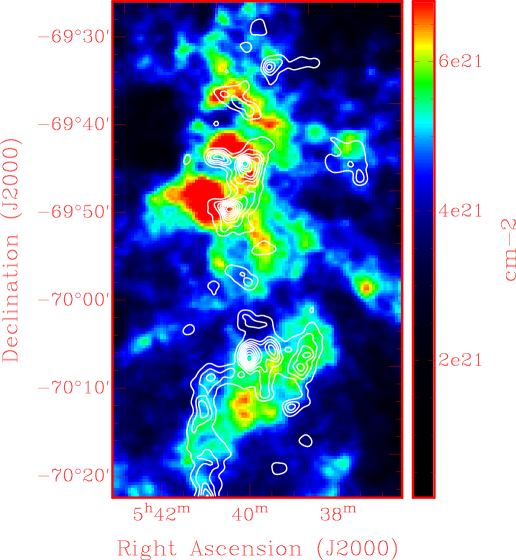
In Fig. 4, CO contours are overlaid over an integrated H i column density map. The CO peaks are usually found very close to H i peaks but they virtually never coincide. Such a morphology was already indicated by the lower resolution NANTEN data (resolution: ) and with the high angular resolution of Mopra, this is unambiguously confirmed. If, instead of the integrated H i column density, the H i peak flux is compared to the 12CO(1-0) intensity, the peaks of the two gas tracers are getting slightly closer to each other but they still never coincide. To quantify this effect, pixel-to-pixel correlations between the CO luminosity and the H i column density and H i peak brightness temperature are shown in Fig. 5. The CO bright pixels are at intermediate H i column densities and brightnesses and not at the largest values. In particular, the H i peak brightness values where the brightest CO emission is observed hovers around 60 to 100 K. In the following, we will discuss different mechanisms that may be responsible for the shift of the CO and H i emission peaks:
1. Rapid conversion of warm H i into H2.
At a certain threshold, the atomic gas combines into molecular hydrogen and more than just the gas above the threshold is converted, creating slight depressions in the map of atomic H i. If the H i gas remains optically thin one can determine the entire amount and distribution of hydrogen atoms from both, H i and H2 in the gas. In this scenario one would expect a smooth distribution of hydrogen, some in atomic, and some in molecular form. As an example we consider N159. The atomic gas in this region has typical column densities of cm-2 whereas the H i at the positions of the CO peaks have a somewhat lower column of N(H i) cm-2. The CO peaks (smoothed to the resolution of the H i map, 60′′) have intensities of K km s-1. Converted with a Galactic factor, this becomes an H2 column density of N(H2) cm-2 which adds to the aforementioned H i column density of cm-2. In total, the hydrogen column density at the positions of the molecular clouds is determined to be N(Htotal)=N(H i)+2 N(H2) cm-2. This is a factor of larger than the H i column that surrounds the molecular clumps but where no CO is detected. Therefore, the total (H i + 2 H2) hydrogen column density map exhibits a jump rather than a smooth transition whenever molecular gas is present. This sharp edge cannot be softened by a variation of the factor. E.g., Fukui et al. (1999) and Israel (1997) find that the LMC has an factor a few times larger than the Galactic value. Using such a higher would result in larger H2 columns and therefore in an even steeper rise of total hydrogen column densities. If the factor is changed to produce smooth hydrogen maps, where the H2 traced by CO fills in the ’holes’ of H i, one requires an of about 3 times less than the Galactic value. No study of the LMC or of any other low metallicity object has shown such low factors before.
This comparison, however, is only valid if all molecular gas is traced by CO. If there are extended regions with molecular gas that is not traced by CO, e.g., at low densities when CO may be dissociated by the surrounding radiation field but H2 is not, the sharp contrast in the total hydrogen map may be smoothed out. Such an H2 phase is hard to detect and one of the best approaches is UV absorption spectroscopy. Tumlinson et al. (2002) performed such a survey toward many sightlines in the LMC with FUSE. They find that the molecular hydrogen, with a fraction of % (cf. Galaxy: %), is not a huge contributor to the entire gaseous ISM (see also the ORFEUS UV absorption observation presented in de Boer et al. 1998b). They were also observing sightlines close to 30 Doradus where the UV radiation is very strong. If there are large amounts of H2 that are not traced by CO due to the higher dissociation energy of H2 they should be most obvious toward that region. Indeed, the total column of H2 they find close to 30 Dor is with cm-2 one of the largest in their survey. However, the H i column density towards the same sightline is times larger. Similar fractions are found all across the LMC and the column of H2 in absorption never exceeds that of H i. It is therefore unlikely that the contrast between the H i and H2 column densities as traced by CO could be smoothed out with extended layers of molecular gas that are undetected in CO observations. This is in contrast to dust extinction studies which suggest that there may be large, not CO traced reservoirs of molecular gas in the LMC (e.g. Imara & Blitz 2007).
To conclude, the shifts of the H i and the CO peaks are probably not simply a result of warm hydrogen atoms (WNM) combining into H2. However, gravitation may accumulate a lot of material quickly in the densest molecular cores. Typical shifts between CO and H i peaks are of order 2′, which corresponds to pc. Within a typical free fall time of a Myr, self-gravitation would accelerate the gas to a velocity of about 30 km s-1, a velocity gradient that is not ruled out by the position velocity diagrams displayed in Fig. 3.
2. WNM to CNM to H2 conversion.
As shown in Fig. 5, the H i brightness temperature, at the location where most and the brightest molecular material resides, falls into the range of 60 to 100 K which corresponds to the kinetic temperature of the cold neutral medium in the Galactic disk (CNM, e.g., Dickey & Lockman 1990). A conversion of WNM to CNM can be achieved by a shock. Indeed, the atomic gas to the east of the molecular ridge is prone to ram pressure effects as this side is the leading edge towards the Milky Way halo. The region is also influenced by tidal effects (e.g. Staveley-Smith et al. 2003; Mastropietro et al. 2005) and it has even been speculated that this region is responsible for the origin of the Magellanic Stream (Nidever et al. 2007). The second moment map of the H i in Fig. 1 is in fact not dominated by the intrinsic line width of the neutral gas but by the separation of disk and ’L’ velocity components. At the eastern edge the separation is very large and the two components become closer in velocity space toward the western direction. At the position of the molecular ridge the disk and ’L’ components start to merge. To date the origin of the bifurcation is still under discussion (e.g. Bekki & Chiba 2007; Nidever et al. 2007) but whether it is ram pressure or tidal effects or both, the shear and shocks from such an interaction introduces energy into the ISM that may reduce the likeliness to form molecular clouds. Indeed, some molecular complexes, the ’arc’ clouds, are found in the region (Mizuno et al. 2001) but the bulk of molecular gas, the molecular ridge, is found where the disk and ’L’ components start to merge into a single velocity component. If this indicates that they are also spatially merging, one may speculate that only the combination of both components can provide enough shielding for the gas to cool down and to become molecular.
In other words, shocks and/or shearing forces propagating from the eastern edge may convert some of the WNM into CNM. When the disk and ’L’ component merge they may provide enough shielding to convert part of the CNM into molecular gas and the remaining, cold H i becomes optically thick and thus levels off at a brightness temperature close to the kinetic temperature of the CNM.
3. H i accretion.
The above process does not have to be static. As discussed earlier, we cannot rule out gas moving at speeds that are required to match free-fall timescales. H i accretion after the formation of the first molecular cores may be responsible for the pile–up of neutral gas close to the molecular clouds. In this scenario, once the atomic gas comes close to the molecular clumps, the gas is shielded, cooled, and converted into H2 (see also Fukui 2007). H i accretion may therefore be described as a cooling flow. Cooling flows would result in decreasing H i line widths toward the molecular cores. We do not observe this on the scales of the H i-CO peak offsets but the most significant cooling may happen only very close to the molecular cores, too close to be resolved with the ATCA H i observations at 21 cm.
4. Mechanical feedback from massive stars.
Newly formed, massive stars deposit large amounts of energy into the
surrounding interstellar medium (ISM) in the form of strong stellar
winds and supernovae. Virtually all star-forming galaxies exhibit an
ISM that is dominated by a wealth of expanding shells of all
sizes. Kim et al. (2007) catalog the expanding shells in the LMC. Along
the molecular ridge, the number density of the shells seems to be
lower than in the rest of the LMC. It should therefore not have a
significant effect on the distribution of the atomic and molecular
gas. For some regions like the N 159 region, however, some
shell–like structure is observed in H i and dust maps (cf.
Fig. 6) and the CO emission toward this position may
coincide with the inner side of the ring, similar to what is
observed toward other expanding Galactic shells or LMC 4 (Yamaguchi et al. 2001; Cappa et al. 2005).
The scenario that best fits the observations is the second one, in which shocks transform WNM into optically thick CNM followed by conversion into H2, with or without H i accretion. The very sharp rise of the total hydrogen column density inferred at the position of the molecular gas is likely an artifact of high H i optical depth. On the other hand, the confinement of CO emission to clumpy structures suggests an important role for self-gravity in shaping the molecular clouds.
4.2 Star Formation
Typical H i column density thresholds in massive and dwarf galaxies, above which SF is observed hover around a canonical value of cm-2 (e.g. Walter et al. 2007). Below this threshold SF appears to be suppressed. For most of the LMC this rule holds well. However, the south-eastern region, dominated by ram pressure and tidal forces of the LMC/SMC/Milky Way interaction, appears to be different. Virtually no SF, as traced by H, is observed in this region at positions where the H i column density is below cm-2. This may be due to the tidal and ram pressure forces in the two gas components of the south–eastern LMC.
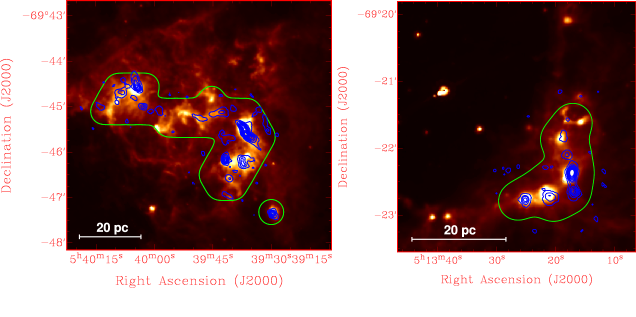
On smaller scales, SF occurs in the very densest molecular clumps. We conducted a survey with the ATCA of the high-density gas tracers HCO+ and HCN towards the star-forming regions N159 (40 pointing mosaic) in the molecular ridge and toward N113 (7 pointing mosaic) at the western tip of the LMC bar. The observations have a resolution of which, at the distance of the LMC, corresponds to a physical length of pc. Both of the observed molecules are only excited at volume densities exceeding cm-3. HCO+, however, is also a tracer for photo-dominated regions and can also form in more diffuse material where the C+ abundance is high. Integrated HCO+ intensity maps overlaid on 8 Spitzer maps are shown in Fig. 6. In both regions, the dense molecular gas typically overlaps or is adjacent to bright infrared (IR) emission peaks. These peaks are the locations where individual stars and stellar clusters eventually form within the larger molecular complexes traced by CO. Comparing the HCN and HCO+ maps, we find that, after beam deconvolution, the HCO+ emission is about 20-30% more extended than the HCN clumps, in agreement with the results presented in Wong et al. (2006). The m IR morphology of N159 appears to be ring–like and indeed it is a 1-2 Myr old wind–blown bubble created by a central, massive star (Jones et al. 2005). Most of the dense molecular gas is situated at the rim of this shell, with relatively little observed at projected sightlines towards the interior. N113, in contrast, is a long, bent string of several individual knots, both visible in the IR and in the HCO+ and HCN maps. The string of knots curves from the south-east towards the north. This morphology appears reminiscent of a circular arc, and close to the center of this hypothetical circle, towards the north–east, one indeed finds HD 269219, a M⊙ supergiant B star and HD 269217, an emission-line star. Thus, the densest pockets of molecular gas and the associated star-forming regions appear to be located on a shock front created by the two energy–injecting massive stars, not unlike the situation of the shell in N159.
The two examples, and the above discussion on molecular cloud formation argues that shocks are the major mechanism to trigger both, the formation of low-density molecular clouds and the formation of star–forming, high-density molecular clumps within these larger structures.
5 Summary
The Large Magellanic Cloud is a unique object to study molecular cloud and star formation on galaxy-wide scales with high spatial detail and in a large range of very different environments. A very prominent molecular feature stretches from 30 Dor kpc southward; it contains about 1/3 of the entire molecular content of the LMC, as traced by CO. Our Mopra data of this molecular ridge reveals the following:
-
•
The structure is most likely not a coherent, large molecular complex but consists of smaller molecular clouds that are observed to be embedded in different velocity components of the neutral atomic gas. However, the global picture of the LMC shows that the molecular ridge is at the innermost edge of the south–eastern high-density region of the LMC, a region where tidal and ram pressure forces have a major influence on the state of the gas. The ridge coincides with H i at high column density and is just where the disk and ’L’ H i velocity components start to merge. Thus, the molecular clouds in the ridge are likely to share the same formation histories and timescales.
-
•
The local H i and CO peaks are typically displaced by pc. They are usually near each other but hardly ever coincident. A likely explanation for this morphology is that shocks propagate from the eastern edge of the LMC and turn warm H i into partly optically thick, cold H i and eventually into molecular hydrogen. This may happen in a static sense or via H i accretion. The hydrogen column densities within the molecular clumps are much larger than in the surrounding material, which indicates that the clouds are self–gravitating. Other mechanisms, such as feedback from massive stars may also be responsible for the shift of H i and CO peaks but are likely only playing a role for a small number of molecular complexes.
-
•
Very dense pockets of molecular gas, as traced by HCO+ and HCN, are found near and coinciding with strong IR emission. This strengthens the suggested correlation of the very dense gas and actual star formation rates. For the N159 and N113 regions we find the high density gas peaks to be mostly located on shock fronts and on the rims of expanding shells, powered by central, massive stars.
Over the coming years, the study of molecular gas in the LMC and SMC enters a new era. Our team will continue to map all the molecular gas in both systems with the Mopra (MAGMA survey) and ATCA telescopes. In addition, many new facilities are currently under construction or have just been completed that can be used to observe the LMC, such as APEX, ASTE, NANTEN2, ALMA, as well as satellites such as Herschel and Spitzer. Studying molecular gas in the LMC provides a unique link between Galactic and extragalactic observations and will be germane to the full understanding of star formation on all scales.
References
- Bekki & Chiba (2007) Bekki, K., & Chiba, M. 2007, PASA, 24, 21
- Braun et al. (1997) Braun, J. M., Bomans, D. J., Will, J.-M., & de Boer, K. S. 1997,A&A, 328, 167
- Cappa et al. (2005) Cappa, C., Niemela, V. S., Martín, M. C., & McClure-Griffiths, N. M. 2005, A&A, 436, 155
- Cohen et al. (1988) Cohen, R. S., Dame, T. M., Garay, G., Montani, J., Rubio, M., & Thaddeus, P. 1988, ApJL, 331, L95
- Cohen et al. (2003) Cohen, M., Staveley-Smith, L., & Green, A. 2003, MNRAS, 340, 275
- Connors et al. (2006) Connors, T. W., Kawata, D., & Gibson, B. K. 2006, MNRAS, 371, 108
- de Boer et al. (1998a) de Boer, K. S., Richetr, P., Bomans, D. J., Heithausen, A., & Koorneef, J. 1998, A&A, 338, L5
- de Boer et al. (1998b) de Boer, K. S., Braun, J. M., Vallenari, A., & Mebold, U. 1998, A&A, 329, L49
- Dickey & Lockman (1990) Dickey, J. M., & Lockman, F. J. 1990, ARA&A, 28, 215
- Fujimoto & Noguchi (1990) Fujimoto, M., & Noguchi, M. 1990, PASJ, 42, 505
- Fukui et al. (1999) Fukui, Y., et al. 1999, PASJ, 51, 745
- Fukui (2007) Fukui, Y. 2007, IAU Symposium, 237, 31
- Gardiner et al. (1994) Gardiner, L. T., Sawa, T., & Fujimoto, M. 1994, MNRAS, 266, 567
- Gardiner et al. (1998) Gardiner, L. T., Turfus, C., & Putman, M. E. 1998, ApJL, 507, L35
- Imara & Blitz (2007) Imara, N., & Blitz, L. 2007, ApJ, 662, 969
- Israel (1997) Israel, F. P. 1997, A&A, 328, 471
- Johansson et al. (1998) Johansson, L. E. B., et al. 1998, A&A, 331, 857
- Jones et al. (2005) Jones, T. J., Woodward, C. E., Boyer, M. L., Gehrz, R. D., & Polomski, E. 2005, ApJ, 620, 731
- Kim et al. (1998) Kim, S., Staveley-Smith, L., Dopita, M. A., Freeman, K. C., Sault, R. J., Kesteven, M. J., & McConnell, D. 1998, ApJ, 503, 674
- Kim et al. (2007) Kim, S., et al. 2007, ApJS, 171, 419
- Kutner et al. (1997) Kutner, M. L., et al. 1997, A&AS, 122, 255
- Ladd et al. (2005) Ladd, N., Purcell, C., Wong, T., & Robertson, S. 2005, PASA, 22, 62
- Luks & Rohlfs (1992) Luks, T., & Rohlfs, K. 1992, A&A, 263, 41
- Mastropietro et al. (2005) Mastropietro, C., Moore, B., Mayer, L., Wadsley, J., & Stadel, J. 2005, MNRAS, 363, 509
- Mizuno et al. (2001) Mizuno, N., et al. 2001, PASJ, 53, 971
- Murai & Fujimoto (1980) Murai, T., & Fujimoto, M. 1980, PASJ, 32, 581
- Nidever et al. (2007) Nidever, D. L., Majewski, S. R., & Butler Burton, W. 2007, ArXiv e-prints, 706, arXiv:0706.1578 (ApJ submitted)
- Pineda et al. (2008) Pineda, J. L., Ott, J., Klein, U., Wong, T., Muller, E., & Hughes, A. 2008, ApJ, submitted
- Staveley-Smith et al. (2003) Staveley-Smith, L., Kim, S., Calabretta, M. R., Haynes, R. F., & Kesteven, M. J. 2003, MNRAS, 339, 87
- Strong et al. (1988) Strong, A. W., et al. 1988, A&A, 207, 1
- Tumlinson et al. (2002) Tumlinson, J., et al. 2002, ApJ, 566, 857
- van der Marel & Cioni (2001) van der Marel, R. P., & Cioni, M.-R. L. 2001, AJ, 122, 1807
- Walter et al. (2007) Walter, F., et al. 2007, ApJ, 661, 102
- Wong et al. (2006) Wong, T., Whiteoak, J. B., Ott, J., Chin, Y.-n., & Cunningham, M. R. 2006, ApJ, 649, 224
- Yamaguchi et al. (2001) Yamaguchi, R., Mizuno, N., Onishi, T., Mizuno, A., & Fukui, Y. 2001, ApJL, 553, L185