New Anomalies in Cosmic Microwave Background Anisotropy: Violation of the Isotropic Gaussian Hypothesis in Low- Modes
Abstract
In the standard framework of cosmology, primordial density fluctuations are assumed to have an isotropic Gaussian distribution. We search for deviations from this assumption in the WMAP data for the low modes of Cosmic Microwave Background Anisotropies (CMBA), by studying the directions of the z-axis that maximize the modes and the resulting amplitudes of these modes. We find a general alignment of the directions for to 10 modes to within 1/4 of the northern hemisphere. This alignment can be regarded as a generalization of the recently discovered alignment of the and 3 modes - the so-called ‘Axis of Evil’. Furthermore, we find abnormally high (low) powers in the , 12 - 17 () modes; the probabilities for having the anomalous amplitudes of the , 6, 17 modes are about 0.1%, 1% and 1% respectively according to the Gaussian conjecture. The alignment and anomalous amplitudes for these low modes are very robust against foreground contamination or different cleaning strategies, suggesting a cosmological origin and possibly supporting a non-standard inflation.
pacs:
98.80.Es, 95.75.Pq, 98.70.VcModern theories of cosmology are based on three postulates: homogeneity and isotropy of the Universe, and primordial fluctuations of density. These three postulates have been verified to a large extent by the observation of the Cosmic Microwave Background Anisotropies (CMBA) and the large scale structures of the Universe. One usually assumes that the fluctuations are statistically isotropic and Gaussian. Therefore, when one expands the temperature anisotropy ( 2.73K is the mean blackbody temperature today) of the CMBA observed today into spherical harmonics:
| (1) |
the ’s are expected to follow a gaussian distribution among different
samples of the Last Scattering Surface (LSS) as seen from different locations
of the Universe. Unfortunately, we can observe a sample of the LSS at a particular time in a particular position only. There is inevitably a
statistical uncertainty (cosmic variance), no matter how accurate our
observation is.
Recently, some anomalies in the WMAP data for low ’s, which are found to be
inconsistent with the isotropic gaussian hypothesis (IGH) of the primordial
fluctuations, are widely studied (e.g., 1 ; 2 ; 3 ; 4 ; 5 ; 6 ; 7 ). The most famous
anomalies are the low
quadrupole amplitude , where ,
and the alignment of multipoles for and 3, which is known as the
‘Axis of Evil’ (AOE). Although some may argue that we may just be observing
a ‘strange’ universe by accident due to the cosmic variance, many other
suggestions have been offered to explain the anomalies (e.g.,
8 ; 9 ; 10 ; 11 ; 12 ; 13 ; 14 ). Some claim that the foreground contaminations (e.g.,
11 ; 12 ), especially those from the galactic plane or the
Virgo supercluster (towards where the alignment of and 3 multipoles
directs), may give rise to the anomalies. The foreground-cleaning strategies
commonly used cannot provide CMBA maps that are free of foreground
contamination residues. More interestingly, some propose that the anomalies
are true anisotropic signals from the early Universe and suggest possible
mechanisms of producing them (e.g., 13 ; 14 ). It is of obvious importance and interest to distinguish among these three possibilities.
In this paper, we discuss several new anomalies which will make it more
difficult to attribute the
anomalies to coincidence. We also analyze how the galactic plane and other
foreground contaminations affect the anomalies and show that they most likely
do not give rise to the anomalies.
We analyze
| (4) |
Here, measures the maximum contribution of the multipole to
the temperature power spectrum among all possible directions of the
z-axis (). We denote the direction where is found
as . Equation (2) provides not only a measurement of the
multipoles’ alignment, but also an indication of how dominant a multipole is
over other modes of the same . In 6 , is
studied instead of . However, the distribution of values of ’s
can be different for different ’s of the same in general, leading to
different expectation values of . Therefore, is
biased to some particular multipoles () which have larger
expectation values of . We therefore study separately.
We analyze the 3-year full-sky WMAP Internal Linear Combination (WILC3YR) map
released by the WMAP team15 . We also generate 100,000 Monte Carlo
simulations with the IGH so as to study the statistical properties of
’s and ’s. These statistics are then used to determine
if any of those ’s and ’s from the observed CMBA data
are anomalous under the IGH.
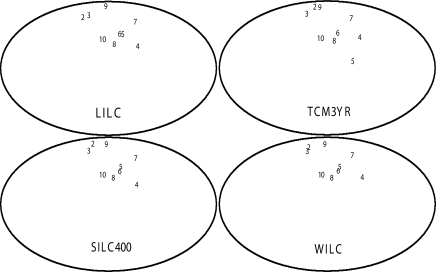
In the lower right graph of the Fig. 1, we locate the directions
for to 10, indicated by the corresponding numbers on a Mollweide
projection of the sky for the WILC3YR map.
The Galactic coordinate system is used and rotated by around the
z-axis for better view. The directions are two-folded, i.e. a
direction of a multipole in the northern hemisphere
must have a corresponding direction in the southern
hemisphere giving the same value of . Here, we show only the
’s of the multipoles in the northern hemisphere of the map.
We find from the sky map that the directions for
to 10 concentrate within 1/5 of the solid angle of the northern
hemisphere. Furthermore, similar to the well-known alignment of the and
multipoles, there is an equally strong alignment of the and
multipoles. The probability to have such a new AOE under the IGH is
only 1%.
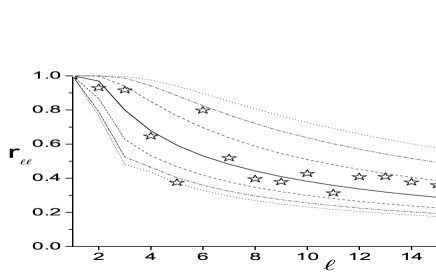
In Fig. 2, the values of ’s from the WILC3YR map are shown against
by the ‘star’ symbols while the lines indicate the median and 99% confidence levels (solid and dash lines) of the 100,000 Monte Carlo data under
the IGH. From Fig. 2, we see that the values of ’s from the WILC3YR
map show a general decreasing trend as increases. This trend is consistent
with the averaged values of the simulated ’s under the IGH. Also, most
’s obtained from the WILC3YR map are consistent with these expected
values within 90% confidence level with a few exceptions. First, we find that
obtained from the WILC3YR map is much smaller than the IGH’s median
of . The probability to have such a small with the IGH
is about 0.1%. Second, another interesting but less significant anomaly is
the unusually large value of . This anomaly can be reproduced by the
IGH with about 1% chance. Third, from to 16, the values of
from observational data are all slightly larger than the IGH’s median rather
than fluctuating around the latter. Finally, for is abnormally
large, with a value that has less than 1% probability under the IGH, and it
also aligns with the directions
for and 6 to within .
We study how robust these anomalies are in several ways:
Different cleaning methods
We apply the same analysis to three other foreground-cleaned WMAP maps:
LILC16 , SILC40017 and TCM3YR18 . Their directions
of multipoles are shown in Fig. 1 together with those
of the WILC3YR map. We can see that almost all the are
consistent for the four CMBA maps. The only exception is the multipole
from TCM3YR which shows a weaker alignment with the multipole.
Nevertheless, the general alignment for to 10 multipoles is still
strong. Even for the worst case (TCM3YR), these directions
concentrate within 1/4 solid angle of the north hemisphere.
The fact that a strong alignment of and 6 multipoles persists
in the other three maps suggests that it is a true anomaly. We also
perform the same analysis on the WILC map with the 5-year data 19 (not
shown). The directions for all ’s from 2 to 10 are
consistent with those of the 3-year data except that for points to a
very different direction.
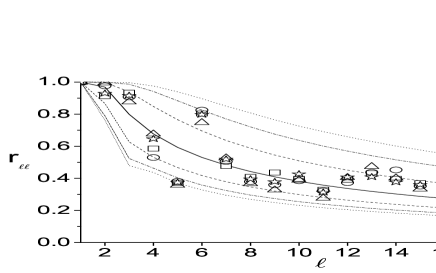
In Fig. 3, we show the values of ’s from all four foreground-cleaned CMBA maps. We can see that the dependence of the ’s on different cleaning schemes are small for most ’s from 2 to 20. This consistency suggests that all anomalies mentioned above are robust features. In particular, the negligible dispersion of keeps the probability of having such a small value of as 0.1%. Although the value of from the TCM3YR map is significantly less than those of the other three maps, it is still well above the 90% probability region under the IGH. Similarly, the anomaly of for is still present for all the four foreground-cleaned maps. Also, the surge of from to 16 over their IGH’s median persists. We remark that the dispersion of is exceptionally large but it is not related to any anomalies.
Effects of the foreground contaminations
In order to examine the effects of the foreground contaminations on the
anomalies, we introduce a simple but aggressive method: a region of the
CMBA map is replaced by a weighted
average of the CMBA and a simulated under the IGH,
i.e. , where
is the observed temperature anisotropy and ranges from 0 to 1.
It is possible that the foreground
contaminations as a deterministic effect changes the statistical properties
of the CMBA signals under the IGH, e.g. shifting the mean values of
and concentrating the directions . Conversely, the persistence
of the anomalies after the replacement assures us that these foreground
contaminations cannot independently produce the anomalies. The method is
aggressive because it erases partially the real signals from LSS (which may
violate the IGH itself) as well as the contaminations. If the anomalies are
eliminated after the substitution, it is difficult, if not impossible, to
distinguish between
the contributions due to loss of real signals and contaminations. Therefore,
the analysis is good at excluding contaminations as a candidate of explaining
the anomalies but not at supporting it. The advantage of using this method
is that it is valid even for dealing with unknown contamination residues.
We apply the method to study the effects of the foreground contaminations on
the galactic plane (plus point sources) and at the Virgo supercluster as
potential sources to produce the anomalies.

For the galactic plane, we use the widely used standard intensity mask - kp2,
which covers 15.3% of the full sky including the galactic plane and point
sources, as the region of the replacement, and is set to be 0.5. The
averaged values of ’s of the
modified maps over 1000 simulations are plotted against in Fig. 4. We can
see that all anomalies of ’s mentioned above are still significant.
The depressed (boosted) value of () remains at about 1%
(10%) probability under the IGH. The surge of values of ’s from
to 16 still exists
obviously, and the value of is still abnormal at about 99%
confidence level. The directions for and 10
under replacements stay near their original directions. Although those
for and 9 may point away to other possible directions, they
gather in different patches respectively instead of spreading all over the
sky. Among these patches, only one for and one for direct outsides
the original region of the concentration or the generalized AOE.
In order to test if the anomalies are caused by the foreground contamination
at the Virgo supercluster, we replace 50% of signals from the Virgo
supercluster by simulated data under the IGH. The results for ’s are
shown in Fig. 5. , , and are still anomalous at
over 99%, 90% and 90% level respectively and the surge for to 16
remains. Furthermore, such a replacement does not affect the general alignment
of the low modes, with only the of
pointing away from the generalized AOE for the TCM3YR map.
We will give more details on how the ’s change under foreground
contaminations in a coming paper.

The general alignment of the directions
’s for to 10 within of the northern
hemisphere is very robust and is unlikely to be eliminated by foreground
contaminations or cleaning strategies.
Furthermore, the anomalies of , , and the surge of
’s for to 16 together are highly inconsistent with the IGH and
robust against foreground cleanings. In fact, the values of ,
and are anomalous under the IGH at about , and
levels respectively, which is extremely ‘strange’ by coincidence.
Our results therefore favor true cosmological origins of the anomalies and
possibly support a non-standard inflation.
Our analysis made use of HEALPIX 20 ; 21 .
This work is supported by grants from the Research Grant Council of the
Hong Kong Special Administrative Region, China (Project Nos. 400707 and
400803).
References
- (1) A. de Oliveira-Costa , Phys. Rev. D 69, 063516 (2004).
- (2) F. K. Hansen , Astrophys. J. 607, L67 (2004).
- (3) P. Vielva , Astrophys. J. 609, 22 (2004).
- (4) H. K. Eriksen , Astrophys. J. 612, 633 (2004).
- (5) D. J. Schwarz , Phys. Rev. Lett. 93, 221301 (2004).
- (6) K. Land , Phys. Rev. Lett. 95, 071301 (2005).
- (7) C. J. Copi , Phys. Rev. D 70, 043515 (2004).
- (8) T. R. Jaffe , Astrophys. J. 629L, 1J (2005).
- (9) L. Campanelli , Phys. Rev. Lett. 97, 131302 (2006).
- (10) N. J. Cornish , Phys. Rev. Lett. 92, 20 (2004).
- (11) K. T. Inoue , Astrophys. J. 648, 23I (2006).
- (12) C. Vale , preprint, [astro-ph/0509039].
- (13) Y. S. Piao , Phys. Rev. D 71, 087301 (2005).
- (14) B. Feng , Phys. Lett. B 570, 145 (2003).
-
(15)
The 3-year WMAP ILC map is available at
http://lambda.gsfc.nasa.gov/product/map/dr2/m_products.cfm. -
(16)
The LILC map is available at
http://www.astro.uio.no/hke/cmbdata/WMAP_ILC_lagrange.fits. -
(17)
The SILC400 map is available at
http://newton.kias.re.kr/parkc/CMB/SILC400.html. -
(18)
The TCM3YR map is available at
http://space.mit.edu/home/tegmark/wmap.html. -
(19)
The 5-year WMAP ILC map is available at
http://lambda.gsfc.nasa.gov/product/map/current/m_products.cfm. - (20) K. M. Gorski , Astrophys. J. 622, 759 (2005).
-
(21)
Healpix is available at
http://healpix.jpl.nasa.gov