Percolative properties of hard oblate ellipsoids of revolution with a soft shell
Abstract
We present an in-depth analysis of the geometrical percolation behavior in the continuum of random assemblies of hard oblate ellipsoids of revolution. Simulations where carried out by considering a broad range of aspect-ratios, from spheres up to aspect-ratio 100 plate-like objects, and with various limiting two particle interaction distances, from 0.05 times the major axis up to 4.0 times the major axis. We confirm the widely reported trend of a consistent lowering of the hard particle critical volume fraction with the increase of the aspect-ratio. Moreover, assimilating the limiting interaction distance to a shell of constant thickness surrounding the ellipsoids, we propose a simple relation based on the total excluded volume of these objects which allows to estimate the critical concentration from a quantity which is quasi-invariant over a large spectrum of limiting interaction distances. Excluded volume and volume quantities are derived explicitly.
pacs:
64.60.ah,72.80.Tm,05.70.FhI Introduction
A central problem in materials science is the precise evaluation of the percolation threshold of random particle dispersions embedded in a continuous medium. This occurs typically in composite materials and is of importance for the prediction of relevant properties such as the electrical conduction in insulator-conducting composites. Practical examples include carbonaceous fillers like carbon fibers, graphite, carbon black, carbon nanotubes and fullerenes, but also metallic and ceramic ones, while matrices can be for instance polymeric, metallic or ceramic. Despite that the most studied particle form is the sphere, see e.g. Heyes2006 ; Lee1998 ; Wang1993 ; Balberg1987 ; Shante1971 ; Scher1970 , a broad range of fillers in real composites have forms which deviate consistently from the sphere. Previous investigations have considered different particle shapes like e.g. sticks Neda1999 ; Bug1986 ; Bug1985 ; Balberg1984a ; Balberg1984b ,wavy sticks Berhan2007b , plates Celzard1996 ; Charlaix1986 ; Charlaix1984 or ellipsoids Yi2004 ; Garboczi1995 ; Sevick1988 ; Skal1974 , but always in the fully penetrable case, where the particles are allowed to freely overlap. Only in few cases were hard sticks with a soft shell considered Schilling2007 ; Berhan2007a ; Ogale1993 ; Balberg1987 , and a recent paper Akagawa2007 contemplated, as in the present study, the case of hard ellipsoids of revolution, but in the prolate domain.
The widespread use of composites containing fibrous fillers has made the stick, or other elongated objects, the favorite non-spherical shape in many studies. Nevertheless, some other fillers, notably graphite, have shapes which are better assimilable to flattened ellipsoids or platelets, and over a broad range of aspect-ratios i.e. longer dimension to shorter dimension ratios. The exploration of the relatively uncharted terrain of the percolative properties of oblate objects as a function of their aspect-ratio is then the aim of the present study.
In this paper we consider the special case of oblate ellipsoids of revolution, usually called (oblate) spheroids, which are ellipsoids with two equal (major) axes and may be obtained by rotation of a 2D ellipse around its minor axis. The reasons for this choice are twofold: first, spheroids are characterized by a smaller number of parameters (7 against 9 of the general ellipsoid); second, experimental measurement techniques of the filler particle size distributions are generally able to extract only major and minor dimensions, making it difficult to quantitatively define a size distribution for the third axis.
Our model is defined by a dispersion of impenetrable spheroids of identical dimensions with isotropic distribution of the symmetry axis orientation. Given any two spheroids, a connectivity criterion is introduced by allowing an upper cutoff distance beyond which the two spheroids are considered disconnected. More precisely, each spheroid is coated with a penetrable shell of constant thickness, and two particles are connected if their shells overlap. In a system of conducting spheroids dispersed in an insulating continuum host, the shell thickness can be physically interpreted as a typical tunneling length between the particles, governing the electrical connectivity of the composite.
To carry out our investigation we exploit a simulation algorithm, described in the following section, that allows to determine the percolation behavior of a random distribution of impenetrable spheroids as a function of their volume fraction, aspect-ratio, shell thickness and simulation cell size.
II The Simulation Algorithm
Even if the ellipsoid is a sufficiently simple geometrical form, much less simple is the construction of an algorithm which involves random distributions of them, since the computation of relevant functions like the particle inter-distance or the overlap criterion is far from trivial, as opposed to the sphere. Now, if we want to build an algorithm to carry out the proposed simulations, we first need a routine that generates a distribution of ellipsoids and that calculates the inter-distance between them. In order to do that we require two functions, an ellipsoid overlap criterion and the distance between two ellipsoids, the first being needed of course only if it can be computed in a time consistently shorter than the second. None of these functions allows simple closed form solutions, but some evaluation techniques are nevertheless available Donev2005 ; Yi2004 ; Garboczi1995 ; Perram1985 ; Vieillard1972 . We have chosen the approach proposed by Rimon and Boyd (R&B) Rimon1997 ; Rimon1992 which was used for an obstacle collision detection procedure for robots, where short computational times are essential. The R&B technique allows two key benefits: 1) A quick estimation procedure of the distance between two ellipsoids that uses standard computation routines and that can be made sufficiently precise. 2) An overlap criterion between two ellipsoids as an intermediate result to the inter-distance computation that can be calculated in about half the time needed for the complete calculation. The computation is based on a formula for the distance of a point from an ellipsoid which reduces the problem to the calculation of the minimal eigenvalue of an auxiliary matrix constructed from the geometrical data.
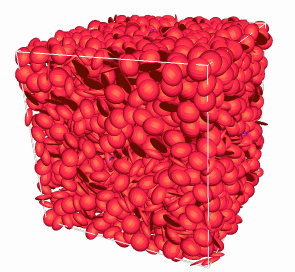
We are now going to briefly outline how the distribution algorithm is constructed. First, a spheroid distribution is created inside a cubic cell of volume by random sequential addition: for every new particle, random placing is attempted and accepted as valid only if there is no overlap with any neighboring particle. To speed up the search for neighbors the main cubic cell is subdivided in discrete binning cells of size comparable to the major dimension of the spheroids. Moreover, to avoid unnecessary computations of the overlap function, cases are discarded which unavoidably lead to overlap or that can anyway not lead to overlap via simple geometrical rejection criteria. Periodic boundary conditions are imposed on the main cell. Second, the inter-particle distance is computed. An interaction inter-distance is chosen so that spheroids separated by a distance greater than it are considered non-interacting. Again, the same neighbor search and rejection criteria are used and, if it is the case, the distance computation is performed. To do this in an efficient way, a first R&B calculation is executed and if the resulting first distance estimate is clearly beyond the interaction range even when considering the worst possible error the calculation is stopped. Otherwise, the computation is continued by performing the R&B calculation with inverted spheroids, comparing with the first calculation and retaining the shorter of the two and finally reiterating part of the R&B procedure to obtain a further correction. This procedure leads to a distance estimate that has an average error of about +1 % on a wide range of distance to major spheroid dimension ratios (from to 10), as obtained by comparing the R&B results with a more accurate but much slower distance evaluation procedure. Figure 1 shows one of such distributions as it appears by loading the algorithm output file in a viewer.
Once the desired distribution has been created and the neighboring particles inter-distances computed, the distribution algorithm output data are fed into the part of a program which isolates the connected cluster using a modified version of the Hoshen-Kopelman algorithm Johner2008 ; Al-Futaisi2003 ; Hoshen1976 . Finally, it is verified if the connected cluster spans two specific opposite sides of the simulation cell.
III Simulation Results
To explore the percolative properties of hard oblate spheroids surrounded with a penetrable shell of constant thickness, we considered spheroids with an aspect-ratio, i.e., spheroid major axis to minor (simmetry) axis ratio between (spheres) and . The shell thickness to spheroid major axis ratio was chosen to variate between and .
To extrapolate the percolation threshold from the simulation algorithm we followed finite-size scaling arguments as described in Ref. Rintoul1997 , and briefly outlined below. For a given size of the cube, we obtained the spanning probability as a function of the spheroids volume fractions by recording the number of times a percolating cluster appeared over a given number of realizations. The resulting spanning probabilities were then plotted against the volume fraction and fitted with the sigmoidal function
| (1) |
where is the percolation threshold for a given value of and corresponds to the hard particle volume fraction at which the spanning probability is equal to , while represents the width of the percolation transition. Both and depend on the size of the system and, by following the scaling arguments of Rintoul1997 , allow to deduct the percolation threshold for the infinite system through the following scaling relations:
| (2) | ||||
| (3) |
where is the correlation length exponent. By repeating the simulation procedure for different cell sizes it is possible, via the percolation transition widths and the inversion of Eq. (2), to extract and consequently, from Eq. (3), the percolation threshold for . We choose to simulate ten different cell sizes, , , , , , , , , and times the major spheroid dimension, i.e., twice the major axis . For thick shells () the cell sizes were increased further. The spheroid number was in the order of thousands for the smallest cells up to about for the largest. The number of realizations per volume fraction step varied from for the smallest shell thickness up to for the thicker ones. Higher realization numbers did not show appreciable improvements. In all cases, the correlation length exponent had a value around 0.9, in good agreement with previous results on spheres Johner2008 ; Lee1998 ; Rintoul1997 . However, sometimes the fluctuations of the where too large and a simple average of the results provided a more significative result that the one obtained from the finite size analysis.
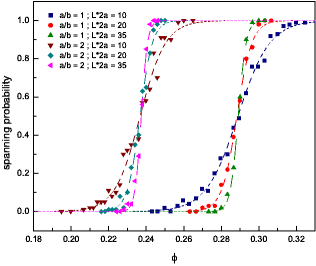
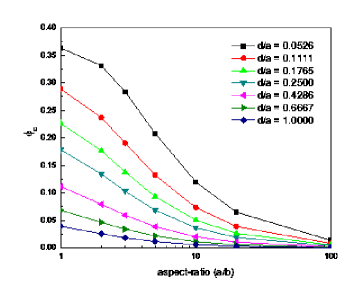
In Fig. 2 we report the obtained spanning probability as a function of for and and for selected values of the cell size . The shell thickness to major axis ratio was set equal to . From the figure it is clear that increasing the aspect-ratio from (spheres) to leads to a lowering of the percolating volume fraction. This trend is confirmed in Fig. 3, where the critical hard particle volume fraction is plotted as a function of and for several values of the penetrable shell thickness. For the thinnest shells we find that can be reduced by about one order of magnitude in going from up to . This result is fully consistent with the frequently reported trend that assemblies of oblate objects with high aspect-ratios entail a lower percolation threshold. For example, several studies of graphite-polymer composites reported a consistent lowering of the electrical conductivity percolation threshold when very high aspect-ratio graphite nanosheets Lu2006 ; Chen2003 ; Celzard1996 or graphene flakes Stankovich2006 were used.
Besides , another quantity characterizing the percolation threshold is the reduced critical density defined as
| (4) |
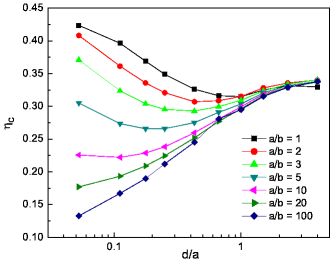
where is the number density at percolation and is the total object volume, comprising the volume of the hard spheroid, , plus that of the penetrable shell. is explicitly calculated in the appendix, see Eq. (33). The behavior of , plotted in Fig. 4 as a function of the penetrable shell thickness and for several aspect-ratios, accounts for the dependence of the percolation threshold on the geometry of the total object (hard-core plus penetrable shell). Indeed, for the reduced critical density is almost independent of the aspect-ratio while, for thinner penetrable shells, acquires a stronger dependence on . This is due to the fact that, for large values, the form of the total object does not deviate much from that of a sphere, so that as for fully penetrable spheres. On the contrary, for smaller values of , the geometry of the total object is more similar to that of an oblate ellipsoid, with a consequently stronger dependence of on the aspect-ratio.
IV Quasi-invariants at the Percolation Threshold
In continuum percolation, an important quantity providing information on the local topology of the percolating cluster is the average number of objects connected to a given particle. For fully penetrable objects, and since in this case there is no spatial correlation, is simply given by Balberg1984a :
| (5) |
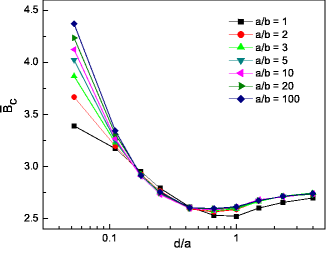
where is the excluded volume defined by the volume around an object where the center of another object cannot penetrate if overlap is to be avoided. For penetrable spheres each of volume , the excluded volume is and, by using with , the resulting connectivity number is , which agrees well with the evaluation of from a direct enumeration of connections in assemblies of penetrable spheres at percolation Balberg1987 ; Heyes2006 . Indeed, for fully penetrable spheres, for which the sphere centers are distributed randomly, Eq. (5) simply states that is equivalent to the average number of centers found within an excluded volume, irrespectively of the spatial configuration of the percolating objects. However, for semi-penetrable spheres, the presence of hard-core introduces a spatial correlation (see below), so that is expected to deviate from the uncorrelated case of Eq. (5). In particular, is found to decrease as the hard-core portion of the sphere increases, reaching for very thin penetrable shells Balberg1987 ; Heyes2006 , as a result of the repulsion of the impenetrable hard-cores.
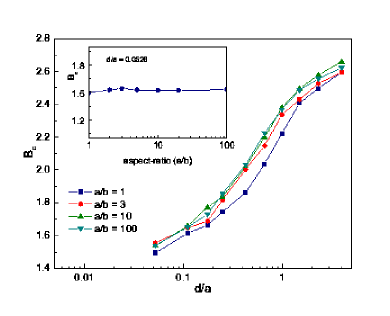
Let us now consider the case of assemblies of oblate ellipsoids. In Fig. 5 we plot the computed values of as a function of the penetrable shell thickness and for selected values of the aspect-ratio . For we recover the results for the spheres: for large values of while for . For and thick penetrable shells, remains close to the spherical case also for larger aspect-ratios because, as said before, for large values the entire object (hard-core plus penetrable shell) is basically a semi-penetrable sphere with a small hard-core spheroid. However, by decreasing , we find that continues to remain very close to the case also for the thinnest penetrable shells, irrespectively of the aspect-ratio. This is well illustrated by the inset of Fig. 5 where the calculated for does not show appreciable variations over a two-order of magnitude change of . This result is rather interesting in view of the fact that a quasi-invariance of with respect to the aspect-ratio in oblate spheroids is in striking contrast to what is found in prolate objects such as the spherocylinders studied in Refs.Balberg1987 ; Schilling2007 . For example, for spherocylinders made of hard cylinders on length and diameter capped by hemispheres and with penetrable shells of thickness , is found to decreases from for down to at Schilling2007 , consistently deviating therefore from obtained for spheres of diameter and the same penetrable shell thickness Heyes2006 . Different behaviors of quasi-impenetrable oblate and prolate objects noted here are also found in the fully penetrable case. Indeed of prolate objects decreases as the aspect-ratio is increased and is expected to approach unity in the extreme prolate limit as a consequence of the vanishing critical density Bug1985 , while of oblate objects remains close to all the way from the moderate- to extreme-oblate regimes Garboczi1995 .
Now, we can write a general relation between the average connection number at percolation and the critical number density . If we consider hard spheroids with penetrable shell and with an isotropic distribution of orientations, then reduces to:
| (6) |
where and are the angles between the major axes of two spheroids separated by and is the radial distribution function: given a particle centered in the origin, represents the mean particle number density at position with an orientation . The integration in is performed over the total excluded volume (hard-core plus penetrable shell) centered at the origin and having orientation .
We observe that all the information about the presence of a hard core inside the particles is included in the radial distribution function, which will be zero in the volume occupied by the hard core of the particle centered at the origin. However, is a rather complex function and even for the case of spheres there are only approximate theoretical expressions Trokhymchuk2005 . Also the construction of a fitted expression to simulation data may result to be excessively complicated when the respective orientation of the particles has to be taken into account.
The lowest order approximation which we may then consider, and which is exact in the case of fully penetrable particles, is the one where . This is equivalent to neglect all contributions of the radial distribution function which spur from the presence of the hard core. The resulting connectivity number, which in this approximation we denote by , is then given by:
| (7) |
where is the orientation averaged total excluded volume. Given the averaged excluded volume of spheroids surrounded with a shell of constant thickness (A), together with the hard spheroid excluded volume expression (A) or (38), we can calculate from the percolation threshold results obtained from the simulations:
| (8) |
where we have used the hard core volume fraction . The full details of the calculation of the excluded volume quantities can be found in the appendix A. The resulting values of are plotted in Fig. 6 as a function of the penetrable shell thickness and for several aspect-ratios. Comparing Fig. 6 with Fig. 5 we note that for , i.e., for thick penetrable shells, does not deviate much from , indicating that the effect of the hard-core is, in this regime, rather weak. On the contrary, for thinner shells, increasingly deviates from because the correlation driven by the hard-core is stronger.
Despite that overestimates the number of connected particles, its behavior is nevertheless rather intriguing. Indeed the dependence of on the penetrable shell thickness appears to be universal with respect to the aspect-ratio, for all values larger than . Furthermore, in this region of , has a rather weak dependence on the shell thickness, not deviating much from . This must be contrasted to which, from down to , decreases from about to only . The quasi-invariance of has therefore some practical advantages since, by using Eq. (8), the percolation threshold can be estimated from and , in a wide interval of and aspect-ratio values.
V Conclusions
The geometrical percolation threshold in the continuum of random distributions of oblate hard ellipsoids of revolution surrounded with a soft shell of constant thickness has been investigated. Simulation results spanning a broad range of aspect-ratios and shell thickness values have been reported. It is found that larger aspect-ratios entail lower percolation thresholds, in agreement with the behavior observed experimentally in insulator-conductor composites where the conducting phase is constituted by oblate objects, such as graphite nanosheets. Furthermore, the number of connected object at percolation is a quasi-invariant with respect to the aspect-ratio, in contrast with what has been previously reported for prolate objects. Finally, we have derived an additional quasi-invariant based on the excluded volume concept which allows to infer the system percolation threshold.
VI Acknowledgments
This study was supported by the Swiss Commission for Technological Innovation (CTI) through project GraPoly, (CTI grant 8597.2), a joint collaboration led by TIMCAL Graphite & Carbon SA. Simulations were performed at the ICIMSI facilities with the help of Eric Jaminet. Data analysis was carried out with the help of Ermanno Oberrauch. Figures 7 and 8 are due to Raffaele Ponti. Comments by I. Balberg were greatly appreciated.
Appendix A Evaluation of Excluded Volume Quantities
We report in the following the derivation of the excluded volume of two oblate spheroids, the excluded volume of two oblate spheroids surrounded with a shell of constant thickness and their angular averages. We follow a route due to the pioneering work of Isihara Isihara1951 which is somehow more laborious than the one used by the same author Isihara1950 and the authors of Ogston1975 to derive the widely used Isihara-Ogston-Winzor spheroid excluded volume formula. The advantage is that it is possible to obtain, albeit in a series expansion form, the excluded quantities with their full angle dependence. The average on the spheroid angle distribution function is performed in a second time and can be easily extended to non-isotropic cases. Let us consider the case of two identical spheroids of major axis and minor axis in contact as illustrated in Fig. 7.
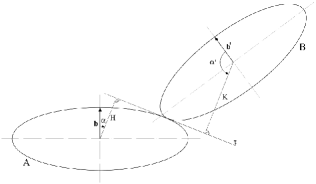
We then have that the geometrical quantities and , which represent the distances from the spheroid centers to the tangent plane to the two spheroids in the contact point, may be written as
| (9) |
| (10) |
where represents the eccentricity (for oblate spheroids)
| (11) |
Furthermore, we have
| (12) |
where and are the angles which define the rotation that transforms the symmetry axis vector of spheroid A in the one of B, .
We can then write the excluded volume of two identical spheroids, or more generally two identical ovaloids, as Isihara1951 ; Isihara1950 :
| (13) |
where is the infinitesimal surface element of the unit sphere centered in the origin which, by using the reference frame choice of fig. 7, takes the form
| (14) |
Furthermore, in Eq. (13) we have introduced the differential operator on the unit sphere which for two equal scalar quantities takes the form
| (15) |
while is the volume of the spheroid.
With the explicit form of , Eq. (9), , Eq. (10), and relation (A) we can write for the excluded volume (13) in the case of the two spheroids the integral form:
| (16) |
where we have used the fact that
| (17) |
because of the periodicity of the integrand and which means that is -independent.
We now may expand the square root:
| (18) |
Substituting this in integral of (A) and integrating in in the first resulting term we obtain:
| (19) |
The integration follows then with the aid of formulas 2.153 (3.), 3.682, 3.681 (1.) of Gradshteyn2000 obtaining with (A) the expression for the excluded volume of two identical oblate spheroids:
| (20) |
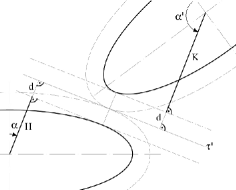
Let us now consider the situation depicted in fig. 8 which represent two (identical) spheroids surrounded with a shell of constant thickness . We are again interested in evaluating the excluded volume of these objects, which, because of the constant shell offset, will not be anymore ellipsoids. Nevertheless, we see that in this case we can again construct geometrical quantities like and of the two spheroids of Fig. 7 and that these, which we will call and are parallel to the old and respectively. Then it follows:
| (21) | ||||
| (22) |
and and will be given by (9) and (10). Now, also in this case expression (13) holds true and, observing that the volume of an ovaloid may be written as Isihara1950 ; Isihara1951
| (23) |
where is a geometric quantity constructed like , we are able to write for the excluded volume of the two spheroids with shell:
| (24) |
and is the excluded volume of the two spheroids (A).
Integrals and are straightforward and may be solved with the aid of formulas 3.682, 2.583 (3.), 2.584 (3.) and 2.584 (39.) of Gradshteyn2000 :
| (25) |
| (26) |
Regarding we have, using Eq. (10), Eq. (A) and Eq. (17):
| (27) |
and we can again expand the square root obtaining
| (28) |
These integrals may be solved again with the use of the formulas 2.153 (3.), 3.682, 3.681 (1.), 2.583 (3.), 2.584 (39.) and 3.621 (5.) of Gradshteyn2000 , yielding
| (29) |
We can then combine all these results together with property Maple
| (30) |
and Eq. (A) to write the excluded volume of two oblate spheroids surrounded with a shell of constant thickness :
| (31) |
We note that the above procedure allowed to obtain an expression for with an angular dependence only upon . However, the orientation of the surface enclosing this volume will be dependent also on , which is why it is needed e.g. in (6).
The above results can also be easily used to compute the total volume of the spheroid with the shell starting from Eq. (23) with Eq. (21):
| (32) |
which is very similar to the first part of Eq. (A) and can be integrated alike, obtaining
| (33) |
We now want to calculate the averaged excluded volume starting from the angle distribution functions which arise in the spheroid distributions of the simulation algorithm. For axially symmetric objects the angle distribution function is dependent only on the angle between the symmetry axes . In the case of an isotropic (or Poissonian) angle distribution, where any orientation is equally probable, it is easy to find
| (34) |
To verify that this situation occurs unbiasedly in the simulations we used a modified version of the spheroid distribution creation algorithm where, after the distribution was realized, for every spheroid it was searched for neighbors which lied within a certain radius from its center and the angles between their symmetry axis were recorded. We then fitted the function to the simulated angle distribution results and, although we may expect that this distribution function will deviate from the purely isotropic case when highly packed assemblies are realized due to local orientation, we obtained no deviation for all binning radiuses and all volume fractions considered in the present research. The averaged excluded volume of the two spheroids will then be
| (35) |
This easily leads with (A) and 3.621 (5.) of Gradshteyn2000 to the averaged excluded volume of two oblate spheroids:
| (36) |
and with Eq. (A) and the same formula of Gradshteyn2000 to the averaged excluded volume of two oblate spheroids surrounded with a shell of constant thickness:
| (37) |
The quantities involved in Eq. (A) and Eq. (A) can then be easily evaluated with a mathematical software like Maple Maple .
The averaged excluded volume of the hard spheroids (A) is of course equivalent to the Isihara-Ogston-Winzor expression Ogston1975 ; Isihara1950 :
| (38) |
These expressions have then been successfully verified through simulation by generating a great number of randomly placed spheroids couples with fixed reciprocal orientation and seeing how many times their shells overlapped. The ratio of overlaps to the total trial number will then be equal to the ratio of the excluded volume to the volume of the simulation cell. Convergence tests on the series were also performed.
It is then interesting to observe that the behavior ratio between and the spheroid volume is roughly linearly dependent upon the spheroid aspect-ratio and deviates slightly from it only close to the sphere case. The same holds true for the averaged excluded volume , showing that interpreting the influence of the spheroid aspect-ratio as an excluded volume effect is a consistent approach.
References
- (1) D. M. Heyes, M. Cass and A. C. Brańca, Molec. Phys. 104, 3137 (2006)
- (2) S. B. Lee and T. J. Yoon, J. Korean Phys. Soc. 33, 612 (1998)
- (3) S. F. Wang and A. A. Ogale, Comp. Sci. Technol. 46, 93 (1993)
- (4) I. Balberg and N. Binenbaum, Phys. Rev. A 35, 5174 (1987)
- (5) V. K. S. Shante and S. Kirkpatrik, Adv. Phys. 20, 325 (1971)
- (6) H. Scher and R. Zallen, J. Chem. Phys. 53, 3759 (1970)
- (7) Z. Néda, R. Florian, Y. Brechet, Phys. Rev. E 59, 3717 (1999)
- (8) A. L. R. Bug, S.A. Safran and I. Webman, Phys. Rev. Lett. 54, 1412 (1985)
- (9) A. L. R. Bug, S. A. Safran and I. Webman, Phys. Rev. B 33, 4716 (1986)
- (10) I. Balberg, N. Binenbaum and N. Wagner, Phys. Rev. Lett. 52, 1465 (1984)
- (11) I. Balberg, C. Anderson, S. Alexander and N. Wagner, Phys. Rev. B 30, 3933 (1984)
- (12) L. Berhan and A. M. Sastry, Phys. Rev. E 75, 041121 (2007)
- (13) A. Celzard, E. McRae, C. Deleuse, M. Dufort, G. Furdin and J. F. Marêché, Phys. Rev. B 53, 6209 (1996)
- (14) E. Charlaix, J. Phys. A: Math. Gen. 19, L533 (1986)
- (15) E. Charlaix, E. Guyon and N. Rivier, Solid State Commun. 50, 999 (1984)
- (16) Y. B. Yi and A. M. Sastry, Proc. R. Soc. Lond. A 460, 2353 (2004)
- (17) E. J. Garboczi, K. A. Snyder, J. F. Douglas and M. F. Thorpe, Phys. Rev. E 52, 819 (1995)
- (18) E. M. Sevick, P. A. Monson and J. M. Ottino, Phys. Rev. A 38, 5376 (1988)
- (19) A. S. Skal, B. I. Shklovskii, Sov. Phys. Semicond. 7, 1058 (1974)
- (20) L. Berhan and A. M. Sastry, Phys. Rev. E 75, 041120 (2007)
- (21) A. A. Ogale and S. F. Wang, Comp. Sci. Technol. 46, 379 (1993)
- (22) T. Schilling, S. Jungblut and M. A. Miller, Phys. Rev. Lett. 98, 108303 (2007)
- (23) S. Akagawa and T. Odagaki, Phys. Rev. E 76, 051402 (2007)
- (24) A. Donev, S. Torquato and F. H. Stillinger, J. Comp. Phys. 202, 765 (2005)
- (25) J. W. Perram and M. S. Wertheim, J. Comp. Phys. 58, 409 (1985)
- (26) J. Vieillard-Baron, J. Chem. Phys. 56, 4729 (1972)
- (27) E. Rimon and S. P. Boyd, J. Intelligent Robotic Syst. 18, 105 (1997)
- (28) E. Rimon and S. P. Boyd, Tech. Rep. ISL, Stanford Univ. (1992)
- (29) N. Johner, C. Grimaldi, I. Balberg and P. Ryser, Accepted for pubblication on Phys. Rev. B
- (30) A. Al-Futaisi and T. W. Patzek, Physica A 321, 665 (2003)
- (31) J. Hoshen and R. Kopelman, Phys. Rev. B 14, 3438 (1976)
- (32) M. D. Rintoul and S. Torquato, J. Phys. A: Math. Gen. 30, L585 (1997)
- (33) W. Lu, J. Weng, D. Wu, C. Wu and G. Chen, Mater. Manuf. Proc. 21, 167 (2006)
- (34) G. Chen, C. Wu, W. Weng, D. Wu and W. Yan, Polymer 44, 1781 (2003)
- (35) S. Stankovich, D. A. Dikin, G. H. B. Dommett, K. M. Kohlhaas, E. J. Zimney, E. A. Stach, R. D. Piner, S. T. Nguyen and R. S. Ruoff, Nature 442, 282 (2006)
- (36) A. Trokhymchuk, I. Nezbeda, J. Jirsák and D. Henderson, J. Chem. Phys. 123, 024501 (2005)
- (37) A. Isihara, J. Chem. Phys. 19, 1142 (1951)
- (38) A. Isihara, J. Chem. Phys. 18, 1446 (1950)
- (39) A. G. Ogston and D. J. Winzor, J. Phys. Chem. 79, 2496 (1975)
- (40) I. S. Gradshteyn and I. M. Ryzhik, Table of integrals, series, and products (Academic Press, 2000)
- (41) Maple software by MapleSoft, a division of Waterloo Maple