Hydrogen tunneling in the perovskite ionic conductor BaCe1-xYxO3-δ
Abstract
We present low-temperature anelastic and dielectric spectroscopy measurements on the perovskite ionic conductor BaCe1-xYxO3-x/2 in the protonated, deuterated and outgassed states. Three main relaxation processes are ascribed to proton migration, reorientation about an Y dopant and tunneling around a same O atom. An additional relaxation maximum appears only in the dielectric spectrum around 60 K, and does not involve H motion, but may be of electronic origin, e.g. small polaron hopping. The peak at the lowest temperature, assigned to H tunneling, has been fitted with a relaxation rate presenting crossovers from one-phonon transitions, nearly independent of temperature, to two-phonon processes, varying as , to Arrhenius-like. Substituting H with D lowers the overall rate by 8 times. The corresponding peak in the dielectric loss has an intensity nearly 40 times smaller than expected from the classical reorientation of the electric dipole associated with the OH complex. This fact is discussed in terms of coherent tunneling states of H in a cubic and orthorhombically distorted lattice, possibly indicating that only H in the symmetric regions of twin boundaries exhibit tunneling, and in terms of reduction of the effective dipole due to lattice polarization.
pacs:
66.35.+a,77.22.Gm,62.40.+iI Introduction
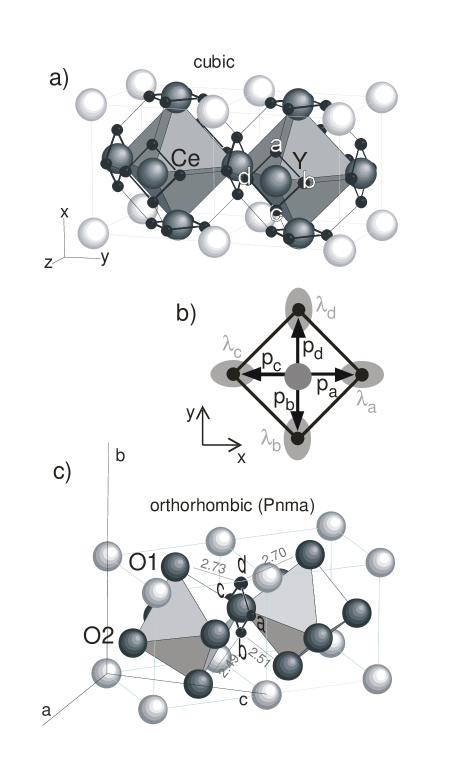
Perovskite cerates and zirconates are a class of materials that, with appropriate doping, exhibit ionic conductivity both of O vacancies and protons, and therefore are suitable as solid electrolytes for fuel cells, gas sensors and other electrochemical devices. Dissolution of H is achieved in two steps:Kre97 the material is doped with lower valence cations, e.g. BaCe1-xYxO3-x/2 (BCY) where the partial substitution of Ce4+ with Y3+ introduces charge compensating O vacancies; the material is then exposed to a humid atmosphere at high temperature, so that the H2O molecules may dissociate, each of them filling an O vacancy and contributing with two H atoms. Infrared spectroscopyGPB02 and diffractionKni00 experiments indicate that H is bound to an O, forming an OH- ion, but also makes some hydrogen-bonding with a next-nearest O atom. The proton diffusion is believed to consist of a rapid rotation about the O atom to which is associated, and slower jumps to one of the eight next-nearest neighbor O atoms with which an instantaneous hydrogen bond is established (see Fig. 7a below). It has also been proposed, however, that in some distorted zirconates and titanates the rotational barrier may be higher than the transfer barrier.GGJ05 In various cubic perovskites ABO3 there are four equilibrium orientations of the OH- complex, with an OH separation of Å and H pointing in the directions perpendicular to the B-O-B bond;MSK96 ; INI07 in the presence of dopants or non cubic distortions such positions would be shifted.Kni00 It is very likely that the fast local motion of H about the same O is dominated by tunneling, but so far no quantitative measurements of the associated correlation times have appeared, except for quasi-elastic neutron scattering experiments on hydrated Ba(Ca0.39Nb0.61)O2.91, where a fast local motion has been detected above room temperature with an apparent activation energy of eV.PMS97 Also in SrCe0.95Yb0.05O2.97 a broad quasielastic component has been attributed to fast proton rotation,MSK96b but no reliable measurement of the associated rate was possible.
There is some controversy on the effect of dopants on the proton mobility, as reviewed in Ref. BSW07, : on the one hand there are several indications for trapping,HKM95 ; HSH98 ; GLD07 ; BSW07 with formation of stable dopant-H complexes, but it has also been proposed that the excess doped charge distributes over all O sites, causing an increase of the hopping barrier for the proton over the whole lattice.MUM04
Anelastic and dielectric spectroscopies may contribute to answer to such issues, since both an electric and elastic dipole are associated with a OH- ion or Y-OH- complex, and each type of jump or reorientation with characteristic time causes a maximum of the losses at the temperature and frequency such that . Anelastic relaxation is particularly useful, since it is almost insensitive to electronic conduction and is not affected by charged interface layers. We present anelastic and dielectric spectroscopy measurements on protonated, deuterated and outgassed BaCe1-xYxO3-x/2, where different relaxation processes are ascribed to H migration, reorientation about an Y dopant and tunneling about a same O atom; the focus will be on the last type of motion.
II Experimental
The starting powders of BCY were prepared by auto-combustion synthesis, which is an easy and convenient solution-based method for the preparation of nanometric mixed-oxide powders. The methodDMD08 is an improvement of that for metal citrates described in the literature.XHC04 Stoichiometric amounts of highly purified metal nitrates were dissolved in distilled water and mixed with citric acid which acted both as metal ions complexant and as fuel. The citric acid to metal nitrates ratio was maintained to 2, ammonium nitrate was added to regulate the fuel to oxidant ratio (citric acid/total nitrate ions ratio) to 0.4 and ammonia solution (30%wt) was added to regulate the pH value at 6. The water solution was left to evaporate at 80 oC under constant stirring in a beaker immersed in a heated oil bath, until a whitish and sticky gel was obtained. The temperature was then raised to 200 oC until the gel became completely black and dry. The beaker was then put directly on the hot-plate at oC until the auto-combustion reaction occurred leaving the powdered product. Crystallization was completed by firing the combusted powders in stagnant air at 1000 oC for 5 h. No weight loss occurred during the synthesis and no oxide segregation has been detected by X-ray diffraction, so that we assume the nominal compositions of BaCe1-xYxO3-x/2 with (BCY10) and (BCY15). The nanopowders were first uniaxially pressed at 50 MPa and then isostatically pressed at 200 MPa obtaining mm bars, which were sintered at 1500 oC for 10 h. The bars where cut as thin reeds about 4 cm long and 1 mm thick, whose major faces where covered with Ag paint.
The maximum molar concentration of H and D was measured from the change of weight when the sample state was changed between fully outgassed (up to 730 oC in vacuum mbar) and hydrated for 1-2 h at 520 oC in a static atmosphere of mbar H2O or D2O followed by slow cooling; it was found for and for , slightly less than the theoretical maximum .
The elastic compliance was measured by electrostatically exciting the flexural modes of the bars suspended in vacuum on thin thermocouple wires in correspondence with the nodal lines; the 1st, 3rd and 5th modes could be measured, whose frequencies are in the ratios , the fundamental frequencies of samples being kHz. The elastic energy loss coefficient, or the reciprocal of the mechanical quality factor,NB72 was measured from the decay of the free oscillations or from the width of the resonance peak. The elastic compliance is the mechanical analogue of the dielectric susceptibility , with corresponding to .
The dielectric permittivity was measured with a HP 4284A impedance bridge with a four wire probe between 3 and 100 kHz in the same cryostat used for the anelastic measurements. After depositing the Ag electrodes, an intense dielectric relaxation process, identified with the motion of charge carriers within a Schottky barrier at the electrode interface, completely masks the true bulk relaxation. Such an effect was suppressed by applying 40 V up to K, switching the direction of the dc current in order to avoid electromigration of O vacancies or protons.Cra08
A defect hopping or reorienting with characteristic time and causing a change of its elastic quadrupole and of its electric dipole contributes with a Debye peak to the imaginary parts of the elastic compliance and dielectric permittivity as:NH65
| (1) |
| (2) |
where is the molar concentration of relaxing defects, the molecular volume, and is the energy difference between the states participating to relaxation. When , the higher energy state becomes less populated and therefore there is a reduced change of the defect populations under application of the probe field with respect to the case ; the consequent reduction of the relaxation strength is described by the factor sech.33
III Results
III.1 Anelastic spectra
Figure 1 presents the anelastic spectra of BaCe0.9Y0.1O3-δ measured at the fundamental frequency of 2.8 kHz: 1) in the as prepared state, therefore nearly saturated with H2O; 2) after outgassing H2O at 900 oC in a flux of pure O2 for 2.5 h; 3) after keeping in a static atmosphere of mbar D2O at 520 oC followed by cooling at 1 oC/min; 4) after having measured in vacuum up to 500 oC with partial loss of D2O.
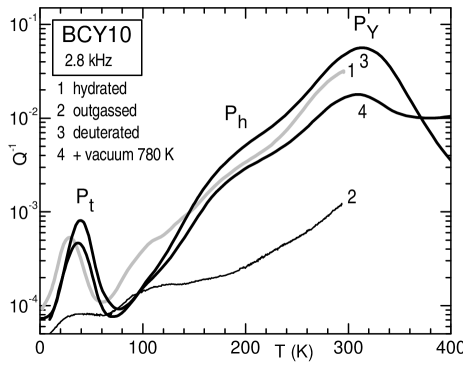
There are at least three relaxation processes clearly due to the presence of H or D: the peak labeled PY at K, Ph at K and Pt at K; above 400 K start the contributions due to O vacancies. All these peaks shift to higher temperature when measured at higher frequency, and a preliminary analysis yields activation energies of 0.58 eV with s for PY and eV for Ph; the latter is likely composed of different processes. These peaks are quite broader than pure Debye relaxations and the possible difference in relaxation parameters between H and D is not apparent without an accurate analysis; they must be due to hopping of H between different O atoms. Peak Pt is the focus of the present work and shifts from 29 to 38 K when H is replaced with D, clearly indicating that it is due to the fast motion of H about a same O atom with a dynamics dominated by tunneling. An additional peak at K might also be due to H and possibly shifts to higher temperature after substitution of H with D, but its nature is not as clear as for the other processes and we will not discuss it further.
III.2 Comparison between anelastic and dielectric spectra
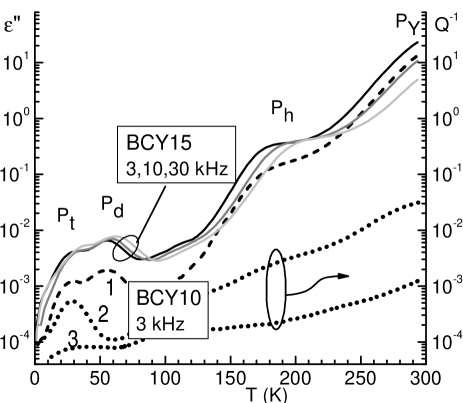
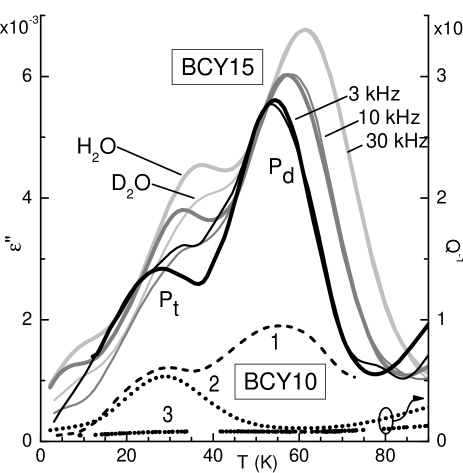
All the peaks appearing in the anelastic spectrum are present also in the dielectric one, which also displays an additional maximum Pd at K. Figure 2 shows of hydrated BCY15 and BCY10 (, curve 1); the latter is compared with the elastic counterpart in the hydrated (curve 2) and outgassed (curve 3) states, measured at the same frequency of 3 kHz. It appears that the intensities of peaks Pt, Ph and PY span more than four orders of magnitude in but only two in , meaning that the fast tunneling motion of H produces a much smaller change in the electric dipole than in the elastic dipole, compared to the hopping motion. On the other hand, the peak temperatures and activation energies appear to be practically the same in the dielectric and anelastic losses. These dielectric measurements on BCY15 have been made after full elimination of the charge relaxation at the electrodes, so that the intensities of PY and Ph are reliable. Figure 3 shows of both hydrated (thick lines) and deuterated (thin lines) BCY15. While peak Pt shifts to higher temperature after the isotope substitution of H with D as for the anelastic case, peak Pd remains completely unaffected; this fact, together with its absence in the anelastic losses, indicate that Pd is not connected with the H motion, but is likely of electronic origin. Curves in Fig. 3 are the same dielectric and anelastic curves of BCY10 appearing in Fig. 2, but this time the two scales are chosen in order to yield the same intensity of Pt. Unfortunately, experimental difficulties connected with the elimination of the metal-semiconductor barrier at the electrodes did not allow us to obtain significant dielectric spectra in the outgassed state, so that it is possible to determine that the intensity of Pd almost triplicates in the hydrated state passing from 10% to 15%Y doping, but nothing can be said on its dependence on the content of H or O vacancies.
IV Discussion
IV.1 Proton hopping and trapping
In what follows we will identify peak PY with hopping of H among the O atoms of YO6 octahedra, namely with the reorientation of the Y-H complex, and Ph with hopping over CeO6 octahedra, with the possible contribution of the formation/dissociation of Y-H complexes. These assignments are suggested by the fact that it is natural to assume that (OH)+ ions, having a formal charge +1 with respect to O2-, may form relatively stable complexes with trivalent dopants Y3+, having formal charge -1 with respect to Ce4+. Then, PY with higher intensity and activation energy should be due to the more numerous H atoms associated with Y, while Ph should be due to the faster jumps of the less numerous H atoms not associated with Y. The assignment of anelastic relaxation peaks to dopant-H complexes has already been proposed for BaCe1-xNdxO3-δDu94 and (Ba,Sr)Ce1-xYbxO3,ZBS95 although the argument that the (OH)- ion has the same symmetry as the crystal and therefore cannot produce anelastic relaxation unless forming defect complexesDu94 is incorrect. Additional experimental indications that H is trapped by trivalent dopants in BaCe1-xYxO3 are the analysis in terms of two components of the quasielastic neutron scattering peak,HKM95 and the observation with EXAFS of an enhancement of the disorder in the environment of Y after hydration.GLD07 Also first-principle calculations and Monte-Carlo simulations of the proton diffusion indicate that dopants act as traps.BSW05 ; BSW07
On the other hand, there are also experiments suggesting the absence of significant trapping, like an NMR investigationMUM04 on BaCe1-xYxO3 with and 0.1, where the correlation time deduced from the 1H NMR relaxation is the same at both doping levels and reproduces the conductivity with a simple hopping model without trapping. At this stage, it cannot be completely excluded from our data that there is indeed very little trapping effect from Y dopants, and the two main anelastic relaxation processes P and P are associated with H hopping among O1 and O2 atoms of the orthorhombic structure, having different symmetries. It is possible that H binds to O1 and to O2 with different probabilities, as neutron diffraction experiments and molecular dynamics simulations suggest,MKA99 ; Kni00 and jumps within the respective sublattices with different rates, so giving rise to peaks with distinct intensities and temperatures. In the discussion we will also mention the possibility that in the distorted orthorhombic structure the reorientation of the OH ions is much slower than found in the higher temperature phases, and P is due to such slow reorientation.
IV.2 Fit of the anelastic Pt
The relaxation modes of the fast reorientation of OH among four positions can be found by solving the rate equations for classical hopping between the four H sites or the quantum mechanical problem with tunneling between nearest neighbor orientations. In the classical symmetric case there are two modes: one active in the dielectric relaxation and another in the anelastic relaxation with a rate twice larger; in the case that the site energies are different, however, the modes become three, all contributing to both anelastic and dielectric relaxation, and with possibly widely changing rates, depending on the type of asymmetry and the degree of coherence of the eigenstates of H plus polaron-like distortion of the surrounding atoms. At variance with the geometrically analogous case of the reorientation of Zr-H complexes in Nb,36 ; 45 ; 85 ; CCC98 in highly doped and orthorhombic BCY it is not possible to distinguish different peaks arising from these modes, and therefore we will limit ourselves to fit Pt with a single relaxation time plus broadening, as
| (3) |
where the parameters produce broadening of the low- and high-temperature sides of the peak, respectively; when the above expression reduces to a Debye peak. The parameter is the energy difference between the configurations involved in relaxation, and must be introduced in order to reproduce the enhancement of the peak height at higher frequency.33 The relaxation rate was modeled as
| (5) | |||||
Such an expression is similar to that used by Kuskowsky, Lim and Nowick,KLN99 for the low temperature dielectric relaxation in Ba1-xNdxCeO3-x/2; it does not rely on a model of the interaction between a precise defect geometry and the actual phonon bath, but is able to describe the main hopping regimes, including tunneling in an insulating crystal. One expects that, starting from low temperature, the transitions between the defect eigenstates occur through processes involving one-phonon, then two-phonons and finally several phonons or semiclassical hopping.CCC98 In the one-phonon regime the transition rate is , which becomes temperature independent when is smaller than the separation between the eigenstates; the latter has a form of the type where the tunneling matrix element is expected to be smaller than the typical energy asymmetry between the site energies due to the orthorhombic distortion and disordered nature of the BCY solid solution; in the fit . The two-phonon relaxation rate approximately depends on temperature through a power law,FS70 ; Kli83 ; SBH94 with depending on the type of interaction with acoustic phonons and on the energy difference between H sites. For interaction with optical phonons of frequency an Arrhenius-like dependence is predicted.Kli83 At sufficiently high temperatures an Arrhenius-like temperature dependence is always found, although the pre-exponential term is not necessarily related to the frequency of a local H vibration mode, but depends also on the overlap of the wave functions of H in adjacent sites, and the barrier may contain significant corrections due to phonon fluctuations with respect to the static potential.
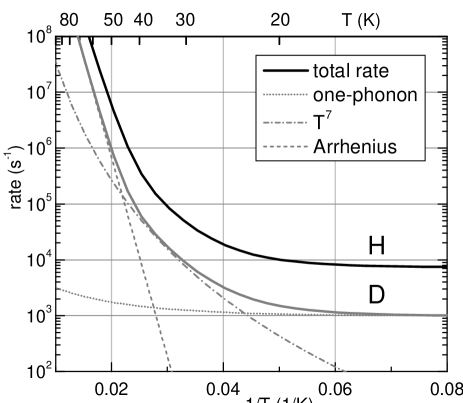
We found that all the three contributions to are necessary to obtain a good fit: the one-phonon term reproduces the low temperature broadening of Pt without resorting to extremely small values of . The introduction of the power low significantly improves the fit quality around the maximum. The Arrhenius contribution is not essential to obtain good fits, since its suppression can be partially compensated by an increase of , namely by diminishing the broadening at high temperature; however, if one wants to keep the Arrhenius contribution must be included. The condition appears desirable, if such parameters should describe the broadening of a Debye peak due to lattice disorder, and not to other types of interactions, like collective interactions among H atoms.
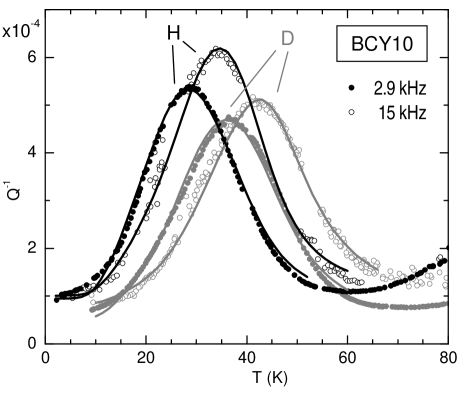
The continuous lines in Fig. 4 are fits of anelastic Pt of BCY10 both hydrated and deuterated with the above expressions plus a linear background. In view of the partial duplication of the effects of some parameters, like the high temperature broadening and the Arrhenius and , these fits are not unique, and we tried to obtain a physically sound combination of the parameters. The mean asymmetry energy is determined quite precisely as K from the temperature dependence of the peak intensities. Regarding broadening, it is possible to obtain good fits with for both H and D, although for H gives a slightly better interpolation, as in Fig. 4; these values of and imply a broadening that is conspicuous but expected, in view of the high lattice disorder. The other parameters are: s (), K (820), K (8.4), , 7300 s-1 (990) for H (D). The resulting are plotted in Fig. 5 and it turns out that at all temperatures; such a ratio certainly indicates a non-classical effect of the isotope mass on the H dynamics. The barrier K of the Arrhenius-like contribution is close to the activation energy for rotational diffusion obtained from quantum molecular dynamics simulations,MKA99 ; note and to that extracted from quasi-elastic neutron scattering in Ba(Ca0.39Nb0.61)O2.91.PMS97 It cannot be excluded, however, that it rather originates from two-phonon interaction with optical phonons,Kli83 considering that the infrared absorption bands in various cerates range from 600 K to 1000 K (400 to 700 cm-1).MOK06 The power law with instead is typical of two-phonon transitions of asymmetric states interacting with acoustic phonons; lower values of yield definitely worse fits, while is found if the Arrhenius contribution is omitted.
IV.3 Fit of dielectric Pt and Pd
The most reliable fit is on BCY10, where peak Pd has a reduced intensity. Below 100 K, has already approached the limiting high frequency value , so that the and in Fig. 6 we show at 10, 30 and 100 kHz; at lower frequency the noise was too large to add significant information. Note that, due the imperfect compensation of the cables impedance at low temperature, and the very small values of the dielectric losses, the curves can be arbitrarily shifted in the ordinate scale. In fact, it was verified by switching on and off the cable compensation that below 150 K such a correction became independent of temperature and therefore introduced only a shift of the curves.
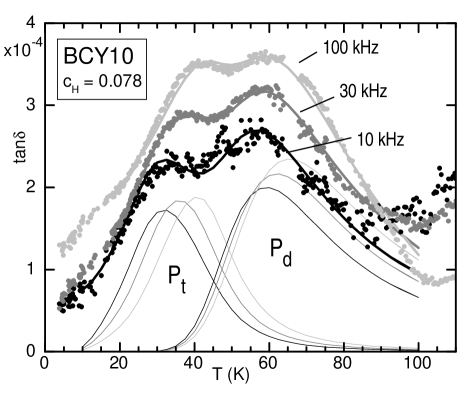
The shapes and temperatures of dielectric and anelastic Pt need not to be identical, since the various relaxation modes contributing to them may have different strengths for anelastic and dielectric relaxation. Yet, we chose not to let all the parameters of Pt to vary freely, due to the still overwhelming presence of Pd at higher temperature and possibly to the presence of another relaxation at lower temperature. Therefore, all the parameters of Pt where set to the values of the anelastic fit of Fig. 4, with a factor multiplying the anelastic as the only degree of freedom: ; it turns out that yields a good fit. Peak Pd, appearing only in the dielectric spectrum, has an intensity that clearly rises with temperature (see Fig. 3) and there are two main possible causes for such a behavior: i) Pd is due to the relaxation of a thermally excited state with energy over the ground state, e.g. charges from a ionized defect, and therefore the relaxation strength contains the population of the ionized state as a factor, ; ii) relaxation occurs between two states differing in energy by , so that . It is also possible that both mechanisms are present, but the data do not allow to distinguish between these possibilities, and we will consider the case , ; note that the two mechanisms give similar temperature dependence of in a broad temperature range if . The shape of Pd could be better reproduced with the Cole-Cole expression for broadening, so that the expression for fitting Pd was
and . The thick curves in Fig. 6 are the resulting fit with linear backgrounds, and also Pt and Pd are shown. The parameters of Pd are: 150 K (150), s (), 1270 K (1270) and 0.26 (0.38), where the values in parenthesis are obtained from the measurements on BCY15 (data of Fig. 3). The small values of are in agreement with the electronic origin of the relaxation, but, considering the extreme peak broadening (small ), it cannot be excluded that a correlated dynamics is present, which may be better described by a Vogel-Fulcher type rather than Arrhenius.
IV.4 The intensity of Pt
IV.4.1 The electric dipole of the OH group
The dependence of the intensity of the anelastic Pt on the H content and the marked shift to higher temperature with the heavier D isotope mass leave little doubt that anelastic Pt is due to the fast motion of H around a same O with a dynamics dominated by tunneling. It is also clear that Pt has its dielectric counterpart (Fig. 3, curves 1 and 2). A puzzling feature of the dielectric Pt is its very small intensity, and therefore we discuss now about the estimated strengths of dielectric and anelastic relaxation. The dielectric relaxation strength associated with various types of H jumps should be relatively easy to estimate in a medium which is not particularly highly polarizable like BCY. Let us first consider PY, interpreted as the reorientation of an effective dipole YOH∙ where the Kröger-Vink notation expresses the fact that Y3+ has an excess charge with respect to Ce4+ of the perfect lattice and OH- has a charge with respect to O2-. On the time scale of the H reorientation among different faces of the cube containing Y, the fast motion around each O is completely averaged out with barycenter near O, so giving rise to an effective dipole , where is the lattice constant of the cubic perovskite (Fig. 7a). A jump to a different cube face will cause a change of the dielectric dipole by ; settingKni00 Å, Eq. (2) gives a dielectric relaxation strength at 300 K; therefore the intensity of PY at (Fig. 2) is obtained setting , namely that at this temperature of H is trapped by Y. It is likely, however, that is closer to but the effective dipole is reduced by the surrounding polarization and distortion. The dipole involved in Pt instead, is associated with the OH ion in its four equilibrium positions (Fig. 7b):
| (6) | |||||
where Å is the O-H separation. The actual charge on O and H is likely reduced by polarization effects, and it has been calculated by atomistic simulationsGIN99 as and , so giving . A reorientation of the OH ion by 90o causes and, setting K from the fit, the resulting relaxation strength of peak Pt at K should be . It results that Pt at 35 K should be times smaller than PY at 300 K, but instead it is nearly 1000 times smaller, therefore nearly times smaller than expected.
IV.4.2 The elastic quadrupole of the OH group
The anelastic case is different, since the elastic quadrupole corresponds to the long range component of the strain associated with the OH ion and cannot be estimated in an obvious manner as the electric dipole. It can only be said that the OH ion in the cubic configuration of Fig. 7 has orthorhombic symmetry and therefore in a cube face it is
| (7) |
and have the and components exchanged. The reorientation of OH by 90o causes a change . On the longer time scale of relaxation PY, the four positions of the face produce a tetragonal quadrupole
| (8) |
plus, in case of Y-OH complex, a possible additional distortion
| (9) |
Then, the anelastic peak PY associated with the reorientation of the tetragonal defect complex Y-OH, has . Lacking any method for estimating these components of the elastic quadrupoles associated with OH and Y-OH complexes, we cannot exclude that is times smaller than , so determining a reduction of the intensity of Pt by two orders of magnitude with respect to PY. Then, the small intensity of the anelastic Pt does not necessarily constitute a problem as the dielectric intensity does.
IV.4.3 Anelastic and dielectric relaxation strengths of tunneling states in a cubic environment
The explanation why the intensity of the dielectric Pt is so much smaller than expected from a simple estimate of the magnitude of dipole change would be easy if BCY was cubic or very close to cubic. In fact, in case of coherent tunneling among four nearly equivalent positions, the effective dipole strength for transitions between H eigenstates would be much smaller than for hopping among the same positions, at variance with the anelastic case. The Hamiltonian of the symmetric four-level tunnel system (FLS) of H may be written in the basis where H is localized in each site as:
| (10) |
where is the effective tunneling matrix element between adjacent sites dressed with the interaction with phonons and the site energies are all set to 0. The eigenstates of are
| (11) |
two states are delocalized over all sites, with energies , and two are delocalized over either pair of opposite sites, with energies . The associated electric dipoles and elastic quadrupoles may be obtained taking the matrix elements and , with and given above. It is evident that averaged over any of the above states is null, since opposite sites are equally occupied and cancel out the respective dipoles. Then, no dielectric relaxation is expected from H tunneling in a cubic environment, or also next to a Y dopant, which leaves the fourfold symmetry of the FLS. The elastic quadrupoles, instead, being centrosymmetric as in Eq. (7), are equal within pairs of opposite sites, and transitions between the two intermediate eigenstates cause a change of elastic quadrupole by ; transitions between states 2,3 and 1,4 cause a change by and those between 1 and 4 no anelastic relaxation. Therefore, the formation of FLS with weak deviations from fourfold symmetry would explain why the dielectric relaxation from H tunneling is much more effectively suppressed than the anelastic one, with respect to classical reorientation.
A picture like this, with H and D performing coherent tunneling within nearly symmetric FLS, has been thoroughly studied by anelastic relaxation in Nb with substitutional traps.36 ; 45 ; 85 ; CCC98 Also in that case H tunnels within rings of four equivalent tetrahedral sites on the faces of the bcc cells with a dopant in the center, and performs overbarrier jumps to the neighboring rings, which form a network exactly as in the cubic perovskite (see Fig. 7a). In Nb1-xZrx single crystals with it was also possible to distinguish well separated relaxation processes arising from transitions involving eigenstates with different symmetries, only moderately perturbed by interactions among dopants;85 in addition, the dependence of the anelastic relaxation due to the slower reorientation among different cube faces on the symmetry of the excitation stress45 provides evidence that the symmetry of the FLS persists at least up to 150 K, implying that the H eigenstates maintain coherence up to that temperature. It should be noted that the measured effective tunneling matrix element between tetrahedral sites in Nb is meV for H and 0.02 meV for D, corresponding to and 0.2 K or and s-1 respectively; it appears therefore that coherence is maintained both at temperatures orders of magnitude larger than and with tunneling frequencies of the order of phonon frequencies.
A theoretical basis for the persistence of quantum coherence at such high temperatures comes from analytical and numerical analysis of the centrosymmetric FLS, where coherent oscillations of the H populations are found even for strong interaction with the thermal bath,WG00 and from the analysis of the dynamics of polarons using the dynamical mean-field approximation,FC03 which is a non-perturbative approach. It is shown that the coherence of the state including tunneling particle and surrounding polaronic distortion is maintained to temperatures up to a substantial fraction of the energy of the phonon coupled with the particle, , also in the case of strong coupling, where the energy for the polaron formation is . We assume eV from the theoretical estimateSBW07 of the self-trapping energy of H in BaZrO3, and that the strongest coupling is with the O-Ce-O bending mode (in BaCeO3 41 meVCPL99 ) modulating the distance with the neighboring O atoms and therefore the hydrogen bonds with them. Then we are in the limit of strong coupling, and the dynamical mean-field analysisFC03 ensures us that coherent states may be maintained up to 100 K; this holds for both H and D, since the smallness of the dressed tunneling matrix element should not be a problem, until the tunneling frequency is larger than the measuring frequency.
IV.4.4 Tunneling states in the orthorhombic lattice
The main problem with the above explanation of the smallness of the dielectric relaxation strength of Pt is that BCY at low temperature is not cubic but orthorhombic, and the FLS should be far from symmetric. Figure 7c shows an undistorted ring, as in the cubic case, between two octahedra tilted as in the orthorhombic low temperature structure of BaCe0.9Y0.1O3-δ.Kni00 The O atoms split in two types: O1 at the vertices of the octahedra along the axis and O2 near the plane; neutron diffraction indicates that, at 4.2 K, H in BCY occupies a site near the one labeled as in Fig. 7c, which is also the one with the largest distances from the next nearest neighbor O atoms. It is therefore reasonable to assume that in the distorted orthorhombic structure H occupies sites slightly displaced from those in the cubic cell, and that the site energy is mainly determined by the mean distance from the two next nearest neighbor O atoms, with which some hydrogen bonding can take place.BSW07 For the sites labeled in Fig. 7b it is 2.66, 2.71, 2.53, 2.50 respectively, so that the site energies may be written as , , and the Hamiltonian of the tunnel system becomes:
| (12) |
with eigenstates
| (13) |
and energies where . This means that, when , there are two low energy eigenstates with H mainly delocalized over sites and and two higher energy eigenstates delocalized over sites and ; these states have an electric dipole oriented roughly midway between the two occupied sites. Therefore, while in the limit , valid for the cubic ideal case, the H atom is delocalized over all sites and the electric dipole is averaged out to almost zero, H in BCY at low temperature is expected to be in the opposite limit where the averaging effect of the electric dipole occurs only within the pairs and of low- and high-energy states, without a suppression of the dipole magnitude.
The present data do not allow an estimate of , neither do we know of estimates of the energy asymmetry due to the orthorhombic distortion, but based on the comparison with the better known case of Zr-H complexes in Nb we should be in the limit . In fact, should be smaller than in Nb, since, assuming an O-H bond Å long, the distance between neighboring sites is Å in BCY while it is only Å in Nb; in addition, the maximum of the anelastic relaxation is shifted to higher temperature with respect to Nb1-xZrxHy, indicating slower transition rates; therefore it should be K, the value found in Nb. On the other hand, we expect K, considering that the random strains due to at% of impurities in Nb cause of tens of kelvin,CCC98 and the strain associated with the octahedral tilts in orthorhombic BCY is certainly larger. Another indication that due to the orthorhombic distortion is large comes from the theoretical estimateSBW07 eV of the self-trapping energy of H in BaZrO3.
IV.4.5 Symmetric tunneling states within twin walls
After these arguments, it is puzzling that the intensity of the dielectric Pd in orthorhombic BCY is so small. The situation is similar to that found in hydrated BaCe1-xNdxO3-δ, where a low temperature dielectric relaxation exists whose rate has a temperature dependence indicating tunneling; however, it was concluded that if all the protons were responsible for such a relaxation, the intensity should be 50 times larger, and therefore only special defect configurations contributed to that relaxation.KLN99 In the present case, unless the OH dipole is smaller than estimated,GIN99 less than 3% of the H atoms should contribute to Pt and it should be explained what kind of particular configuration exhibits tunneling and what is the dynamics of the majority H atoms. In fact, both neutron spectroscopy at high temperatureMSK96b ; PMS97 and simulationsBSW07 indicate that the reorientation of the OH ion is much faster than the hopping between different O atoms in perovskite cerates. A possible scenario is that the fast reorientation occurs only in high temperature phases that are cubic or less distorted than the orthorhombic phase, whereas in the latter H is nearly localized at lowest energy site, close to site in Fig. 7b. Then the reorientation of the OH ion would be slower than that producing Pt and might be identified with Ph or some broad peak masked by the tail of PY and by Ph, perhaps the one around 100 K in Fig. 1. In this scenario the tunneling motion would appear only in particularly symmetric environments, e.g. at the boundaries between different structural domains. We are not aware of any study of the density, width and morphology of the domain boundaries in BCY, but indirect support to this mechanism comes from a simulation on orthorhombic CaTiO3, where the twin walls are found to be about 6 pseudocubic cells wide and to trap the O vacancies;CDS03 it is also proposed that the diffusion of O vacancies should be faster within the twin planes, which are more symmetric than the orthorhombic bulk. Also in the case of H in BCY, the reorientation rate of H might be faster at the twin walls, but the relevance of this effect to the long range mobility would be limited, since the rate limiting step is not the OH reorientation but the hopping to a different O atom. We think however that the effect of the greater symmetry at the twin walls should be studied also in relation with the hopping mechanism and in the high temperature phases of BCY. Also simulations on BaZrO3 and CaTiO3 suggest that the octahedral tilting is essential in determining H site energies and diffusion paths.GGJ05
If H tunneling in the orthorhombic phase indeed occurs only in the twin boundaries, than the intensity of peak Pt would depend on their density, which in turn may depend on microstructure and thermal history. This might be the reason why the dielectric Pt in BCY15 is nearly three times more intense than in BCY10, a feature otherwise difficult to explain; additional measurements are necessary to clarify this issue.
Another factor that may contribute to lower the dielectric relaxation strength of Pt is the lattice polarization around the OH- ion; in fact, the actual dipole is not the bare OH- dipole with nominal charges , but it is due to the OH- complex plus the shifted surrounding atoms and with charge transfers with respect to the purely ionic case. We estimated the intensity of dielectric Pt assuming the OH dipole calculated in Ref. GIN99 , but the actual dipole may be even smaller.
V Conclusions
Three main relaxation processes have been identified both in the anelastic and dielectric spectra as due to hopping of H around an Y dopant (peak PY), hopping far from dopants (peak Ph) and tunneling within the four sites around a same O atom (peak Pt). An additional dielectric relaxation maximum around 60 K (Pd) does not involve H motion, but rather appears as a relaxation of electronic origin like small polaron hopping. Peak Pt can be fitted assuming a relaxation rate that is Arrhenius-like above K, possibly due to two-phonon transitions with optical phonons rather than to overbarrier hopping, below 50 K exhibits a dependence typical of two-phonon transitions with acoustic phonons, and finally becomes nearly constant below K, as expected from one-phonon transitions. The isotopic substitution with D decreases the rate by a factor of . The dielectric spectra are more difficult to analyze, due to the presence of peak Pd and possibly other peaks at lower temperature, but reasonable fits are obtained using the same anelastic expression of Pt with a rate increased by times; such a difference in the rate may be due to the fact that, although not clearly distinguishable, there are at least three anelastic and dielectric relaxation modes contributing to Pt, having different strengths and rates.
The intensity of the dielectric Pt is nearly 40 times smaller than expected from a simple estimate of the reorientation of the electric dipole associated with the OH- ion. It is shown that, while this suppression of the dielectric relaxation would be easily explained in terms of coherent tunneling of H around O in a cubic environment, the same seems not to be true in the presence of the low-temperature orthorhombic distortion. As alternative or concomitant explanations, it is proposed that H tunneling may occur only in the more symmetric cells within twin walls, while slower semiclassical reorientation of OH- would occur within the orthorhombic domains; in addition, the total dipole of OH- ion and surrounding lattice polarization may be smaller than expected.
Acknowledgments
We wish to thank S. Ciuchi for useful discussions on the coherence of the polaron states, O. Frasciello for valuable suggestions on the dielectric measurements, and F. Corvasce, M. Latino, A. Morbidini for their technical assistance. This research is supported by the FISR Project of Italian MIUR: ”Celle a combustibile ad elettroliti polimerici e ceramici: dimostrazione di sistemi e sviluppo di nuovi materiali”.
References
- (1) K.D. Kreuer, Solid State Ion. 97, 1 (1997).
- (2) M. Glerup, F.W. Poulsen and R.W. Berg, Solid State Ion. 148, 83 (2002).
- (3) K.S. Knight, Solid State Ion. 127, 43 (2000).
- (4) M.A. Gomez, M.A. Griffin, S. Jindal, K.D. Rule and V.R. Cooper, J. Chem. Phys. 123, 94703 (2005).
- (5) W. Münch, G. Seifert, K.D. Kreuer and J. Maier, Solid State Ion. 86- 88, 647 (1996).
- (6) T. Ito, T. Nagasaki, K. Iwasaki, M. Yoshino, T. Matsui, H. Fukazawa, N. Igawa and Y. Ishii, Solid State Ion. 178, 607 (2007).
- (7) M. Pionke, T. Mono, W. Schweika, T. Springer and H. Schober, Solid State Ion. 97, 497 (1997).
- (8) Th. Matzke, U. Stimming, Ch. Karmonik, M. Soetratmo, R. Hempelmann and F. Güthoff, Solid State Ion. 86, 621 (1996).
- (9) M.E. Björketun, P.G. Sundell and G. Wahnström, Phys. Rev. B 76, 054307 (2007).
- (10) R. Hempelmann, Ch. Karmonik, Th. Matzke, M. Cappadonia, U. Stimming, T. Springer and M.A. Adams, Solid State Ion. 77, 152 (1995).
- (11) R. Hempelmann, M. Soetratmo, O. Hartmann and R. Wäppling, Solid State Ion. 107, 269 (1998).
- (12) F. Giannici, A. Longo, F. Deganello, A. Balerna, A.S. Arico and A. Martorana, Solid State Ion. 178, 587 (2007).
- (13) H. Maekawa, Y. Ukei, K. Morota, N. Kashii, J. Kawamura and T. Yamamura, Solid State Commun. 130, 73 (2004).
- (14) F. Deganello, G. Marcì and G. Deganello, submitted to J. Eur. Ceram. Soc.
- (15) Q. Xu, D.-P. Huang, W. Chen, J.-H. Lee, H. Wang and R.-Z. Yuan, Scripta Mater. 50, 165 (2004).
- (16) A.S. Nowick and B.S. Berry, Anelastic Relaxation in Crystalline Solids. (Academic Press, New York, 1972).
- (17) F. Craciun, unpublished.
- (18) A.S. Nowick and W.R. Heller, Adv. Phys. 14, 101 (1965).
- (19) F. Cordero, Phys. Rev. B 47, 7674 (1993).
- (20) Y. Du, J. Phys. Chem. Sol. 55, 1485 (1994).
- (21) L. Zimmermann, H.G. Bohn, W. Schilling and E. Syskakis, Solid State Ion. 77, 163 (1995).
- (22) M.E. Björketun, P.G. Sundell, G. Wahnström and D. Engberg, Solid State Ion. 176, 3035 (2005).
- (23) W. Münch, K.D. Kreuer, ST. Adams, G. Seifert and J. Maier, Phase Transitions 68, 576 (1999).
- (24) G. Cannelli, R. Cantelli, F. Cordero and F. Trequattrini, Phys. Rev. B 49, 15040 (1994).
- (25) G. Cannelli, R. Cantelli, F. Cordero, F. Trequattrini and H. Schultz, J. Alloys and Compounds 231, 274 (1995).
- (26) F. Cordero, A. Paolone and R. Cantelli, J. Alloys and Compounds 330, 467 (2002).
- (27) Tunneling Systems in Amorphous and Crystalline Solids. ed. by P. Esquinazi (Springer, Berlin, 1998).
- (28) I. Kuskovsky, B.S. Lim and A.S. Nowick, Phys. Rev. B 60, R3713 (1999).
- (29) C.P. Flynn and A.M. Stoneham, Phys. Rev. B 1, 3966 (1970).
- (30) M.I. Klinger, Phys. Rep. 94, 183 (1983).
- (31) V. Storchak, J.H. Brewer, W.N. Hardy, S.R. Kreitzman and G.D. Morris, Phys. Rev. Lett. 72, 3056 (1994).
- (32) In Ref. MKA99, the barrier is calculated assuming that the proton is a classical particle. Yet, the comparison with in Eq. (5) should be meaningful, since is the effective activation energy of the fast H motion in the high temperature limit, which eventually becomes overbarrier hopping.
- (33) A. Mineshige, S. Okada, M. Kobune and T. Yazawa, Solid State Ion. 177, 2443 (2006).
- (34) R. Glöckner, M.S. Islam and T. Norby, Solid State Ion. 122, 145 (1999).
- (35) M. Winterstetter and M. Grifoni, Phys. Rev. B 62, 3237 (2000).
- (36) S. Fratini and S. Ciuchi, Phys. Rev. Lett. 91, 256403 (2003).
- (37) P.G. Sundell, M.E. Björketun and G. Wahnström, Phys. Rev. B 76, 094301 (2007).
- (38) I. Charrier-Cougoulic, T. Pagnier and G. Lucazeau, J. Solid State Chem. 142, 220 (1999).
- (39) M. Calleja, M.T. Dove and E.H. Salje, J. Phys.: Condens. Matter 15, 2301 (2003).