Comparisons between isothermal and NFW mass profiles for strong-lensing galaxy clusters
Abstract
While both isothermal and NFW-based mass models for galaxy clusters are widely adopted in strong-lensing studies, they cannot easily be distinguished based solely on observed positions of arcs and arclets. We compare the magnifications predicted for giant arcs obtained from isothermal and NFW profiles, taking axially-symmetric and asymmetric mass distributions into account. We find that arc magnifications can differ strongly between the two types of density profiles even if the image morphology is well reproduced. Magnifications by lenses with NFW density profiles are usually larger than those for lenses with singular or nearly singular isothermal density profiles, unless the latter have large cores. Asymmetries play an important role. We illustrate our results with the two well-studied clusters MS 2137 and A 370. We confirm earlier results showing that both isothermal and NFW mass models can very well reproduce the observed arcs, radial arcs and other arclets. While the mass model for MS 2137 is not very well constrained, the two types of mass models produce strongly differing critical curves and caustics for A 370. We find that the NFW mass profile is preferred for A 370. We identify new arclet candidates in the field of A 370. Redshift estimates allowed by the lens model are consistent with results in the literature, where available. Three newly found counter-images are suggested to arise from an active, dust-enshrouded star-forming galaxy at .
Subject headings:
dark matter - gravitational lensing - galaxies: clusters: individual (MS 2137, A 370)1. Introduction
Strong lensing by galaxy clusters, giving rise to strongly distorted arc-like images, plays an important role in studies of the mass distributions of galaxy clusters. It is highly non-linear, weakly affected by baryonic physics, and the data reduction is comparatively simple because it focuses on the positions of arcs and arclets (e.g. Leonard et al 2007; Limousin et al 2006; Halkola, Seitz & Pannella 2006; Zekser et al 2006; Covone et al 2006; Comerford et al 2006; Broadhurst et al 2005; Gavazzi 2005; Gavazzi et al 2003; Smith et al 2005; Kneib et al 2003; Kneib et al 1993; Mellier, Fort & Kneib 1993; Hammer 1991). Cosmological applications of strong lensing range from the use of clusters as gravitational telescopes (Frye et al 2007; Ofek et al 2006; Chary, Stern & Eisenhardt 2005; Kneib et al 2004; Ellis et al 2001) to cosmological constraints based on arc statistics (Fedeli et al 2008; Hamana et al 2005; Li et al 2005; Meneghetti et al. 2005a,b; Puchwein et al 2005; Dalal & Holder, 2004; Wambsganss et al 2004; Bartelmann et al 1998). Currently, about 100 clusters are known to contain large arcs, including those newly discovered by Bolton et al (2006) in the Sloan Digital Sky Survey data.
One way of investigating cluster mass distributions with strong lensing starts from an assumed mass profile, which is commonly taken to be the well-known singular or non-singular isothermal sphere (SIS or NIS, respectively)
| (1) |
where is the radius from the cluster centre and the core radius.
Another mass model commonly used for strong lensing is based on the high-resolution numerical simulations of dark-matter halos in the CDM framework by Navarro, Frenk & White (1996, 1997; hereafter NFW), who found the density profile
| (2) |
parameterized by the scale radius . While simulations and X-ray observations of galaxy clusters both support the NFW profile and applications to strong-lensing studies have been successful (Zekser et al 2006; Comerford et al 2006; Kneib et al 2003), the SIS and NIS models can also reproduce observed arcs remarkably well in many clusters (e.g. Kneib et al 1993; Mellier et al 1993; Miradal-Escudé 1995; Gavazzi et al 2003; Gavazzi 2005).
So far, conclusive evidence that the density profiles of real and simulated galaxy clusters agree with each other has not been found. Unfortunately, it is virtually impossible to distinguish isothermal and NFW density profiles based solely on the positions of observed arcs because of the near-degeneracy between these two density profiles close to the scale radius. If radial arcs or multiple tangential arcs at different distances from the cluster centre are available, the situation improves substantially because they probe the density profile at different radii (Gavazzi et al 2003; Gavazzi 2005; Tu et al 2008). While the positions of arcs and arclets are determined by the first derivative of the lensing potential, their magnifications and distortions depend on its second derivatives. Different models reproducing the image geometry can thus yield substantially different image magnifications.
The scientific goal of this paper is to investigate how relative arc and arclet magnifications can be used to break degeneracies between different mass models for strongly lensing clusters when combined with positional and photometric information.
Two well-studied clusters, A 370 and MS 2137, are used for illustration. The code for fitting lens models is based on Comerford et al (2006) and will be briefly described below. Wherever needed, we adopt the “concordance” flat cosmology with , and Hubble constant .
The paper is structured as follows. Starting from a one-component lens model, we compare in Sect. 2 the predicted magnifications of the resulting arcs for the SIS, NIS, and NFW profiles, respectively, starting from axial symmetry and taking deviations therefrom into account. The results are easily extrapolated to lens systems with multiple components since the distance between two lens components is typically larger than their core or scale radii, or . In Sect. 3, earlier work on MS 2137 and A 370 is briefly summarized. We adapt different mass models to these clusters, derive the arc magnifications and compare with observations. Based on the high-quality images observed, we study the arclets in the field of A 370 in detail. We present our conclusions in Sect. 4.
2. Theoretical perspectives
2.1. Basic lensing notation
We first outline the notation to be used below. As usual, lenses are assumed to be sheet-like perpendicular to the line-of-sight. Then, the lens mapping from the lens to the source plane can be written as
| (3) |
and the local distortion of the lensed images is determined by the Jacobian matrix
| (4) |
where and are dimensionless coordinates in the source and lens planes, respectively, and is the effective lensing potential, which characterizes the lensing mapping completely for any given lens model. The magnification at a given position is
| (5) |
Giant arcs appear close to the critical curves when their sources are close enough to the corresponding caustics. Since giant arcs are the most pronounced structures due to highly non-linear strong lensing, they provide sensitive constraints on the lens models.
For simplicity, we adopt in the following subsections a one-component lens model to illustrate the predicted magnifications of expected giant arcs for the SIS, NIS, and NFW profiles, respectively. Although real lenses typically have multiple components, the main conclusions on the magnification will remain valid because they are due to generic lensing behaviour near critical curves or caustics.
2.2. Axial symmetry
If the lens is axially symmetric, i.e. the ellipticity , we can obtain the radial gradient of the lens mapping Eq. (4) at the radius where giant tangential arcs appear. There, . We introduce
| (6) |
throughout this section for easier comparison. We plot the gradient as a function of in Fig. 1, where the solid, dotted and dashed lines show the results for SIS, NIS, and NFW profiles, respectively.
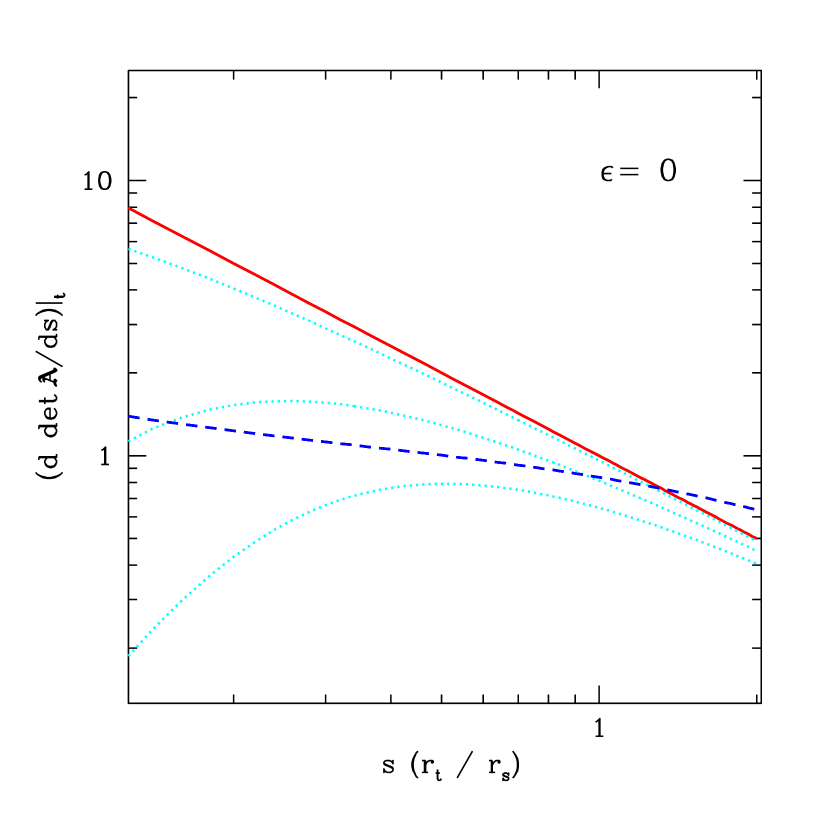
The radial gradient of the Jacobian determinant at the tangential critical curve is smaller for NIS profiles with different core radii than for the SIS profile, since the NIS density profile is always flatter than that of the SIS, thus the projected mass distribution is flatter for the NIS. With increasing core radii in NIS profiles, i.e. decreasing , the gradient decreases due to the flattening of the density profiles. If the giant arc is located at a radius , i.e., , the gradient is larger for a NFW than for the SIS and NIS profiles because it is steepens towards outside the scale radius. If the giant arc appears in the inner region, i.e. , the gradient for a SIS or a NIS lens with a small core () is larger than that for a NFW lens, while the gradient for a NIS profile with a relative large core () is smaller than for a NFW profile due to its flatter density profile.
It is interesting to study the corresponding magnifications of the giant arcs produced by these different mass profiles. The determinant of the lens mapping in Eq. (4) at a distance from the critical curve can be written as
| (7) |
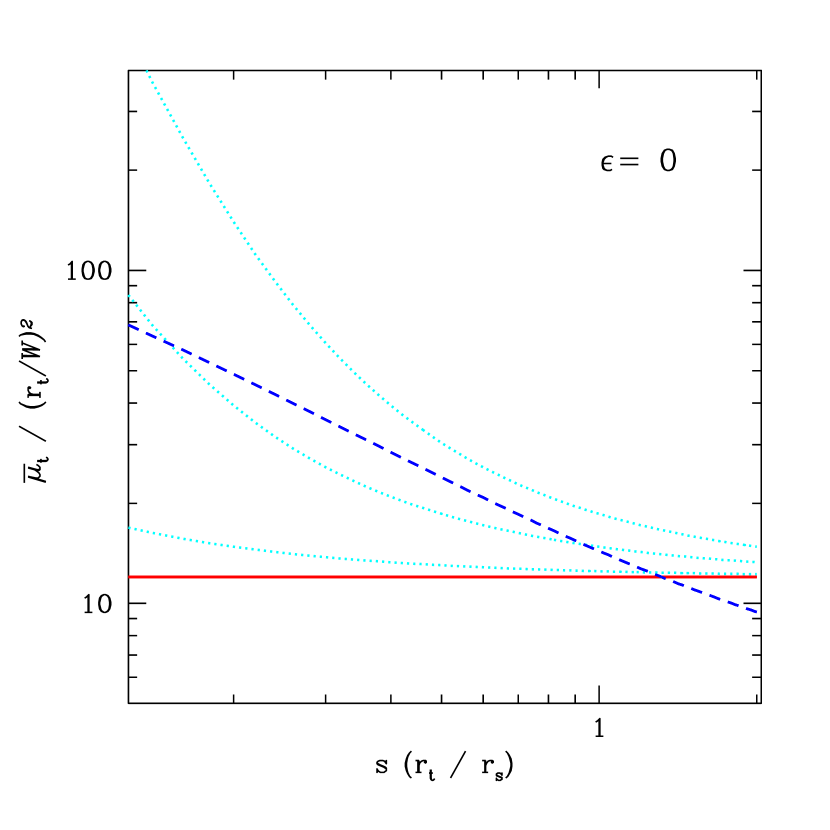
where the subscript again denotes the position of the tangential critical curve where . If the width of the arc is , its total magnification can be expressed by
| (8) | |||||
If an observed giant arc appears at a radius from the cluster centre with a width of , say, its estimated magnification can reach .
The predicted total magnification scaled by for giant arcs as a function of their distance from the lens centre is plotted in Fig. 2 with the same meaning of the line types as in Fig. 1. The figure shows that the expected magnification of an arc is always lower for a SIS than for a NIS model, given the observed positions of giant arcs and their widths. This is because the SIS profile is always steeper than the NIS profile. If the arc appears at , the predicted magnification for a NFW profile is the lowest due to the steepest density distribution. If the arc appears at , the expected magnification for the SIS or the NIS models with a small core () is lower than that for a NFW model. Only when the core of the NIS profile is large (), comparable to the scale radius of a NFW profile, the expected magnification is larger than that for a NFW model since its density profile will be significantly flatter in the inner region. The conclusions can thus be well understood in terms of the flatness of the density profile near the arc locations. See also the discussion in Meneghetti et al (2005b).
2.3. Asymmetry
Since the gravitational potentials of real lensing clusters must be asymmetric, as was already pointed out by Grossman & Narayan (1988), Kovner (1989), Mellier et al (1993) and Miralda-Escudé (1995), we now turn to asymmetric models, which play an important role in cluster-lensing studies (Bartelmann & Meneghetti 2004). As in Bartelmann & Meneghetti (2004), we define the surface-mass distribution of the cluster in terms of the projected elliptical radius
| (9) |
Here, is the position angle counterclockwise from the axis. The ellipticity
| (10) |
of an ellipse with major and minor axes and refers to the lensing potential rather than the projected density. Note that the definition is chosen so as to conserve the total projected mass within independent of ellipticity, as pointed out by Meneghetti et al (2005b).
Projected ellipticities of real clusters are not very large; they are always smaller than their real ellipticities in three dimensions. We restrict our theoretical results to the first order in in this subsection. Then, the critical curve approximates an ellipse. Without restriction, we assume that its major and minor axes are oriented along the and coordinates, respectively. Giant arcs preferentially appear near positions with either or from sources in the neighbourhood of cusp points in the caustics.
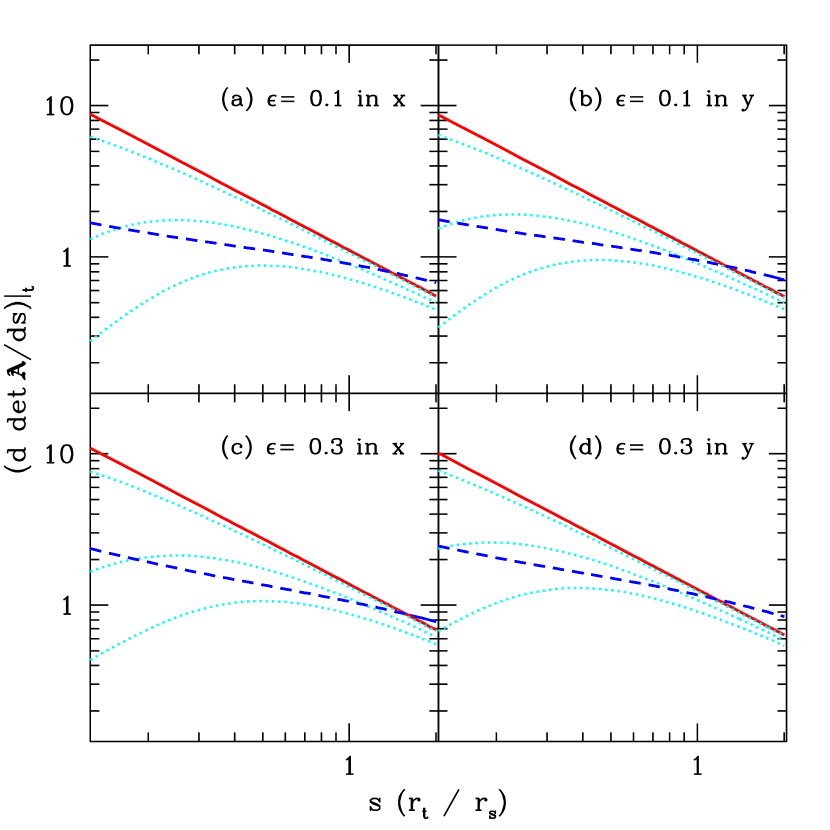
The gradient of the Jacobian determinant of the lens mapping Eq. (4) perpendicular to the critical curve at and , where giant tangential arcs are expected to appear, is shown in Fig. 3 as a function of the dimensionless radius for different ellipticities . The line types are chosen as in Figs. 1 and 2. For a given , the gradient exhibits the same behaviour as in Fig. 1 for axially-symmetric SIS, NIS, and NFW density profiles for the same reasons.
Comparing with axially-symmetric lens models, the situation for different ellipticities is more complicated. Two factors will affect the gradient of the Jacobian determinant and its influence on a giant arc at a given position: (1) the total mass enclosed by a circle traced by the arc, and (2) the density gradient. Ellipticity enhances the tidal field and thus shifts critical curves towards larger radii. Thereby, it increases the gradient because of the increasing steepness of the projected density profile for a given mass model.
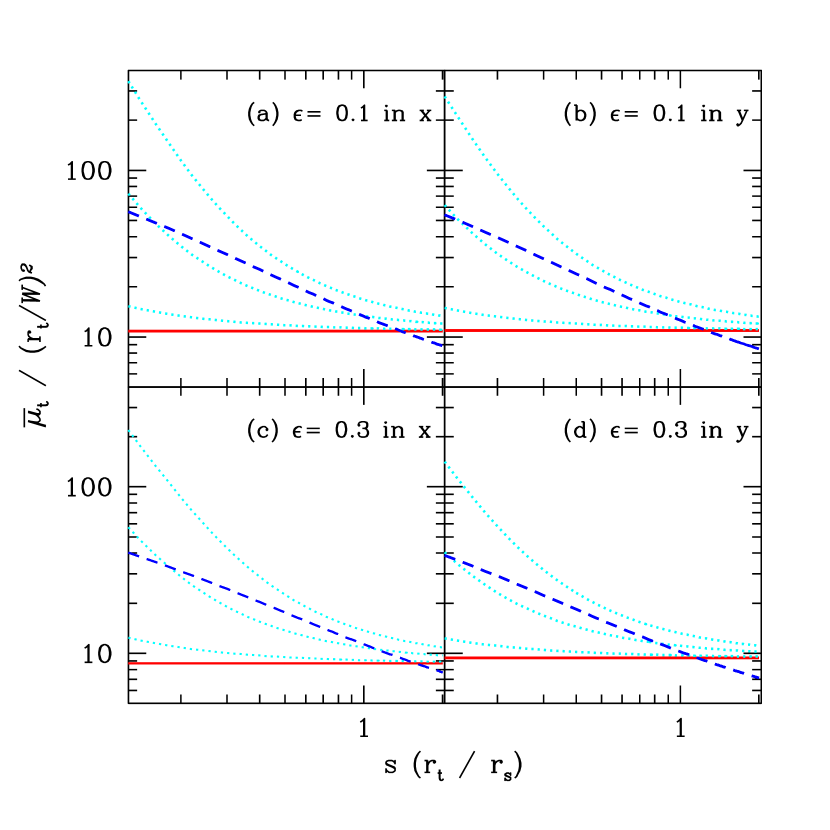
As in the previous subsection, we plot in Fig. 4 the expected magnification for arcs near the and axes as a function of their distance from the cluster centre for asymmetric lens models. The figure shows that the arc magnifications show the same general trends as in Fig. 2, for the same reasons. Note that the magnifications of axially-symmetric and axially-asymmetric models differ significantly even if the ellipticity is small. The predicted magnifications of arcs for individual mass models decrease for increasing because of similar reasons as discussed above, especially for arcs near , i.e. near the major axis.
In summary, the expected magnifications for giant arcs in lenses with different mass models are different even though the arc positions can be reproduced by all of them. Asymmetry of the mass distribution plays an important role for strong lensing. The resulting magnifications can change substantially even if the system’s ellipticity is small. Although the absolute magnifications for individual arcs or arclets cannot be obtained observationally, lens models will be additionally constrained by the relative magnifications of arc or arclet pairs from the same sources within a lens system. We shall use the well-studied clusters A 370 and MS 2137 as illustrations in the next section.
3. Illustration: A 370 and MS 2137
As discussed in the previous section, different mass models are possible for individual galaxy clusters if they are only based on the observed positions of giant arcs. Relative magnifications of arc or arclet pairs from individual sources in a lens system can be used to constrain the mass model further. We will investigate the arc magnifications in NIS and NFW models, which can well reproduce the arc configurations in A 370 and MS 2137, respectively. We choose these two clusters for the following reasons:
-
•
They are prototypical lensing clusters, with A 370 consisting of two mass components and MS 2137 having one dominant component.
-
•
Both of them have large tangential and radial arcs, which mass models are required to fit.
-
•
Both of them have at least two arc or arclet pairs with photometric data available in several bands, which allow us to use relative magnifications (i.e. flux ratios) of image systems from individual sources to further constrain the mass models.
-
•
High-quality HST images are available for both of them, which can be used for detailed strong-lensing studies.
-
•
Both clusters have been thoroughly studied earlier, which allows detailed comparisons.
-
•
For A 370 in particular, we have high-quality images in the , , , , , , and bands taken by Subaru with a median seeing of (Cowie et al. 2008), and in four infrared channels observed by IRAC on-board the Spitzer space telescope in addition to its HST archive images. The deep optical and NIR images permit the identification of individual images of lensed galaxies in the A370 region studied in the present paper. The IRAC images have resolution and will be used to study in detail the spectral energy distributions (SEDs) for the sources combined with the optical and NIR data in a forthcoming paper.
We shall very briefly summarize earlier work on these two clusters in the following subsections. Different mass models will be applied to the two clusters in order to reproduce the main observed features of arcs and arclets. Since there are many arclets observed in the field of A 370 and extensive observational data are available, we will study this cluster in more detail.
Our models improve the previous lens models for MS 2137 and A 370 in the following way. Gavazzi et al (2003) studied the density profile for MS 2137 in detail and Comerford et al (2006) successfully applied the NFW density profile to this cluster. Both studies did not explicitly consider the relative magnifications between image pairs from individual sources as constrained by the photometric observations, which we focus on in this paper. For A 370, we not only employ more observed arclet pairs than Comerford et al (2006) to constrain the mass model, but also compare their magnifications with the observed photometry. Moreover, we study additional arclets in more detail, including their estimated lens redshifts.
We use the same code as in Comerford et al. (2006) to fit mass models to observations. Although only NFW profiles were fit to observations there, isothermal density profiles are also provided by this code.
Briefly, it proceeds as follows: Varying the density-profile parameters, it strives (1) to make arc sources as small as possible, (2) to make arcs and arclets produced from these sources match the observed data as closely as possible, and (3) to avoid additional images arising from the sources or make them faint enough to be compatible with the observations.
These three requirements are quantified by three contributions to a figur-of-merit function, which is jointly minimized to find the best-fitting model parameters. This function is not precisely a function, as it cannot be normalised to the degrees of freedom because the intrinsic source size is unknown. See Comerford et al. (2006) for more detail. Relative magnifications, i.e. the flux ratios, between images in image systems of individual sources, are not included in the figure-of-merit function when fitting mass models to MS 2137 and A 370 in the following subsections. They are used in the further discussions on how well the best-fitting models can match the photometric observations.
3.1. MS 2137
MS 2137 is a rich cD cluster at . Early studies by Mellier, Fort & Kneib (1993) and Miralda-Escudé (1995) found that elliptical isothermal models can reproduce the observed arc system remarkably well. Miralda-Escudé (2002) suggested that its mass distribution should be highly elliptic. Comerford et al (2006) showed that the cluster can also be modelled with NFW components. Based on archival data from the HST and the ESO-VLT, Gavazzi et al (2003) and Gavazzi (2005) investigated its mass profile in detail and found that it can be fit by the isothermal and the NFW density profiles alike. Based on a possible fifth image in the very cluster centre and on stellar kinematical data, they concluded that the isothermal model may be preferred.
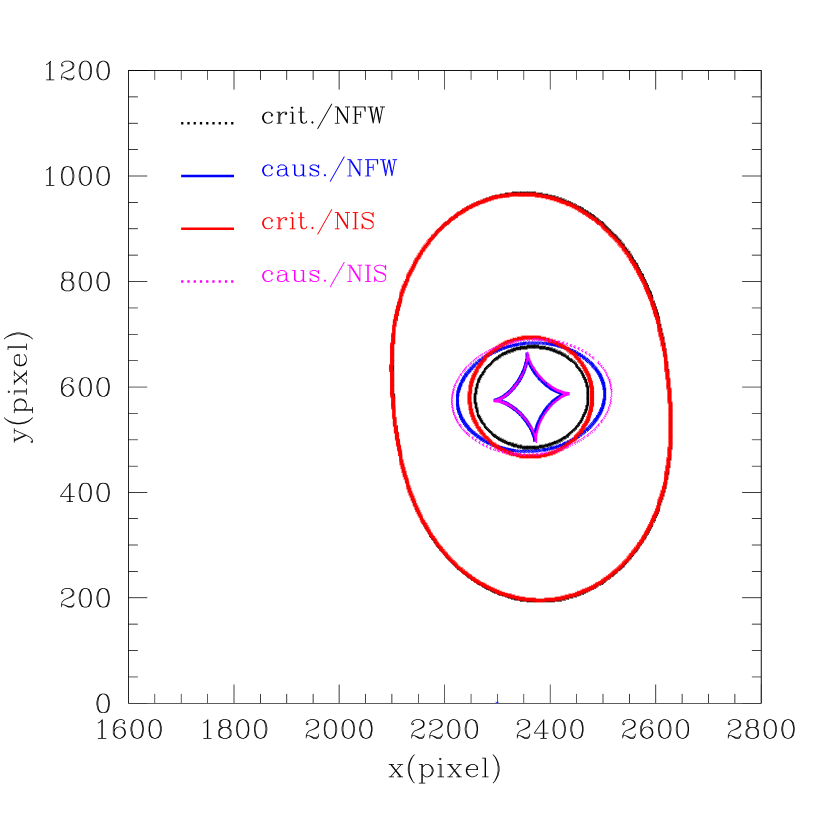
We fit both the NIS and the NFW mass density profiles to MS 2137, attempting to reproduce the observed five arcs including the radial arc. We adopt a single lens component at the position of the cD galaxy, similar to Comerford et al. (2006). The predicted critical curves and caustics of the different best-fitting models are shown in Fig. 5. They are almost identical for the two types of model, which confirms the results of earlier studies, since a one-component lens system cannot be tightly constrained with arc systems at identical or similar redshifts.
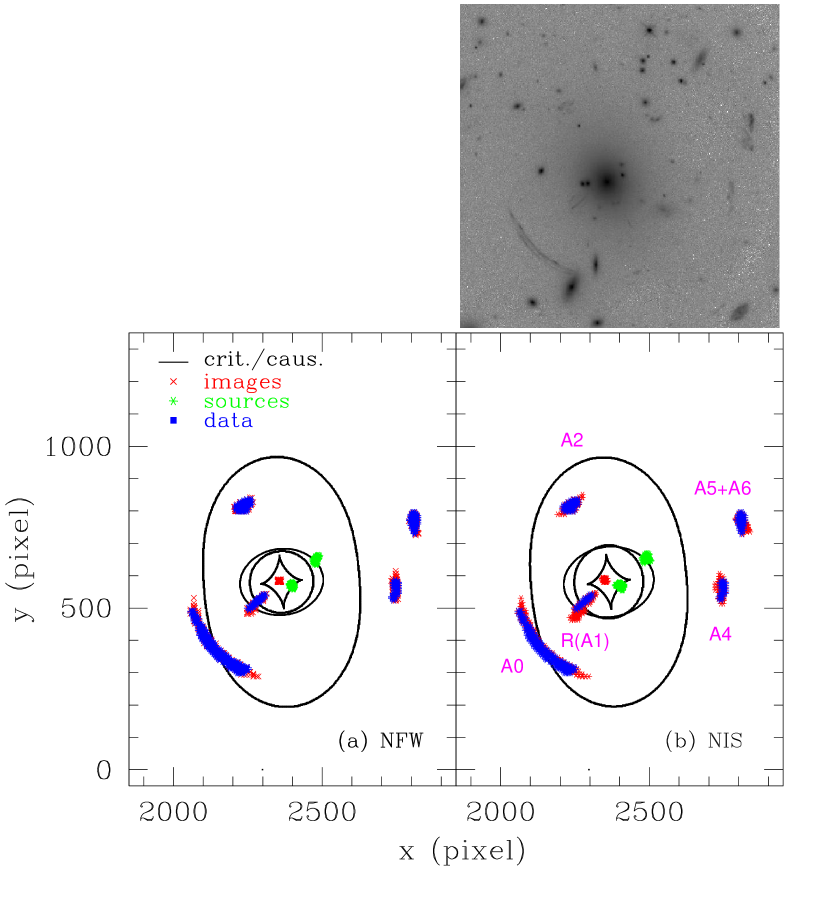
The reproduction of the arc systems by the best-fitting mass models are shown in Fig. 6 adopting the notation of Gavazzi et al (2003), where (A0, A2, A4) and (A1, A5+A6) are identified as counter-images of two different sources. The best-fitting model parameters are given in Tab. 1. The figures-of-merit obtained with the complete set of input data points read off the observational data are also listed in the table. It appears that the NFW profile is preferred based on the figures-of-merit of different best-fitting mass models. Note that the figure-of-merit in this paper adds the three contributions of sources, the observed and the predicted images. Although it does not have the usual absolute statistical meaning of a properly normalised function, it can still serve to evaluate different models based on identical input data (see Comerford et al (2006) for more detail).
Since we use the same multiple-image systems as Comerford et al (2006) to constrain our models, the model parameters obtained for the NFW profile are similar except for a very small difference in , where we find rather than the of Comerford et al (2006), which is perfectly within the expected uncertainty.
The parameter is the amplitude of the convergence profile , defined by
| (11) |
for the NFW profile with and by
| (12) |
for the NIS profile, where and are the radius and the core radius in units of the Einstein radius. Both the NFW and the NIS models predict a fifth-image in the central cluster region which was confirmed by Gavazzi et al (2003) after subtracting the light produced by the cD galaxy.
| cluster | lens | model | |||||
|---|---|---|---|---|---|---|---|
| () | (deg) | ||||||
| MS 2137 | – | 0.19 | NFW | ||||
| – | 0.82 | NIS | |||||
| A 370 | G1 | 0.16 | NFW | ||||
| G2 | NFW | ||||||
| G1 | 2.5 | NIS | |||||
| G2 | NIS |
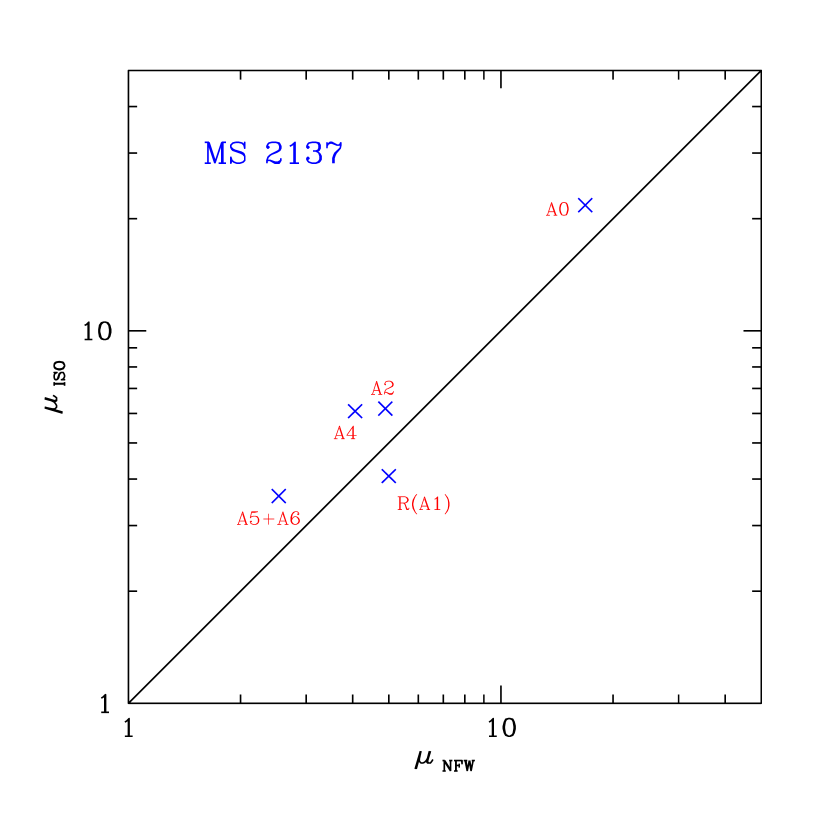
The predicted absolute magnifications for the individual arcs are shown in Fig. 7 for the two different best-fitting mass models for MS 2137, with the solid diagonal indicating where the two magnifications for individual arcs would agree. As the figure shows, the arc magnifications predicted by the two models agree well. This implies that further constraints on the density profile for MS 2137 based on relative image magnifications of arcs from individual sources cannot be expected because MS 2137 is a relatively simple lens.
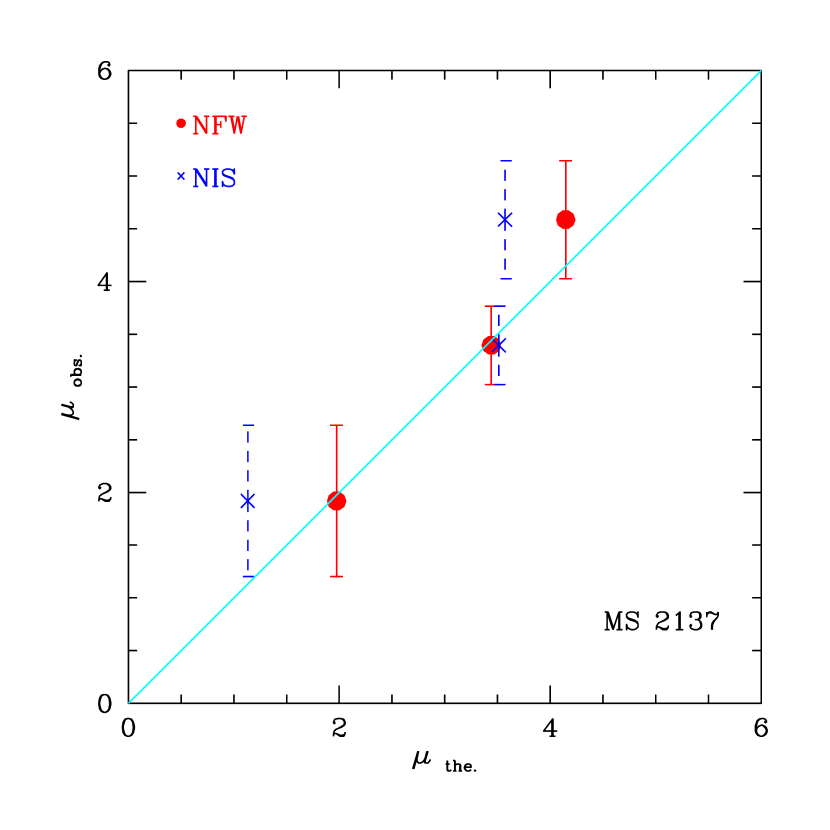
Observationally, we can obtain the relative magnifications for three arc or arclet pairs, i.e., A0/A2 and A0/A4 for the giant arc and A1/(A5+A6) for the radial arc, resulting from two sources based on the photometric data in seven bands (, , , , , and ; Gavazzi et al 2003). The averaged results obtained in seven bands are shown in Fig. 8 with their photometric errors. We find that the model predictions by both the NIS and the NFW model are roughly in agreement with the averaged relative magnifications for these three pairs within the observational errors, although the NFW model again appears slightly preferred. We conclude that both the NIS and the NFW mass profiles work well for MS 2137, even if the magnification, which is the second order of the derivative of the potential, is considered.
Moreover, with the exception of the radial arc, the predicted magnifications are somewhat higher for the NIS than for the NFW model, which can be understood as follows. According to the parameters of the best-fitting models for MS 2137 given in Tab. 1, , showing that the core radius of the NIS model is comparable to the scale radius of the NFW profile. This yields higher predicted magnifications for the arcs reproduced by the NIS compared to the NFW model (cf. Fig. 4). It should be pointed out that the predicted magnification of the radial arc is calculated according to Eq. (5) based on its observed image location, which straddles the corresponding critical curve. The resulting magnification mainly depends on its observed size, which is difficult to measure accurately since it is located in the very central region of the lens.
3.2. A 370
Abell 370 () was the first cluster in which gravitational arcs were observed (Soucail et al 1987). This two-component, strongly lensing system provides an interesting case for us to study the magnifications of individual observed arcs and arclets in detail, and to compare with previous work.
This cluster has frequently been studied. For instance, Kneib et al (1993) reconstructed the mass distribution of A 370 based on the observed giant arc (A0) and the arc pair (B2,B3) to conclude that the dark matter appears to follow the light distribution for this cluster. Bartelmann (1996) showed that, as in MS 2137, the radial arc can be reproduced by an NFW model, which was recently confirmed with a detailed model by Comerford et al (2006). Using a deep HST image, Bézecourt et al (1999) constructed a mass model for A 370 based on a truncated pseudo-isothermal distribution and found that the observed lensed images can be well reproduced. Using A 370 as a natural telescope, Hu et al (2002) found a galaxy at and Chary, Stern & Eisenhardt (2005) argued that its star formation rate could be , thus providing useful clues to the galaxy-formation models at high redshift.
We adopt the notation of Bézecourt et al (1999) and Kneib et al (1993) for the different arcs and arclets in the field of A 370 to facilitate comparisons with earlier studies. The additional arclet candidates we identify are jointly labeled by “Z” below. For clarity, we only show one colour image of A 370 combined from the , and bands rather than separate images in individual bands, with the individual arcs and arclets identified in Fig. 9. Note that A5 appears near the bottom since it appeared near the boundary of the -band image, but it can be very clearly seen in the band.
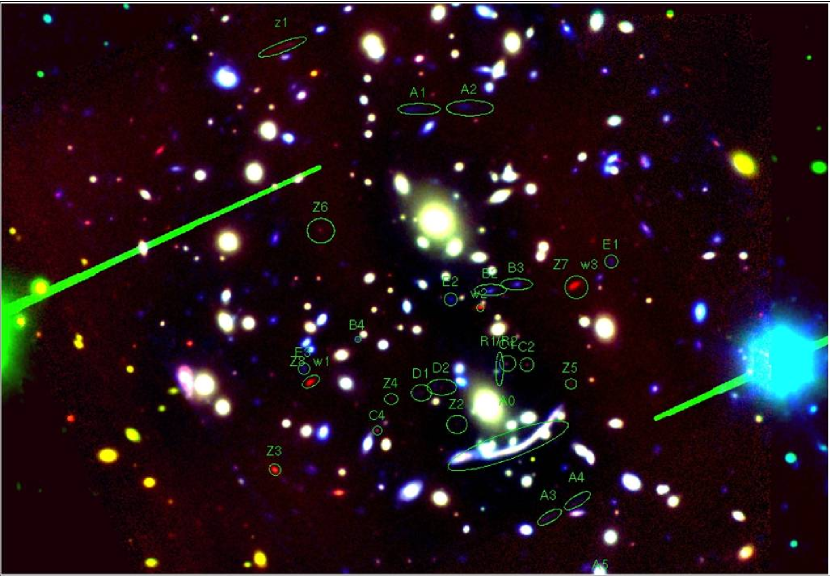
Since there are many arcs and arclets in the field of A 370, we list below the image systems produced by individual sources for clarity, except the well defined giant arc A0, the radial arc R and the arc systems B, C, D and E (Bézecourt et al 1999). In the labeled “A” sequence, (A1, A2) and (A3, A4) are arc pairs produced by two different sources. A5 is a single arc. For the newly found arcs labeled by “Z”, we suggest in the next subsection that Z1, Z3, and Z6 be arcs produced by three different sources and (Z2, Z4, Z5) result from a single source. Z7 and Z8 (also labeled as W3 and W1 respectively in Fig. 9) with W2 are identified as counter-images of another source (see next subsection).
As for MS 2137, we first construct both a NIS and a NFW mass model for A 370 reproducing the giant arc A0, the radial arc R, the arclets (A1, A2), (B2, B3), and A5. An extra arclet pair labeled (A3, A4) is also included, which is easily seen in Fig. 9 especially in the -band. In total, we use nine relatively bright arcs and arclets produced by six sources to constrain the mass model for A 370. The lens components are fixed at the centres-of-light of the two bright cD galaxies.
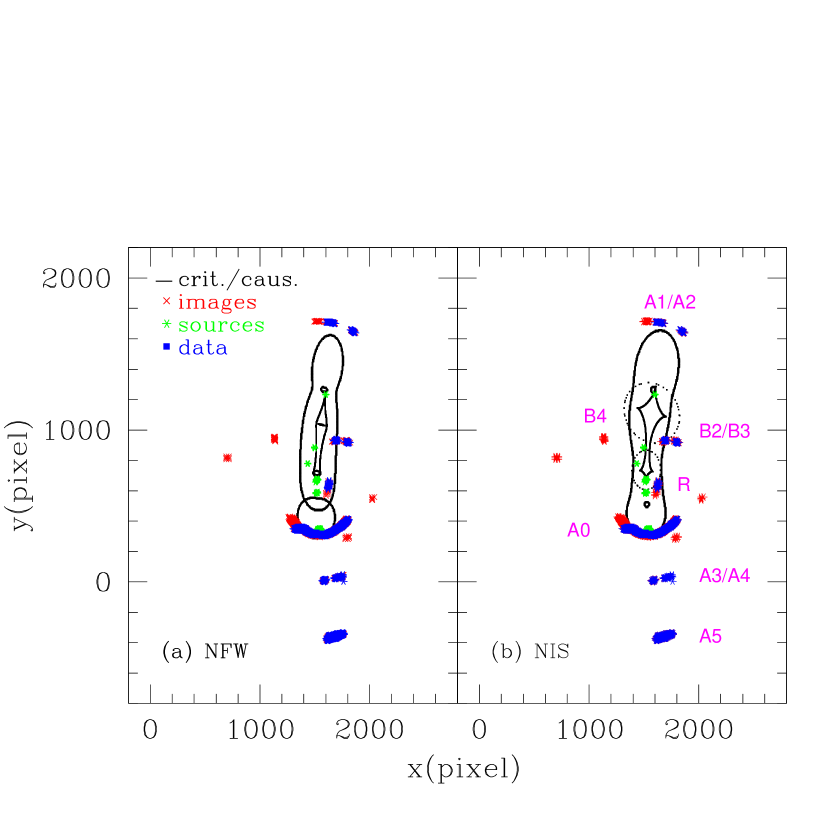
The best-fitting model parameters are listed in Tab. 1 together with the averaged figures-of-merit of the complete set of data points. The corresponding critical curves, caustics and the reproduced images are shown in Figs. 10 and 11. Our results for the NFW model are very close to those found by Comerford et al (2006) where the six arcs and arclets A0, R, (A1, A2) and (B2, B3) were taken into account. This suggests that (A1, A2) and (B2, B3) play important roles in the mass configuration for A370 (Kneib et al 1993). We point out that the high value of and the low value of in the best-fitting NIS model imply that the arc in A 370 can be very well reproduced by nearly-singular isothermal lens components.
Since the redshifts of individual sources can also be considered as free parameters during the model fitting, we can obtain gravitational-lensing estimates for individual source redshifts, using the measured redshift of the giant arc A0 as a reference for the relative lensing efficiency at different redshifts. This will be discussed further below in this subsection.
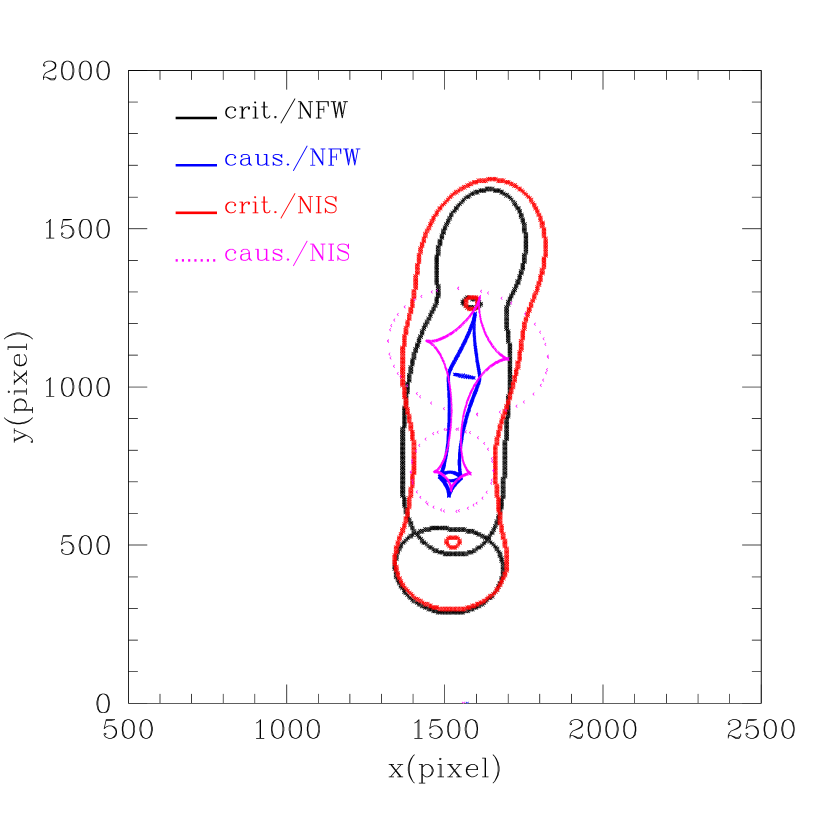
Note that the critical curves and caustics of the best-fitting models are very different for the two mass models, although both of them reproduce the observed positions of individual arcs and arclets very well (cf. Fig. 11). Since the selected arcs and arclets can well constrain the mass configuration for A 370, this implies once again that mass profiles in clusters cannot be clearly distinguished based exclusively on the image positions observed in strong lensing.
Although both best-fitting models succeed in reproducing the main features of the observed arcs and arclets, there are four extra images predicted that were not yet found observationally. The image near the top in Fig. 11 is the counter-image predicted for B2 and B3, which matches the observed counter-image labeled B4 in the figures of the next subsection. The other three are the predicted counter-images of the radial arc. These deviations arise because (1) the lens model constructed for A 370 only has two components centred on the cD galaxies without taking perturbations by additional lens components centred on less massive cluster galaxies into account; (2) the three additional images are too faint to be observed which is consistent with the predictions that their magnifications are small.
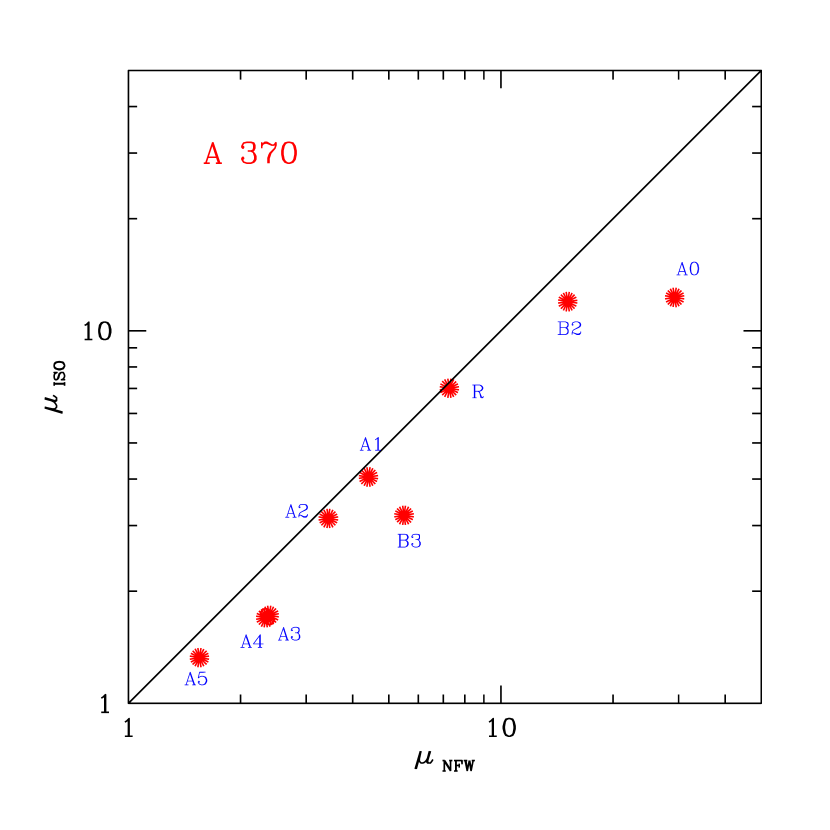
The predicted magnifications of the arcs and arclets selected to constrain the mass model for A 370 are calculated for both the NIS and the NFW density profiles and displayed in Fig. 12 for comparison. The expected magnifications of these nine arcs and arclets are always larger for the NFW than for the NIS profile, with the magnification of the giant arc being larger by a factor of . This is easily understood based on the theoretical results shown in Fig. 4. Since the ratio is very large for the best-fitting models of A 370, the magnifications by the NFW profile must exceed those by the NIS profile.
Since there are many arc and arclet pairs in A370 and high-quality images are available in eight optical and NIR bands, we can compare the expectations for the relative magnifications of the confirmed arclet pairs (B2, B3), (A1, A2) and (A3, A4) with the observations in individual bands, to determine which density profile may be preferred. Photometric data reduction is done using SExtractor (Bertin & Arnouts 1996) for optical and NIR. Here, we only show the results, while the detailed photometry will be described in a forthcoming paper studying the SEDs of the lensed galaxies in A 370.
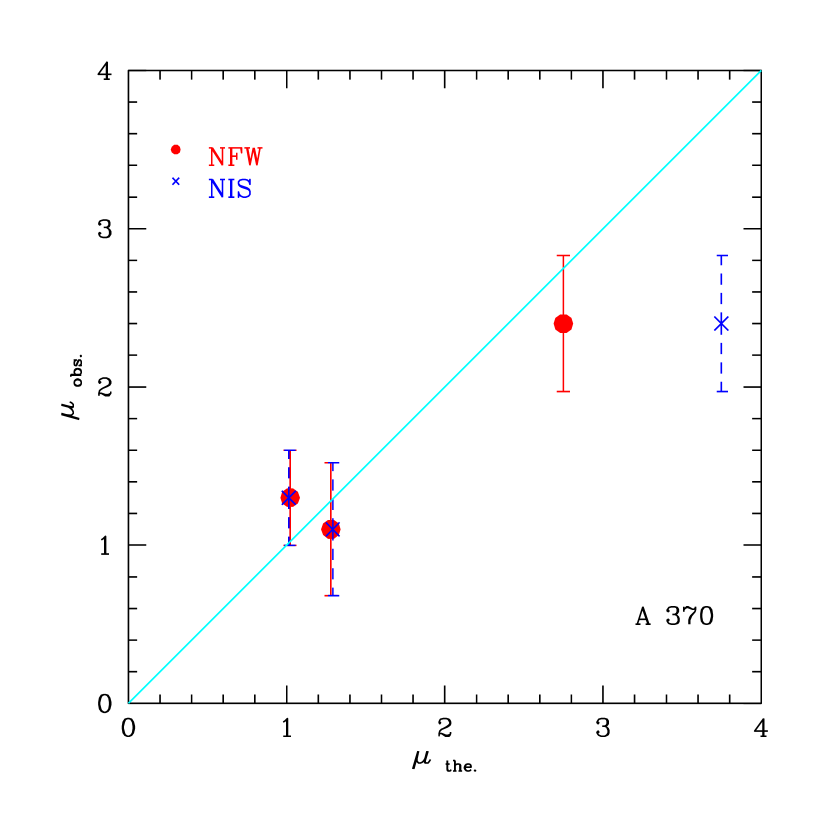
In Fig. 13, we plot the relative magnifications (i.e., flux ratios) of individual arclet pairs averaged over eight independent bands against the corresponding predicted values. Unlike in MS 2137, we find that the relative magnifications expected from the NFW profile can match the observations much better than those based on the NIS profile. The pair (B2, B3) plays an important role here. Mellier et al (1991) had already pointed out that (B2, B3) is very sensitive to the lens model. We confirm that the best-fitting NFW profile achieves a lower figure-of-merit than the NIS profile. According to the above analysis and current numerical simulations, we thus suggest that the NFW profile for A 370 matches the strong-lensing observations better than the NIS profile, and adopt it in the remainder of this paper.
As discussed above, the redshifts of individual sources can be seen as input parameters in the model fitting because lensing by a fixed mass distribution depends on a distance factor (see Comerford et al 2006) for sources at different redshifts. This allows redshift estimates for individual sources required by the best-fitting models. We proceed as follows. We choose the giant arc A0 as a reference, which has the spectroscopic redshift (Soucail et al 1988). By varying the distance factors of the other eight arcs and arclets and optimising the model, we estimate their redshifts. The error bars are estimated by the redshift interval within which the figure-of-merit increases by a factor of two from the minimum.
We find that the source redshifts obtained in this way for the best-fitting NFW and NIS models are similar. They are shown in the upper part of Table 2. Redshifts from spectroscopy, photometry and lensing estimates for the same sources obtained in earlier studies are listed in Column 4 where available. The table shows that the redshifts found here are consistent with the earlier results except for the arc pair (A1, A2), which is suggested to have a lensing redshift (Bézecourt et al 1999). According to our photometric data in 12 bands, we find that A1 and A2 are very blue (cf. Fig. 9) and are not detected by IRAC. In qualitative agreement with our lensing-based estimate, this suggests (A1, A2) are at lower redshift.
| arc | DF | , or | ref. | |
|---|---|---|---|---|
| A0 | 1.00 | – | 0.724 (s) | [1] |
| R | 1.460.10 | 1.310.12 | 1.312 (p) | [2] |
| 1.70.2 (l) | [3] | |||
| B2,3 | 1.100.09 | 0.800.09 | 0.806 (s) | [3] |
| A1,2 | 1.150.11 | 0.850.11 | 1.40.2 (l) | [3] |
| 1.2 (p) | [4] | |||
| A3,4 | 1.300.12 | 1.020.11 | 0.2 (p) | [4] |
| A5 | 1.460.06 | 1.300.12 | 1.306 (s) | [5] |
| B4 | 1.11 | 0.80 | – | – |
| C1,2,4 | 1.050.13 | 0.760.12 | 0.750.1 (l) | [3] |
| 0.60 - 0.92 (p) | [4] | |||
| D1,2 | 1.100.11 | 0.800.11 | 0.850.1 (l) | [3] |
| 0.4 (p) | [4] | |||
| E1,2,3 | 1.300.11 | 1.020.18 | 1.30.1 (l) | [3] |
| Z1 | 1.700.05 | 2.280.29 | – | – |
| Z2 | 0.950.14 | 0.690.10 | – | – |
| Z3 | 1.600.06 | 1.730.21 | – | – |
| Z4 | 0.950.15 | 0.690.11 | – | – |
| Z5 | 0.950.14 | 0.690.10 | – | – |
| Z6 | 1.000.11 | 0.720.09 | – | – |
| Z7 | 1.340.08 | 1.080.11 | – | – |
| Z8 | 1.340.08 | 1.080.11 | – | – |
| W2 | 1.340.08 | 1.080.11 | – | – |
DF: distance factor (Comerford et al 2006); : lens redshift; : spectroscopic redshift; : photometric redshift; (s): spectroscopy; (p): photometry; (l): lens.
Refs: [1] Soucail et al (1988); [2] Smail et al (1996); [3] Bézecourt et al (1999); [4] Kneib et al (1994); [5] Mellier et al (1991)
3.3. Further study of the arclets in A 370
The high-quality and deep images in eight bands from to taken by Subaru enable us to apply the best-fitting NFW lens model obtained in the preceding subsection to some arclets that were already found and labeled by Kneib et al (1993) and Bézecourt et al (1999), and to some new arclet candidates (labelled “Z”) in order to test whether the best-fitting model is consistent with them (see Fig. 9).
We thus apply the best-fitting NFW lens model obtained in the previous subsection to the arclet pair candidates labeled B, C, D and E by first optimising the model under the assumption of minimal source sizes, only using their redshifts as free parameters. The results of this fit for individual arclet pairs are shown in Fig. 14, and their estimated redshifts are listed in the middle part of Table 2.
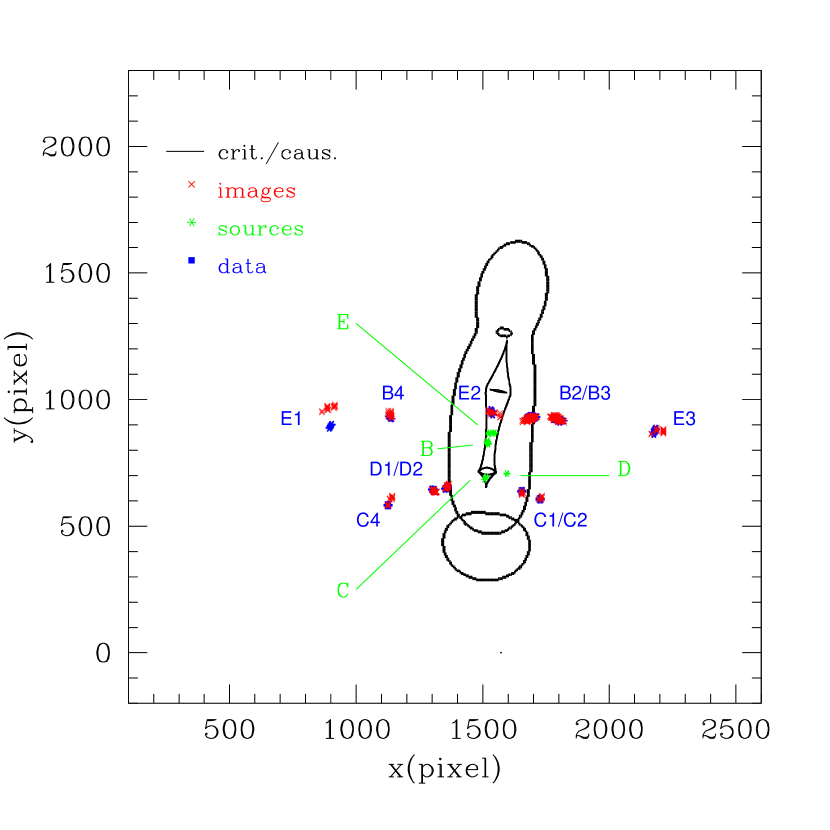
Figure 14 shows that the best-fitting NFW model can fairly reproduce the observed images of the arclet pairs B, C, and D. Note that the additional image produced by (B2, B3) in Fig. 11 matches well their possible counter image B4. Their estimated redshifts are consistent with previous photometric measurements. Small differences of the image positions between the model predictions and the observations for E3 in the right panel of the figure may arise because we ignore perturbations due to lensing by less luminous galaxies within A 370. Such differences in the image positions measured and reproduced by the model also occur for C4. For the pair (D1, D2), the model predicts an extra counter-image very close to D1 that is not clearly observed, possibly because the image was yet too faint to be seen.
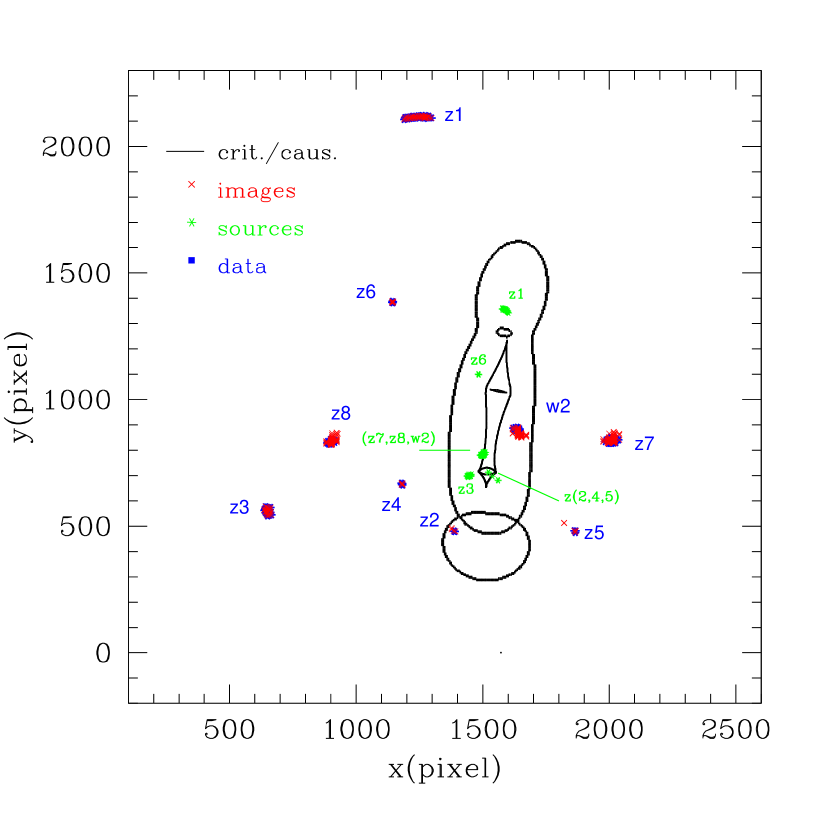
In addition to the arclet candidates labeled by Kneib et al (1993) and Bézecourt et al (1999), we identify new arclet candidates in the field of A 370 labeled “Z1” to “Z8” and shown in Fig. 9, with the measured ellipticities of individual objects larger than 0.6 in band by SExtractor (Bertin & Arnouts 1996) and checking by eye in the other bands. Similar to B, C, D and E, the best-fitting NFW model is also applied to them, taking their redshifts as free parameters. Best-fitting results for them are shown in Fig. 15 with the expected lensing redshifts for individual new arclets being listed in the final part of Table 2. A detailed study of their SEDs will be presented in a separate paper.
Based on these results for the new arclets, we suggest that Z6 may be a lensed galaxy at low redshift. Z2, Z4 and Z5 could be counter-images because their recovered sources are close to each other in the sky, and they have similar lensing redshifts. Although the predicted separations of the source positions between Z4 and Z2, and between Z4 and Z5 are possibly too large, this may be due to model uncertainties. Moreover, two candidates of distant objects, Z1 and Z3, are found with lensing redshifts of and , respectively, which need to be spectroscopically or photometrically confirmed.
Finally, the new candidates Z7 and Z8 are suggested to be counter-images of a source at redshift near 1.3. Based on the best-fitting NFW model, we also found their predicted counter image close to B2, labeled W2 in Figs. 15 and 9. Photometry confirms that it has the same colour as Z7 and Z8. We note that this newly found arclet pair had already been detected by Bernard Fort and collaborators several years ago, but remained unpublished (B. Fort, private communication). Like (B2, B3), these counter images are also very sensitive to the mass model of A 370. Since they are extremely red, the study of their SEDs in the next paper suggests that they arise from an active star-forming galaxy heavily enshrouded by dust.
4. Conclusions
Since it is virtually impossible to distinguish mass models with different density profiles for galaxy clusters based exclusively on the observed arc and arclet positions, which depend on the first derivative of the effective lensing potential, we have studied in detail the image magnifications expected from lens models assembled from components with isothermal and NFW density profiles. We considered both axially-symmetric and asymmetric models and conclude that the magnifications for different mass models can be substantially different. The ellipticity of a mass model must be taken into account because it plays an indispensable role in strong-lensing studies.
Given a lens model reproducing the position of a giant arc, its predicted magnification is usually smaller for singular than for non-singular isothermal profiles. Isothermal models with small cores predict magnifications smaller than models with NFW mass profiles. Isothermal mass models with large cores, whose density gradient in the inner region is nearly flat, predict magnifications increasing with the core radius and exceeding those for NFW density profiles. These effects are more pronounced for increasingly asymmetric models.
We illustrate our results with the two well-studied clusters MS 2137 and A 370, which we model using the code described by Comerford et al (2006). Comparing with previous studies, the main improvements in this paper are based on (1) the photometry for obtaining relative magnifications of individual counter-image pairs to constrain the lens models; and (2) further studies of additional arclets in A 370 including lens redshifts of newly found arclets.
The observational data were taken with Subaru, HST and Spitzer for A 370 and taken from Gavazzi et al (2003) for MS 2137. We find that both isothermal and NFW models can reproduce the observed arcs and arclet positions in MS 2137 and A 370, which is consistent with the results of Comerford et al (2006), Gavazzi (2005), Gavazzi et al (2003), Miralda-Escudé (2002, 1995), Bézecourt et al (1999), Mellier, Fort & Kneib (1993), and Kneib et al (1993).
Relative magnifications of individual arc and arclet pairs are adopted to adjust the mass model by comparing with observations. Since MS 2137 is a relatively simple, single-component system, it is hard to distinguish isothermal from NFW mass models. On the other hand, A 370 has two major lens components with several arc and arclet pairs, which allow us to adopt the relative magnifications of the confirmed arclet pairs to conclude that the NFW profile is more realistic than the isothermal profile for A 370.
The best-fitting NFW mass model for A 370 is applied to several arclet candidates found by Kneib et al (1993) and Bézecourt et al (1999) that were not used for constraining the mass model. We find that this best-fitting model can well reproduce the observed arclets.
The high-quality images of A 370 in twelve bands from to infrared will allow us to recover SEDs for individual sources in the field of A 370 in a forthcoming paper. We also find eight new arclet candidates, apply our best-fitting NFW lens model to them and show that we can reproduce their observed features fairly well. We obtain redshift estimates from lensing for individual arcs and arclets in A 370 that are consistent with spectroscopic and photometric results where available from earlier studies. Other redshift predictions from lensing need to be confirmed by future observations. Finally, we found a new arclet pair labeled Z7, Z8 and W2 and suggest that they arise from an active star-forming galaxy heavily enshrouded by dust.
References
- (1) Bartelmann, M., Meneghetti, M., 2004, A&A, 418, 413
- (2) Bartelmann, M., Meneghetti, M., Perrotta, F., Baccigalupi, C., Moscardini, L., 2003, A&A, 409, 449
- (3) Bartelmann, M., Huss, A., Colberg, J. M., Jenkins, A., Pearce, F. R., 1998, A&A, 330, 1
- (4) Bartelmann, M., 1996, A&A, 313, 697
- (5) Bertin, E., Arnouts, S., 1996, A&A,
- (6) Bézecourt, J., Kneib, J.-P., Soucail, G., Ebbels, T. M. D., 1999, A&A, 347, 21
- (7) Bolton, A. S., Burles, S., Koopmans, L. V. E., Treu, T., Moustakas, L., A., 2006, ApJ, 638, 703
- (8) Broadhurst, T., Benítez, N., Coe, D., Sharon, K., Zekser, K., White, R., Ford, H., et al, 2005, ApJ, 621, 53
- (9) Chary, R. -R., Stern, D., Eisenhardt, P., 2005, ApJ, 635, L5
- (10) Comerford, J. M., Meneghetti, M., Bartelmann, M., Schirmer, M., 2006, ApJ, 642, 39
- (11) Covone, G., Kneib, J. -P., Soucail, G., Richard, J., Jullo, E., Ebeling, H, 2006, A&A, 456, 409
- (12) Cowie, L. L., et al, 2008 in preparation
- (13) Dalal, N., Holder, G., 2004, ApJ, 609, 50
- (14) Ellis, R., Santos, M. R., Kneib, J. -P., Kuijken, K., 2001, ApJ, 560, L119
- (15) Fedeli, C., Bartelmann, M., Meneghetti, M., Moscardini, L., 2008, A&A submitted, preprint astro-ph/arXiv:0803.0656
- (16) Frye, B., L., Coe, D., Bowen, D. V., Benítez, N., Broadhurst, T., Guhathakurta, P., Illingworth, G., et al, 2007, ApJ, 665, 921
- (17) Gavazzi, R., 2005, A&A, 443, 793
- (18) Gavazzi, R., Fort, B., Mellier, Y., Pello, R., Dantel-Fort, M., 2003, A&A, 403, 11
- (19) Grossman, S., A., Narayan, R., 1988, ApJ, 324, L37
- (20) Halkola, A., Seitz, S., Pannella, M., 2006, MNRAS, 372, 1425
- (21) Hamana, T., Bartelmann, M., Yoshida, N., Pfrommer, C., 2005, MNRAS, 357, 1407
- (22) Hammer, F., 1991, ApJ, 383, 66
- (23) Hu, E. M., Cowie, L. L., McMahon, R. G., Capak, P., et al, 2002, ApJ, 568, 75
- (24) Kneib, J. -P., Ellis, R. S., Santos, M. R., Richard, J., 2004, ApJ, 607, 697
- (25) Kneib, J. -P., Hudelot, P., Ellis, R., Treu, T., Smith, G. P., Marshall, P., et al, 2003, ApJ, 598, 804
- (26) kneib, J. -P., Mathez, G., Fort, B., Mellier, Y., Soucail, G., Longaretti, P.-Y., 1994, A&A, 286, 701
- (27) Kneib, J.P., Mellier, Y., Fort, B., Mathez, G. 1993, A&A, 273, 367
- (28) Kovner, I., 1989, ApJ, 337, 621
- (29) Leonard, A., Goldberg, D. M., Haaga, J. L., Massey, R., 2007, ApJ, 666, L51
- (30) Li, G. -L., Mao, S., Jing, Y. P., Bartelmann, M., Kang, X., Meneghetti, M., 2005, ApJ, 635, 795
- (31) Limousin, M., Richard, J., Jullo, E., Kneib, J. -P., Fort, B., Soucail, G., et al, 2006, preprint(astro-ph/0612165)
- (32) Mellier, Y., Fort, B., Kneib, J. -P., 1993, ApJ, 407, 33
- (33) Mellier, Y., Fort, B., Soucail, G., Mathez, G., Cailloux, M., 1991, ApJ, 380, 334
- (34) Meneghetti, M., Jain, B., Bartelmann, M., Dolag, K., 2005a, MNRAS, 362, 1301
- (35) Meneghetti, M., Bartelmann, M., Dolag, K., Moscardini, L., Perrotta, F., Baccigalupi, C., Tormen, G., 2005b, A&A, 442, 413
- (36) Miradal-Escud, J., 1995, ApJ, 438, 514
- (37) Miradal-Escudé, J., 2002, ApJ, 564, 60
- (38) Navarro, J. F., Frenk, C. S., White, S. D. M., 1996, ApJ, 462, 563 (NFW)
- (39) Navarro, J. F., Frenk, C. S., White, S. D. M., 1997, ApJ, 490, 493 (NFW)
- (40) Ofek, E. O., Maoz, Dan., Rix, Hans-Walter, Kochanek, C. S.; Falco, E. E., 2006, ApJ, 641, 70
- (41) Puchwein, E., Bartelmann, M., Dolag, K., Meneghetti, M., 2005, A&A, 442, 405
- (42) Schimd, C., Tereno, I., Uzan, J. -P., Mellier, Y., van Waerbeke, L., Semboloni, E., Hoekstra, H., Fu, L., Riazuelo, A., 2006, preprint(astro-ph/0603158)
- (43) Smith, G. P., Kneib, J. -P., Smail, I., Mazzotta, P., Ebeling, H., Czoske, O., 2005, MNRAS, 359, 417
- (44) Smail, I., Dressler, A., Kneib, J. -P., Ellis, R., Couch, W. J., Sharples, R. M., Oemler, A. Jr., 1996, ApJ, 469, 508
- (45) Soucail, G., Fort, B., Mellier, Y., Picat, J. P., 1987, A&A, 187, L1
- (46) Soucail, G., Mellier, Y., Fort, B., Cailloux, M., 1988 A&AS, 73, 471
- (47) Tu, H., Linmonsin, M., Fort, B., Shu, C., et al, 2008, MNRAS accepted (astro-ph/0710.2246)
- (48) Wambsganss, J., Bode, P., Ostriker, J.P. 2004, ApJ, 606, L93
- (49) Zekser, K. C., White, R. L., Broadhurst, T. J., Benítez, N., Ford, H. C., Illingworth, G. D., et al., 2006, ApJ, 640, 639