Hydrodynamical simulations of Galactic fountains I: evolution of single fountains.
Abstract
The ejection of the gas out of the disk in late-type galaxies is related to star formation and is due mainly to Type II supernovae. In this paper we studied in detail the development of the Galactic fountains in order to understand their dynamical evolution and their influence in the redistribution of the freshly delivered metals over the disk. To this aim, we performed a number of 3D hydrodynamical radiative cooling simulations of the gas in the Milky Way where the whole Galaxy structure, the Galactic differential rotation and the supernovae explosions generated by a single OB association are considered. A typical fountain powered by 100 Type II supernovae may eject material up to kpc which than collapses back mostly in form of dense, cold clouds and filaments. The majority of the gas lifted up by the fountains falls back on the disk remaining within a radial distance kpc from the place where the fountain originated. This localized circulation of disk gas does not influence the radial chemical gradients on large scale, as required by the chemical models of the Milky Way which reproduce the metallicity distribution without invoking large fluxes of metals. Simulations of multiple fountains fuelled by Type II supernovae of different OB associations will be presented in a companion paper.
keywords:
1 Introduction
Deep H I observations and a detailed modelling of the H I in edge-on spiral galaxies as NGC 891 (Swaters et al., 1997; Oosterloo et al., 2007), UGC 7321 (Matthews & Wood, 2003) or partially inclined spiral galaxies as NGC 2403 (Schaap et al., 2000; Fraternali et al., 2002), NGC 4559 (Barbieri et al., 2005) have shown the presence of thick gaseous layers extending to several kiloparsec from the plane of the disk, with a mass of 1/10 of the total H I. Optical observations have also revealed extraplanar emission from diffuse ionised gas (DIG) (Ferguson et al., 1996; Hoopes et al., 1999) which, as the H I, extends to a large extent above the plane. The extraplanar gas (EPG) has peculiar kinematics that has been studied both for the neutral and the ionised component. The modelling of the H I layer has shown that the EPG rotates in the same direction as the disk, and has a mean rotation velocity about 20-50 km s-1 lower than that of the gas on the plane (e.g. Swaters et al., 1997; Fraternali et al., 2004). Similar results hold for the ionised component (Fraternali et al., 2004).
In general, the extraplanar gas appears to be regularly distributed over the whole galaxy, and its amount is related to the rate of star formation (Schaap et al., 2000; Dettmar, 2005, e.g.). This suggests that a significant fraction of the EPG has an internal origin, likely being disk ISM ejected in the halo by (clustered) supernova explosions.
The presence of giant holes in the H I disk of many galaxies as NGC 6946 (Boomsma et al., 2005), NGC 2403 (Fraternali et al., 2002), M33 (Deul & den Hartog, 1990), M 101 (Kamphuis et al., 1991), M31 (Brinks & Bajaja, 1986), and in the Milky Way by (Heiles, 1984) and (Koo et al., 1992) also point to an internal origin of the EPG. These holes can be hardly created by the competing scenario of infalling clouds (Comerón, 2004). Instead, they can easily accounted for by associations of O and B stars exploding in a correlated fashion and giving rise to superbubbles. In some cases vertical motions are associated with these holes, as expected once the superbubble breaks out of the disk (Mac Low et al., 1989; Koo & McKee, 1992), reinforcing the hypothesis that they are linked to galactic fountains.
The above arguments point at a substantial gas circulation between disk and halo. The ejection of the gas out of the disk is thought to be related to star formation in the disk and to be due mainly to Type II supernovae (SNe II). This process is usually described as galactic fountain (Shapiro & Field, 1976; Bregman, 1980; Kahn, 1981). In the simple version, the scenario assumes that gas heated by SNe explosions rises above the plane of the disk but remains bound to the galaxy. Then, the material will recirculate, falling backward to the galactic plane as cold gas, presumably concentrated in clouds formed through thermal instabilities. According to this model, the galactic fountain gas moves to larger galactocentric distances as it rises above the galactic plane, to conserve its angular momentum. This effect would account for the observed lower rotation velocity of the extraplanar gas. When the clouds form via thermal instability, they fall back toward the galactic plane and their radial distance from the centre decreases. From a simple analysis it can be shown that after about yr of its formation a cloud returns to the Galactic plane at a Galactocentric radius not very different from its initial value (Spitzer 1990). In the framework of a one-dimensional model Kahn & Brett (1993) showed analytically that, at the Sun distance from the Galactic centre, a cloud collide with the Galactic midplane at a distance of 850 pc from its initial position. In these admittedly idealized scenarios, one expects the early outflow phase to be mostly traced by ionised gas and the late inflow phase by neutral gas.
Despite the arguments reckoned above for an internal origin of most extraplanar gas, a scenario in which the halo cold and warm gas is accreted from the intergalactic medium is not ruled out (e.g. Blitz et al., 1999). In fact, the above analysis could be reversed to conclude that a higher star formation rate might be the final result of accretion rather than the cause at the origin of the EPG. Indeed, extended infall of external gas on galactic disks is needed in current galactic evolution models as a way to maintain star formation rates similar to the observed present ones in normal spirals (e.g. Takeuchi & Hirashita, 2000; Semelin & Combes, 2002), as well as to explain the observed patterns in the chemical evolution of the Milky Way (Chiappini, 2002; Geiss et al., 2002). The observational counterpart of this gas accretion might be the high velocity clouds (HVCs) observed in our and other galaxies (Wakker, 2001, 2004). However, the ability of these clouds to provide the needed amount of gas at low metallicity, as well as their capability to trigger star formation is still unclear. Evidence for star formation induced by HVC impacts on galactic disks is unclear, while numerical simulations seem to indicate that infall-induced star formation is substantially prevented (Comerón, 2004, and references therein).
The galactic fountain scenario can also explain the diffuse soft ( 1 keV) X-ray emission that has been detected in some spiral galaxies like M101 (Snowden & Pietsch, 1995), M51 (Ehle et al., 1995), M33 (Long et al., 1996), NGC 891 (Bregman & Houck, 1997), NGC 4631 (Wang et al., 2001), NGC 2403 (Fraternali et al., 2002), NGC 3556 (Wang et al., 2003), and NGC 2613 (Li et al., 2006) (for a short review see Wang (2007)). This hot gas does not extend significantly more than 10 kpc away from the galactic disks, and appears to have substantial substructures which are best appreciated in disk galaxies that are moderately inclined. In NGC 2841 the diffuse X-ray emission arises primarily from the inner galactic disk, and its morphology is the result of various hot plumes sticking out of the disk and into the halo of the galaxy (Wang, 2007). These X-ray emitting plumes extend vertically up to a few kiloparsecs and are most likely blown out hot gas heated in massive star forming regions in the disk. This conclusion is reinforced by the observation that the X-ray luminosity correlates with the star formation rate and that the hot gas seems oxygen rich, a signature of SNII enrichment.
From all the above, it turns out the fountains may be crucial in characterizing X-ray, as well as H I and H emissions in normal spiral galaxies. Moreover galactic fountains could also play a role in the chemical evolution of spiral galaxies, especially in shaping the abundance gradients in the disk. In principle the fountains might be able to move SN II ejecta relatively far from the place where they have been produced, affecting the gradients of -elements such as Mg and O.
The richness of phenomena involved in the galactic fountains can be hardly taken into account by the simple scenario outlined above (Shapiro & Field, 1976; Bregman, 1980; Kahn, 1981). Nearly twenty years after these three seminal papers, however, the advent of powerful computers made possible to simulate the fountains rather accurately.
In fact, extensive work on superbubble/chimneys and fountains formation and on their effects upon the interstellar medium in the disk and the halo has been performed over the last decades (e.g. Tomisaka & Ikeuchi, 1986; Norman & Ikeuchi, 1989; Mac Low & McCray, 1988; Mac Low et al., 1989; Houck & Bregman, 1990; Korpi et al., 1999) most of which has shown 2D and 3D simulations considering the evolution of bubbles and superbubbles both in unmagnetized and magnetized media. In particular, Tenorio-Tagle & Bodenheimer (1988) and Norman & Ikeuchi (1989) (see also Tomisaka & Ikeuchi, 1986; Mac Low et al., 1989), were the first to explore the role that superbubles and chimneys physically connected to underlying OB associations in the disk play on the fountains evolution in galaxies. Houck & Bregman (1990) borrowig concepts from earlier works, investigated the physical conditions for the formation of subsonic and transonic fountains as a function of the radiative cooling time.
More recently, de Avillez (2000) and de Avillez & Berry (2001) performed a number of 3D hydrodynamical simulations of the gas in the Milky Way in order to account for the collective effects of supernovae on the structure of the interstellar medium (ISM). In order to obtain a high spatial resolution, only a small region of the Galaxy has been considered by the authors; the simulated volume has an area of 1 kpc2 and a vertical extension varying between 4 and 10 kpc. The gas in this volume is initially assumed to be plane parallel stratified, and any dependence of the variables on the Galactocentric distance is neglected. The general structure of the ISM is reproduced, with a thin H I disk overlaid by thick H I and H II gas disk. This structure is essentially given by SNe II isolated or assembled in small clusters. The gas powered by SNe II associated in larger clusters reaches larger heights, where it cools forming clouds which eventually descend. Intermediate velocity clouds (IVCs) form preferentially in the range kpc whereas HVCs (10% of total number of clouds) form at larger heights.
Three-dimensional simulations have been reported also by Korpi et al. (1999) who include the galactic magnetic field in the disk and the Galactic differential rotation, but the vertical extension of the simulated volume was 1 kpc, covering an area of 500 by 500 pc2 with a resolution of 8 pc. The lack of an extended grid made the development of a disk-halo-disk cycle impossible, because part of the mass is lost through the grid boundaries. MHD simulations were carried out also by de Avillez & Breitschwerdt (2005), without including differential rotation, where again in order to reach very high resolution (of 0.6 pc) they have considered only a small volume of the Galaxy. These MHD studies have revealed that the gas transport into the halo is not prevented by the parallel magnetic field of the Galaxy, but only delayed by few tens of Myr when compared to pure HD simulations.
Fraternali & Binney (2006) followed a different strategy. They considered the whole Galaxy, and calculated orbits of gas clouds depicted as bullets that are ejected (by SNe II) from the disk and then move ballistically up into the halo and back down to the disk. Hydrodynamical effects are essentially neglected in these models.
In this paper we would like to study the motion of the gas on large scales in order to understand the observed kinematic of the EPG and the possible influence in shaping the metallicity gradient in the disk. To this aim, we need different kind of simulations with respect to the aforementioned papers (Korpi et al., 1999; de Avillez, 2000; de Avillez & Berry, 2001). In fact, although Korpi et al. (1999) take into account the Galactic rotation, the simulated volume is to small to follow the gas circulation over large distances. The volumes considered by de Avillez (2000) and de Avillez & Berry (2001) are larger, but in this case the rotation is neglected and any radial dependence is absent. On the other hand, Fraternali & Binney (2006) take into account the whole Galaxy, but their approach is purely ballistic. Our approach is to consider the whole Galaxy and run 3D hydrodynamical simulations of the fountains. While the numerical grid used here includes the whole rotating Galaxy, our adaptive mesh scheme allow us to follow in detail only a limited volume of it, the remaining galactic volume being mapped at a lower resolution. Although a detailed description of the different phases of the ISM is hampered by this limited resolution, the large scale dynamic and thermal evolution of the fountains can be satisfactorily followed. Here we present simulations of single fountains, i.e. generated by a single OB association. We shall describe simulations of multiple fountains in a companion paper.
2 the model
2.1 Galaxy model
The ISM in our model is made up of three components, namely molecular (H2), neutral (H I) and ionized (H II) hydrogen. Following Wolfire et al. (2003), each density component in the disk is assumed to be of the form:
| (1) |
where is the cylindrical radius, is the vertical scale height and is the radial scale length of the disk. The parameter allows for the depression in the gas density observed in the inner several kiloparsecs of the Galaxy. represents the superficial density of the different components. The values of the parameters are summarized in Table 1.
The ISM is initially set in rotational equilibrium in the Galactic gravitational potential given by the summation of dark matter halo, bulge and disk contributions.
The dark matter halo gravitational potential is assumed to follow the Navarro, Frenk and White profile (Navarro et al., 1996)
| (2) |
where is a reference density, is a scale radius, and is the spherical radius. The halo is truncated at a radius beyond which its potential follows the profile. See Table 2 for the numerical values of these parameters.
The bulge gravitational potential is given by (Hernquist, 1990):
| (3) |
where is a scale radius and is the bulge mass.
Finally, the gravitational potential of the disk is assumed to be generated by a stellar distribution following a flattened King profile
| (4) |
Here is the central density of the stars, and and are the core radii, whose ratio is In order to avoid an unbounded growth of the stellar mass with radius the stellar profile is truncated wherever , with and tidal lengths whose ratio is . The stellar potential is computed numerically following the method described in Brighenti & Mathews (1996).
Table 2 gives the values of all the parameters concerning the Galaxy model. With such values we obtain M⊙, M⊙ and M⊙ for the dark matter halo, the bulge and the stellar disk, respectively.
In order to set the ISM given by Eq. 1 in a rotating configuration in equilibrium in the general potential well of the Galaxy, we proceed as follows. The pressure at any point is found integrating the -component of the hydrostatic equilibrium equation for any value of the disk radius . The integration starts at the outermost values of (where we can assume the pressure ) and proceeds inward to reach the galactic plane .
We then obtain the rotation velocity from
| (5) |
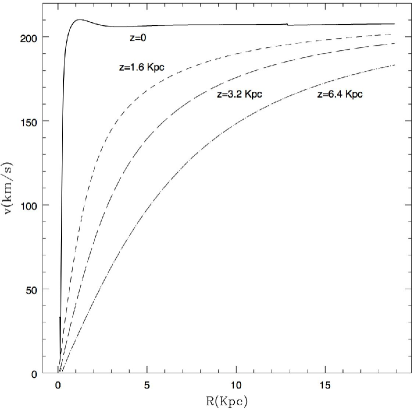
where is the circular velocity, and is the total potential of the Galaxy: . The values obtained in this way mimic quite well the rotation curve of the Galactic disk (c.f. Fig. 1).
| Components | pc-2 | kpc | kpc | pc |
|---|---|---|---|---|
| H I ( kpc) | 7.94 | 1.0 | 1000 | 178 |
| H I ( kpc) | 571 | 10 | 4.0 | 324 |
| H2 | 57.5 | 3.3 | 2.89 | 63.4 |
| H II | 1.39 | 0 | 30.0 | 880 |
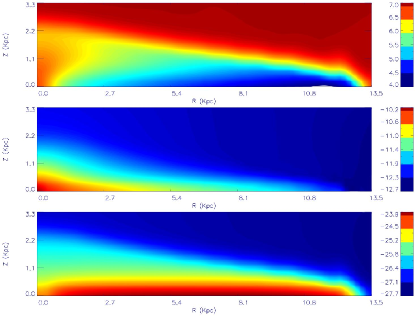
As shown in Fig. 2, that contains the temperature, pressure and density distributions of the Galaxy, the gas has a temperature always greater than K. This comes from two conditions. On one hand, from the necessity to hold in equilibrium the disk gas distribution against gravity, as given by Wolfire et al. (2003). On the other hand, and more important, it is due to the assumption that H I has a smooth (rather than a clumpy) distribution, so that a thermal, rather than a turbulent, pressure is required to balance gravity.
In most models a hot ( K) isothermal gas halo is added which is in equilibrium with the Galactic potential well:
| (6) |
Here g cm-3 is the halo central density, and is its isothermal sound speed. In some models the hot halo is allowed to rotate with velocity , where is an arbitrary parameter with values in the range . In the models where the halo is present, the disk density is replaced by the hot halo density wherever the halo pressure is larger than the pressure of the disk. When this halo is included, the initial pressure values which are needed to integrate the -component of the hydrostatic equilibrium equation (see above) are given by the halo pressure at the -boundary.
2.2 Supernovae explosions
It is known that the great majority of the massive stars form in clusters (e.g. Ward-Thompson, 2002, and references therein). In the following, we define “single fountain” as a fountain powered by the SNe II present in a localized single cluster (for the sake of simplicity, with SNe II we mean here all the explosions due to core collapsed stars, i.e. genuine SNe II, SNe Ib and SNe Ic). At the observed rate of yr (Cappellaro et al., 1997), several single fountains may occur sufficiently close to each other in time and space to interact mutually. This interaction obviously modifies the general dynamics of the SN II ejecta of a single fountain. In order to understand the effect of different factors (such as the Galactocentric distance, the presence of a gaseous halo, the rotation velocity of this halo), and how these effects are influenced by the interaction among several fountains, we have computed two classes of models differing only in the assumed number of stellar associations, i.e., single fountain models (SFMs) and multiple fountains models (MFMs). Here we focus on the first class of models, while the latter will be discussed in a forthcoming paper.
2.2.1 Single association
In the case of a SFM, we assume that the OB association is located on the Galactic plane (), and is totally housed inside a single mesh of the highest resolution level of our adaptive grid (cf. sect. 3). The SNe II do not explode all at the same time because of the different masses of their progenitors. Thus the energy and the mass delivered by all the explosions are released over a time interval =30 Myr (the lifetime of an 8 star, which is the least massive SN II ancestor). We inject the explosion energy in the form of thermal energy at a rate , where erg is the energy of a single explosion, is the SN II rate, and is the total number of SN II explosions occurring in the association. The mass of the SN II ejecta is injected at a rate , where is the mean mass expelled by a single SN II explosion. As a result, we do not consider a sequel of instantaneous explosions but, instead, a wind inflating a bubble with a mechanical luminosity . This treatment is supported by the findings of Mac Low & McCray (1988) who showed that discrete explosions can be approximated as continuous events when more than SNe come one after the other. About the temporal wind evolution, Leitherer et al. (1999) showed that SNe belonging to an istantaneous burst release mass and energy at rates oscillating around a mean value; the general properties of the fountain we are looking for depend on such mean values rather than on the oscillations. We thus assumed constant values of and , as described above.
As the bubble expands, the swept up ISM is compressed in a dense radiative shell edging the bubble itself. The interior of the bubble, instead, is filled by the hot, low density ejecta (c.f. Weaver et al., 1977). The bubble expands faster in the direction perpendicular to the plane, because the density decreases more steeply in that direction. If the density gradient is strong enough, the shell can accelerate. The acceleration of the shell causes it to be disrupted by the Rayleigh-Tailor instability, and the hot gas inside the bubble subsequently leaks out and drives a new shock into the ambient medium, giving rise to the galactic fountain. The break out is expected to occur when , where the critical luminosity is given by (c.f. Koo & McKee, 1992).
| (7) |
Here cm-3 K), where is the midplane pressure, and is the Boltzman’s constant. cm s-1), where represents the sound speed in the midplane; actually, as the temperature varies somewhat within the range , we adopt the mean value of in Eq. 7. Finally, the effective scale heigh of the ISM at the Galactocentric distance is defined as
| (8) |
All the SFMs we run have the same number supernova explosions. This number has been chosen because typical for Galactic OB associations (Higdon & Lingenfelter, 2005, see also Paper II). Furthermore, such a number assures the realization of the break out at any location of the fountain on the disk (cf. sect. 5.1).
It is worthwhile to note that our numerical grid is at rest in space, while the Galaxy rotates. Thus, the OB association moves around describing a circle on the plane. In order to properly locate the energy and mass source in the grid, we compute separately the trajectory of the association, and at each time we put an appropriate amount of thermal energy and mass in the smallest cell of our multilevel grid (see below) transited by the association at that time.
| g cm-3 | g cm-3 | kpc | kpc | kpc | kpc | kpc | kpc | kpc | |
| 0.29 | 120 | 3.5 | 30.8 | 347.7 | 0.8 | 20 | 1.2 | 0.6 | 0.036 |
3 The numerical method
In our simulations we have used a modified version of the adaptive mesh refinement YGUAZU code. This code integrates the 3D inviscid gasdynamic equations (expressed in Cartesian coordinates) with the flux vector splitting algorithm of van Leer (1982). Radiative losses are computed through a non-equilibrium ionization (NEI) calculation including a set of continuity equations for atomic/ionic or chemical species; in the present simulations solar abundances (Asplund et al., 2005) are assumed. The details of the gasdynamic and the adaptive grid algorithms have been presented by Raga et al. (2000) and Raga et al. (2002), and tests of the code, as well as, several physical applications can be found in Raga et al. (2002), Masciadri et al. (2002), González et al. (2004) and Melioli et al. (2005). When compared with other methods, this particular scheme has a reasonable performance (as far as diffusion is concerned) when one considers, e.g., 1D test problems (see, e.g., van Albada et al. (1982); Woodward & Colella (1984)). Artificial viscosity is set to zero in all our simulations. As discussed in the previous Section, at any time the mass and energy source terms due to the SNe are absent everywhere but in the cell hosting the OB association.
The 3D binary, hierarchical computational grid is structured with a base grid, and with a number of nested grids whose resolution doubles going from one level to the next one. In our most refined simulations, we have adopted six grid levels (with the linear size of the meshes of the most refined grid being 13 pc) covering a box with physical dimensions of kpc. The grid being adaptive, in principle the maximum resolution should be set at the boundary between the hot halo and the disk, where the density gradient (along the direction) is very steep. This, however, would represent an useless waste of cpu time because we are interested in describing in particular the fountain which evolves in the selected area of the disk. We thus enforce the maximum grid resolution only in this area and in the volume above it, even if the density gradients in the halo are mild. In fact, we want to follow the circulation and the thermal history (i.e. the degree of radiative cooling) of the metals expelled by the SNe II, as carefully as possible. For this reason we have added three different tracers passively advected by the code describing the disk gas, the halo gas and the SN II ejecta. In this way, we can distinguish the evolutive history of each gas component and understand their degree of mixing, as the fountain evolves.
Given the symmetry of the problem, our computational volume encompasses only the “upper” half of the Galaxy. We thus have outflow boundary conditions everywhere but at “the bottom” (i.e. the plane) where reflecting boundaries are enforced.
4 The reference model RM
In this section we discuss extensively the properties of the RM, which we take as a reference model. In this model the gaseous halo is present but does not rotate, and the OB association is located at the galactocentric distance kpc. At this radius the transition between the disk and the hot halo occurs at pc. The critical luminosity is erg s-1, well below the mechanical luminosity erg s-1 provided by the 100 SNe II powering the fountain. This model has been run with a maximum spatial resolution of 13 pc.
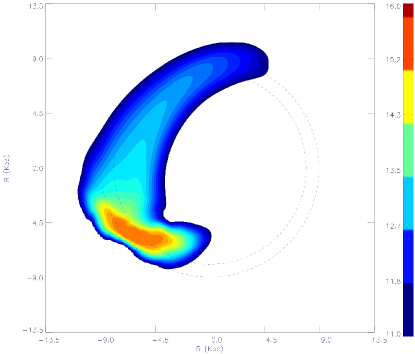
In Fig. 3, we show the face-on column density of the SN II ejecta after Myr. During its activity the fountain digs a hole on the disk, and throws SN II ejecta and ISM vertically up to kpc above the galactic plane. Once the stellar explosions cease, the hole collapses in yr and the ejecta trapped at its edges (nearly half of the total, see below) mixes with the local ISM. Owing to the differential rotation of the Galactic disk, the ejecta does not remain confined in one point, but is stretched, giving rise to the bean-like structure seen in Fig. 3. The low density “tail” with a banana-shape is given by the ejecta pushed at high altitude which then slowly falls back lasting above the disk.
The two concentric circles in Fig. 3 with radii kpc and kpc, have been drawn to guide the eye. The SNe II explode between these two circles, and their distance corresponds to the diameter of the hole produced by the fountain. Comparing the shape of the tail traced by the ejecta with the circles, we note that the gas of the fountain tends to move inward during its trajectory, rather than outward, as one could expect, at least initially (cf. section 1). Actually, as the gas moves upward and interacts with the halo, it transfers to it part of its angular momentum; the centrifugal force decreases in pace with the circular velocity and the centripetal component of the gravity prevails, pushing the gas toward the Galactic centre.
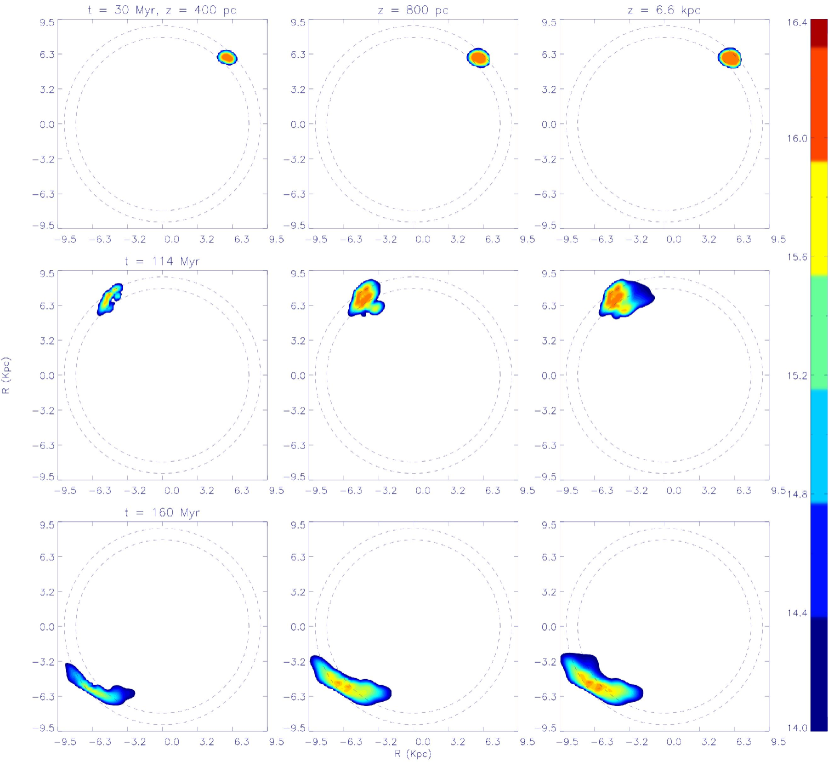
To better illustrate the fountain evolution, we show in Fig. 4 a sort of tomography of the fountain itself. Each single row in this figure represents the column density of the ejecta up to =400 pc (left panel), =800 pc (central panel), and 6.6 kpc (right panel); the upper, middle and lower rows refer to 30 Myr, =114 Myr and =160 Myr, respectively. From the first row, we see that, initially the gas pushed by the fountain rises quite vertically forming a column whose base has a size comparable to the distance between the two circles. In the remaining panels the progressive “stretching” of the ejecta is evident, as well as the formation of the “cometary” tail at high values of and its tendency to bend toward the Galactic centre.
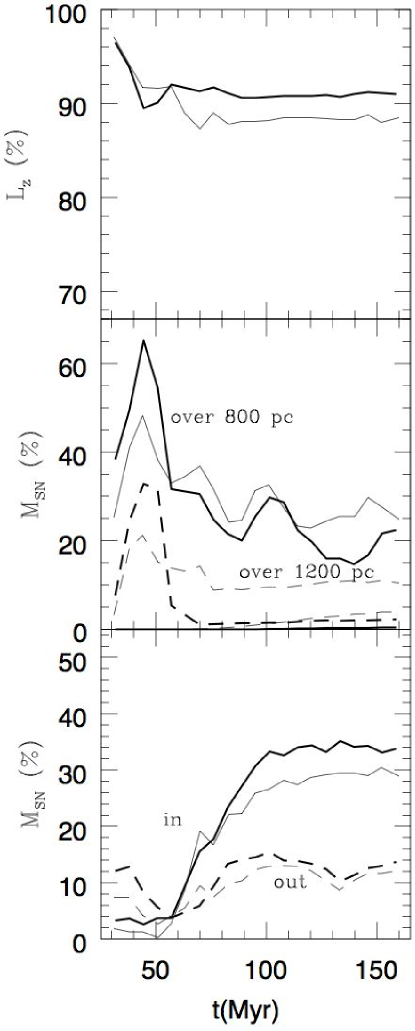
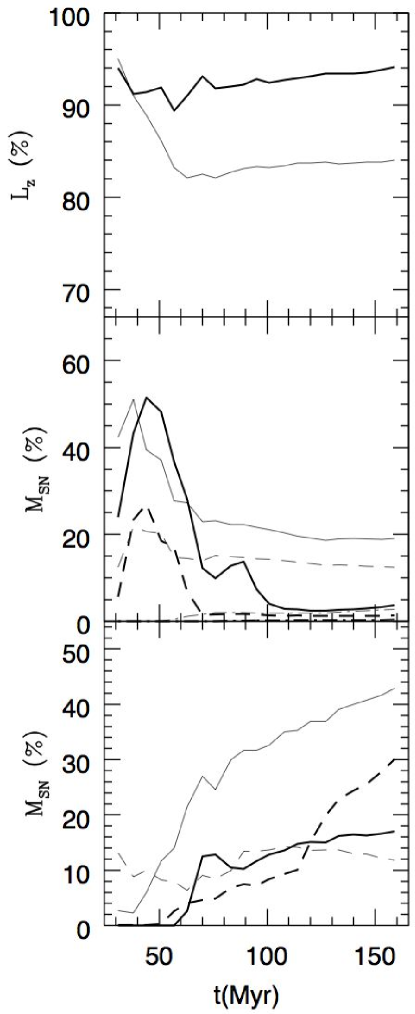
A further insight on the evolution of the galactic fountain is obtained from Fig. 5. The three panels illustrate the evolution of several quantities starting from =30 Myr, the time at which the SNe II stop to explode. The upper panel shows how quickly the ejecta loses its angular momentum because of the interaction with the gaseous halo. After 80 Myr nearly 10% of the angular momentum of the fountain has been transferred to the hot halo; later on, no further transfer occurs because nearly 75% fraction of the ejecta is located below the disk-halo transition and rotates toghether with the ISM 111The transfer of angular momentum is evaluated comparing the angular momentum of the ejecta within the grid with the original angular momentum held by the ejecta at the moment of its injection within the grid.. This is illustrated by the middle panel of Fig. 5 showing the amount of the ejecta mass fraction located above different heights. It is interesting to note that, apart for some fluctuations, for 80 Myr, the long-term evolution of these quantities becomes very slow. This is due to the fact that most of the ejecta situated above the plane is rather diluted, and tends to float together with the extra-planar ISM. Finally, in the lower panel of Fig. 5 we quantify the tendency of the ejecta to move radially by plotting the fraction of the total mass of ejecta located at 9 kpc and 8 kpc (i.e. the radii of the two circles drawn in Figs. 3 and 4); the amount of mass located within the region kpc is not taken into account. In the beginning the ejecta starts to follow the expected tendency to move outward but, as the loss of angular momentum proceeds, the fraction of gas moving inward increases and after 60 Myr overrides that directed outward. The amount of the outer mass remains always very low and does not evolve very much; on the contrary, in the inner region the mass of the ejecta keeps increasing during almost all the period of the simulation.
In Fig. 5 are also shown results obtained with a coarser spatial resolution (of the finest grid) of 26 pc. Actually, in order to test the convergence of our simulations, we have run simulations with different higher refinement level resolution: 52, 26 and 13 pc. The gross features of the hydrodynamical evolution of the fountain over the whole gas cycle do not change significantly and are captured even in the coarser case. We notice that in the coarser case there is a slightly larger deposition of material at higher latitudes (10% larger) than in the higher resolution case due to smaller radiative cooling. As a consequence, the coarser case has also a slightly larger loss of angular momentum, however the overall behavior of the fountain evolution is found to be very similar in both cases and does not affect the main conclusions of the present work.
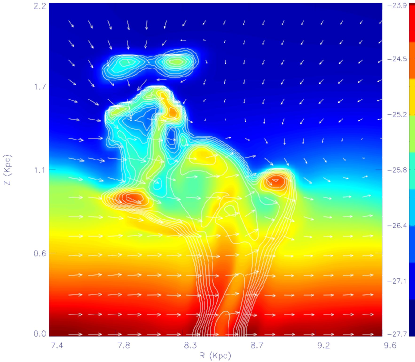
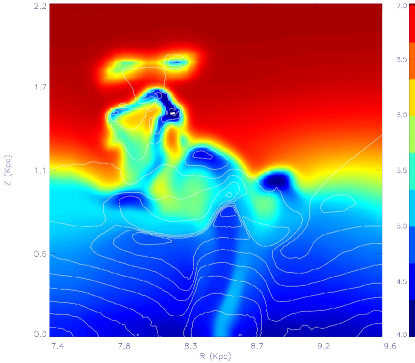
The gas lifted up by the fountain has a mass , almost all (92%) condensed into dense filaments cooled to K, the minimum allowed temperature (see Fig. 6 and Fig. 7). The clouds form via thermal instabilities at kpc once the ascending gas has inverted its motion and moves back toward the disk. In fact, the clouds have all negative -velocities in the range 50-100 km s-1. We point out that the clouds in our simulations cannot form by the hot wind gas powered by the SNe II. In fact, the sound crossing time of this gas is shorter than the cooling time, and cold condensations are prevented (Houck & Bregman, 1990). Instead, the clouds originate by the compression and cooling of the disk gas lifted by the fountain.
The chemical composition of these clouds is practically unaffected by the SN II ejecta. The fountain is powered by 100 SNe II, half of them exploding in the half space mapped by the grid; as each supernova delivers on average 3 of metals (cf. Marcolini et al., 2007), a total mass of 150 of heavy elements is ejected by the fountain within the computational domain. At Myr, when the lifted ISM reaches the maximum height, 50% of these metals results trapped within the disk, while 30% remains diffuse floating over the disk as hot, diffuse gas and only % is locked in the clouds. As a result, the metallicity increment in the clouds due to the freshly delivered metals corresponds to in solar units, negligible compared to the solar abundance of the ISM. As we will show in a forthcoming paper, this result also holds in models with multiple SN II associations. In conclusion, almost all the gas lifted up by the fountain condense into clouds without being chemically affected. After 150 Myr 45% of the fresh metals stays “on the disk” (below pc) within a radial distance of kpc from the OB association. A further fraction of 35% is found on the disk within the range 9.57 kpc. The remaining 20% of metals is still over the disk, half of it at kpc and half at kpc. (cf. Fig. 3 and Fig. 4).
5 Changing the parameters
In this section, we illustrate the differences among the results obtained with our reference model and those taking different parameters, the aim being to understand the role played by these parameters in the evolution of a galactic fountain. In order to obtain a relatively large number of models, we have run them adopting a spatial resolution for the finest grid (26 pc) which was worse than that adopted for the reference model (13 pc). This latter model was also run with this coarser grid in order to make homogeneous comparisons.
Although the results depend on the adopted spatial resolution, several general characteristics of RM are not greatly affected by the minimum mesh-size adopted, as shown in the top and bottom panels of Fig. 5. In the middle panel, instead, we note that the peaks present at Myr are higher, while the successive “plateau” are lower, the difference being grater for the dashed lines. The higher peaks are due to the smaller volume from which the SN II energy is delivered: in the finer grid the same energy is in a smaller volume and the resulting pressure pushing the gas is larger. The lower plateau derives by the improved resolution with which the clouds are followed by the finer grid: in this case, in fact, clouds are smaller and denser, and can fall faster toward the disk. These differences, however, will not influence the relative comparison below among models.
5.1 Varing the Galactocentric distance
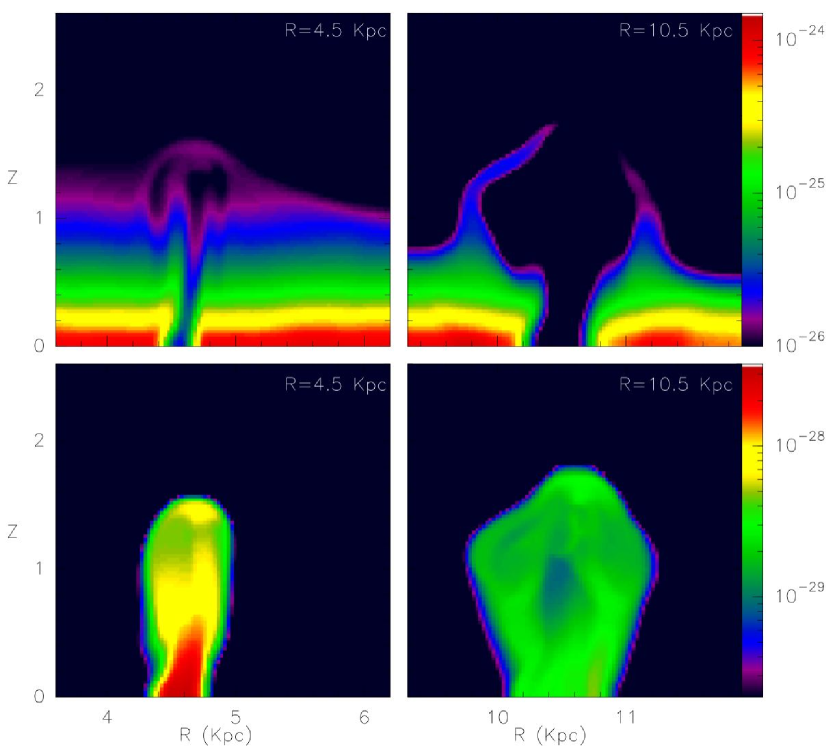
In this section, we explore the influence of the galactocentric distance on the fountain dynamics. In particular, we run two models similar to RM, but located at kpc (the inner fountain) and kpc (the outer fountain). At these distances, the corresponding critical luminosities (cf. sect. 2.2.1) are erg s-1 and erg s-1, respectively (the general dependence of the critical luminosity on the Galactocentric distance is given in Fig. 9).

Figure 8 illustrates the cavities carved into the ISM by these two fountains (upper panels), as well as the ejecta distribution, at Myr. Both “chimneys” show a tendency to bend toward larger because of the Galactic rotation. While the outer fountain experiences a well defined break out, the inner fountain barely crosses the disk-halo transition because is larger at kpc. The differences of the effective scale heights, together with the differences of , are also responsible for the different shapes of the two fountains. Following Koo & McKee (1992), it is
| (9) |
where is the Mach number of the wind relative to the ambient medium, and is the radius of the reflected shock (cf. Weaver et al. (1977)); the contact discontinuity separating the shocked wind from the ambient medium is at somewhat larger radius. If is greater than unity, than it is possible for the wind to escape freely along the vertical axis without being well collimated. If instead a collimated jet may form. This is actually the case for the inner fountain where, for , , while holds for the outer fountain.
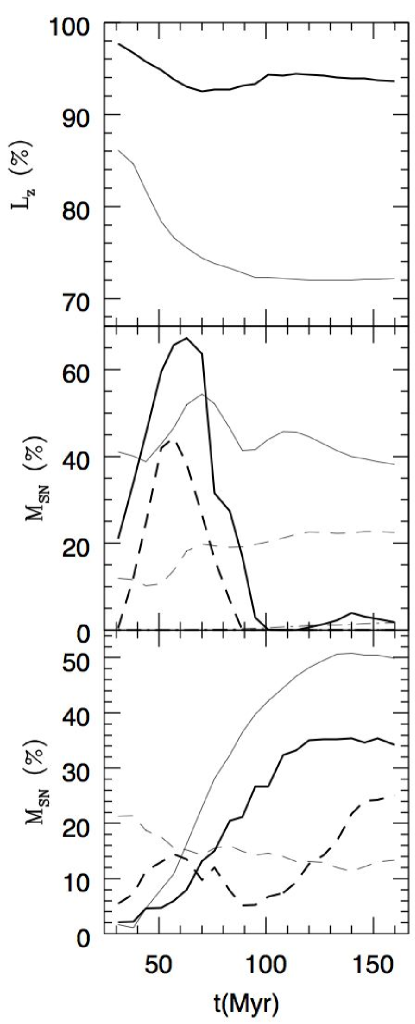
More insight on the two fountains is given by Fig. 10. The upper panel shows the evolution of the angular momentum of the SN II ejecta of the two fountains. The loss of angular momentum clearly increases with increasing values of . To understand this behaviour we must consider the different ambient medium in which the fountains evolve and the different circulation of their ejecta. This is summarized in the second panel of Fig. 10. Up to 60 Myr all the fountains push the gas essentially to the same heights (cf. also the middle panels of Fig. 5) despite the different values of . The disk-halo transitions at kpc and kpc occur at kpc and kpc, respectively. This means that most of the ejecta of the inner fountain never reaches the hot halo, while the opposite is true for the outer fountain (Fig. 8).
Once the expanding phase of the evolution ceases, the ejecta of the inner fountain falls back almost entirely to the midplane under the action of the surrounding pressure of the disk. In the case of the outer fountain, instead, the fraction of the ejecta that reached the hot halo falls back rather slowly, and ”fluctuates” above the disk as in RM.
As anticipated above, the different dynamical behaviour of the ejecta influences its loss of angular momentum. In the case of the inner fountain, the ejecta does not interact substantially with the hot halo and suffers only a small reduction of its angular momentum; moreover, as the ejecta is pushed back to the midplane, it is dragged by the disk and its angular momentum increases. Besides the fact that the ejecta of the outer fountain emerges from the disk with a larger angular momentum (per unit mass), it also loses a larger amount of it because its interaction with the hot gaseous halo lasts longer and involves a larger fraction of its mass.
Finally, the bottom panel of Fig. 10 illustrates how the amounts of ejecta moving inward and outward (relative to the fountain position) change with . After 150 Myr the fraction of ejecta moving inward amounts to 20%, 30% and 40% at kpc, kpc and kpc, respectively (cf. also the thin lines in the middle panel of Fig. 5). Thus, this quantity increases with , in pace with the loss of angular momentum. The fraction of the ejecta moving outward, instead, is lower and is about the same ( 10%) for RM and the outer fountain, but it is comparatively larger for the inner fountain, as this one is losing less angular momentum.
5.2 The influence of the gaseous halo
In the previous sections we have seen how the gaseous halo influences the circulation of the fountain gas. In this section we compare the standard model with an analogous one where the halo is missing. This does not mean that extraplanar gas is absent; actually, the density of the ISM decreases along the direction following Eq. 1 and its circular velocity depends on , as illustrated in Fig. 1.
As shown in the upper and middle panels of Fig. 11, in this model the loss of angular momentum by the ejecta is reduced compared to RM (Fig. 5), although a larger amount of the fountain gas is lifted up. In fact, the absence of the coronal gas favours the rise of the fountain, but the ejecta interacts with an ambient medium which is also rotating (although at a lower rate than that of the midplane), and the transfer of angular momentum is limited. The ambient gas density at large is now higher than in the presence of the hot halo. Radiative losses are thus facilitated, and the ejecta does not loiter above the disk, as in SMF1, but returns entirely back to it at later times (cf. the middle panel of Fig. 11). This explains why, despite a lower loss of angular momentum, a larger fraction of ejecta moves inward compared to RM (bottom panel). In fact, on the disk the centripetal force is larger; as more angular momentum deficient gas falls on it, a larger amount of ejecta move inward. Likewise, the fraction of ejecta moving outward increases compared to RM due to the lower loss of angular momentum that facilitates the spreading of the material outward the injection region.
In conclusion, a smaller amount of gas (40%) remains within kpc compared to RM because a larger fraction of it moves both outward and inward.
5.3 Neglecting the neutral hydrogen
It is known that the neutral hydrogen distribution is rather clumpy (e.g. Wolfire et al., 2003), instead of smooth, as we have assumed (cf. Eq. 1). Actually, such an assumption is necessary because an unrealistic grid resolution would be needed in order to resolve spatially the H I clouds. One can expect that the leading shock wave of the bubble/fountain moving through a realistic ISM would advance faster, because most of the volume is filled by the rarefied H II gas which allows higher shock velocities, as well as lower post-shock radiative losses. To evaluate how our assumption on the H I distribution influences our results, we have run a model similar to the reference one, but where H I is absent; this is a rather extreme assumption, but allows us to establish an upper limit value on the heights reached by the fountain.
Actually, after 150 Myr the amount of the ejecta above 800 pc and above 1200 pc in the model without H I is almost doubled compared to RM (cf. the second panel of Fig. 11). This is not a consequence of larger heights reached by the ejecta, because it actually attains approximately the same altitudes as in RM. In fact, we find that the lifted ejecta does not fall back and remains essentially at the height reached initially; at larger values of the amount of ejecta even tends to increase with time. This behaviour is due to the decrease of the radiative losses as a consequence of the lower density of the ambient medium: the hot ejecta does not cool and tends to keep moving upward by buoyancy.
As a larger fraction of ejecta interacts longer with the hot halo compared to RM, the loss of angular momentum is also larger, as well as the amount of ejecta moving inward (cf. the first and third panels of Figs. 5 and 11; this mechanism is substantially similar to that discussed in section 5.1 with regard to the model with kpc.
In conclusion, in the absence of H I, 40% of the ejecta mass remains above pc, and less than 40% is found within kpc (characterizing a larger spreading).
5.4 The role of rotation
Previous authors (e.g. de Avillez, 2000) have investigated numerically the mechanism of the galactic fountains, focussing only on a restricted region of the galactic plane; in their computational domain all the quantities (gas and stellar distribution, as well as the gravity) depends only on . In their simulations also the Galactic rotation is obviously absent. To evaluate the importance of the rotation, we have run a model similar to the reference one, but where the rotation is inhibited. In order to get a stable disk, we also assumed that no radial dependence is present, the ISM being structured as a homogeneous disk whose density and pressure depends only on , and the value of these variables at , as well as the vertical scale height, are the same found at kpc in the reference model. The same is true for the vertical component of the gravitational force, while its radial component is set to zero.
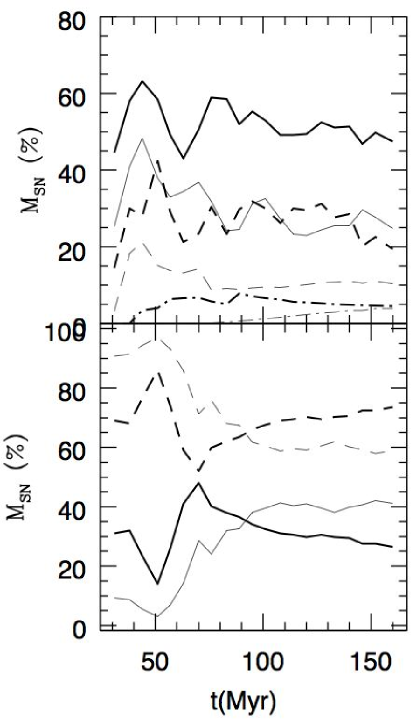
Figure 12 compares results obtained in absence of rotation with analogous results for the reference model. Both models have a maximum resolution of 26 pc. The upper panel shows that in the non rotating case the ejecta reaches larger heights than in the reference model. In fact, in the non rotating model the fountain resembles a column, and the SNe II located at its bottom can push the gas upward more effectively. In the rotating model, instead, the gas at larger (ejected at former times) lags systematically behind the freshly expelled gas along the circular trajectory (because of the drag by the gaseous halo); the fountain is thus less efficient at driving the gas to larger heights.
The differences in the distribution of the ejecta between RM and the non rotating model are illustrated in the lower panel of Fig. 12. Contrary to the previous cases, we now do not separate ideally the disk in an inner and an outer region; instead, we consider a cylindrical volume extending vertically and intersecting the disk with a circle with a diameter of 1 kpc and centred on the cluster located at kpc. At early times the ejecta in the non rotating model is mostly located inside the cylinder, but then straggles outside while falling back. The ejecta in the RM shows the same qualitative behaviour, but the mass fraction inside the cylinder remains always higher than in the non rotating case. The larger the heights reached by the ejecta, the larger its diffusion: the fraction left behind in RM along a bow shaped tail (cf. Fig. 3) is negligible and does not play a substantial role in this analysis.
6 Discussion and Conclusions
We studied in detail the development of the Galactic fountains in order to understand their dynamical evolution, their role in building intermediate velocity clouds and condensations up to few kpc over the disk, their interaction with the hot halo and their influence in the redistribution of the freshly delivered metals over the disk. In this paper we describe the evolution of a single fountain, i.e. a fountain powered by SNe II belonging to a single stellar cluster. In a companion paper we will present the results of simulations of multiple fountains fuelled by SNe II of different OB associations of various richness, occurring stochastically in space and time.
Not all the SNe II contribute to build galactic fountains. Only bubbles powered by a luminosity a few times larger than the critical luminosity break out of the disk pushing the ambient gas some kpc above the Galactic plane (cf. 2.2.1). As shown in Fig. 9, this critical luminosity decreases exponentially with the Galactocentric distance. In the next paper we will show how, combining this behaviour with the cumulative probability for the occurrence of clustered supernovae (Higdon & Lingenfelter, 2005), it turns out that only % of all SNe II occurring on the disk can give rise to Galactic fountains. This fraction reduces almost linearly with radius; for instance, it becomes % within kpc. It is likely that, in the case of multiple fountains, also weaker superbubbles may reach larger heights above the plane finding their way through breaks and tunnels carved by previous, adjacent and more powerful superbubbles. A discussion on this point is postponed in the companion paper.
In any case, a non-negligible fraction of superbubbles seems to remain contained by the thickened Galactic disk and do not participate to a large scale gas circulation. The fate of such superbubbles has been envisaged by Tenorio-Tagle (1996) who suggests that the superbubble stops its expansion stalling at an height kpc. The hot, low-density, metal-rich gas of its interior waits for the onset of radiative cooling. Small overdense inhomogeneities cool faster increasing their density and forming droplets which start to fall toward the disk. This rain of small ( pc), metal-rich cloudets occurs over a kpc-scale volume of the galaxy. These cloudets will be successively photo-evaporated by the stellar radiation, eventually mixing with the ISM. Although some objection may be raised about the details of this scheme (Recchi et al., 2001), there is no doubt that a stalled bubble must deflate as a consequence of the depressurization of its interior due to radiative losses. It is also possible that the turbulences of the local medium distort and destroy the superbubble, anticipating its disappearance. In conclusion, weak bubbles do not affect much the general distribution of the ambient medium. Their size can be rather small, of the order of 100 pc (cf. the left panel of Fig. LABEL:fig:rir2), and their metal content remains strongly localized.
On the contrary, powerful superbubbles give rise to Galactic fountains, and are expected to drive a gas circulation on large scale (Shapiro & Field, 1976; Bregman, 1980). Simple ballistic simulations described in the Appendix (see also Fraternali & Binney, 2006), where the clouds are treated as bullets ejected into the halo from the Galactic midplane, actually show that the clouds fall back on the disk at distances that can be as large as several kpc from the starting point, depending on the modulus and direction of the initial velocity (cf. the Appendix). Our hydrodynamical simulations, however, show that the majority of the gas lifted up by the fountains falls back on the disk remaining within a radial distance kpc from the place where the fountain originated. Our reference model, a fountain powered by 100 SNe II occurring at kpc, may eject material up to kpc which than collapses back mostly in form of dense, cold clouds and filaments. Although the simple ballistic model indicates that these cloud should move mostly outward (cf. the Appendix), our simulations show instead that they have the tendency to drift toward the Galactic centre as they approach the disk. This effect is due to the interaction between the fountain and the gaseous halo above the disk. This halo is at rest and exerts a drag force on the rotating fountain gas which looses part of its angular momentum and is pulled inward by the gravitational force. Nearly 60% of the metals delivered by the SNe II remains in the radial range kpc, while the rest is dispersed on a larger range, mostly inward rather than outward (c.f. Fig. 5). We stress that even in absence of the gaseous halo the fraction of metals moving inward still prevails over that moving outward, although to a smaller extent (c.f. Fig. 11). In fact, the exponential tail of the vertical distribution of the disk gas is dense enough to exert a non-negligible drag on the fountain.
We point out that our results are different from those of Booth & Theuns (2007) who obtain much longer trajectories for the clouds pushed by the fountains. As an example, these authors find that the gas ejected at kpc next passes through the disk at kpc (cf. their Fig. 5). Booth & Theuns (2007) adopt an SPH code and clouds are modelled using ‘sticky particles’ that move ballistically through the ambient gas. However, also in the framework of pure ballistic trajectories (which is the most favourable to obtain large radial displacements) it is difficult to reconcile the results of Booth & Theuns (2007) with the shorter trajectories illustrated in our Appendix.
We also stress that our results about the radial displacement of the metals are in agreement with recent chemical models of the Milky Way aimed to explain the chemical gradient along the Galactic disk (Cescutti et al., 2007). In these models the disk is approximated by several independent rings, 2 kpc wide, without exchange of matter between them. Because such models are successful in reproducing the observed gradients, one can infer that most of the metals do not move radially more than 1 kpc from the place where they are created, as found by our simulations.
We finally make some remarks about the interaction between the fountains and the hot gas of the halo. The SN II feedback, infact, is an important element to understand the energy budget of the halo (e.g. Wang, 2005). Unfortunately, at this stage, a definite conclusion can not be drawn by our models of single fountains. The amount of thermal energy of the gas of the halo in our Galactic model is erg. Although this gas is set initially at rest, some angular momentum is transferred to it by the rotating ISM of the disk through numerical viscosity. While the amount of this angular momentum is small (and the induced rotation is highly subsonic), it introduces some noise at the vertical edges of our computational box, and the thermal energy of the gas reduces of an amount , about 3% of the total. This energy must be compared with erg, which is the energy injected in the numerical grid by the SNe II. This energy is ten times lower than the perturbation generated at the boundaries, and any evaluation of the energy transfer from the fountain to the halo is prevented. This subject will be toroughly investigated in the companion paper on the multiple fountains, when the energy injected by the SNe is erg and we will be able to give a reasonably accurate evaluation of the fraction of energy transferred to the halo gas.
Acknowledgments
We are indebted to an (anonymous) referee and to Alex Raga for their extremly profitable comments and insightful suggestions that have greatly helped to improve this manuscript. E.M.G.D.P. also acknowledges the partial support from grants of the Brazilian Agencies FAPESP and CNPq.
References
- Asplund et al. (2005) Asplund M., Grevesse N., Sauval A. J., 2005, in Barnes III T. G., Bash F. N., eds, Cosmic Abundances as Records of Stellar Evolution and Nucleosynthesis Vol. 336 of Astronomical Society of the Pacific Conference Series, The Solar Chemical Composition. pp 25–+
- Barbieri et al. (2005) Barbieri C. V., Fraternali F., Oosterloo T., Bertin G., Boomsma R., Sancisi R., 2005, A&A, 439, 947
- Blitz et al. (1999) Blitz L., Spergel D. N., Teuben P. J., Hartmann D., Burton W. B., 1999, ApJ, 514, 818
- Boomsma et al. (2005) Boomsma R., Oosterloo T. A., Fraternali F., van der Hulst J. M., Sancisi R., 2005, in Braun R., ed., Extra-Planar Gas Vol. 331 of Astronomical Society of the Pacific Conference Series, High Velocity H I in NGC 6946 and Extra-planar Gas in NGC 253. pp 247–+
- Booth & Theuns (2007) Booth C. M., Theuns T., 2007, MNRAS, 381, L89
- Bregman (1980) Bregman J. N., 1980, ApJ, 236, 577
- Bregman & Houck (1997) Bregman J. N., Houck J. C., 1997, ApJ, 485, 159
- Brighenti & Mathews (1996) Brighenti F., Mathews W. G., 1996, ApJ, 470, 747
- Brinks & Bajaja (1986) Brinks E., Bajaja E., 1986, A&A, 169, 14
- Cappellaro et al. (1997) Cappellaro E., Turatto M., Tsvetkov D. Y., Bartunov O. S., Pollas C., Evans R., Hamuy M., 1997, A&A, 322, 431
- Cescutti et al. (2007) Cescutti G., Matteucci F., François P., Chiappini C., 2007, A&A, 462, 943
- Chiappini (2002) Chiappini C., 2002, Ap&SS, 281, 253
- Comerón (2004) Comerón F., 2004, Ap&SS, 289, 395
- de Avillez (2000) de Avillez M. A., 2000, MNRAS, 315, 479
- de Avillez & Berry (2001) de Avillez M. A., Berry D. L., 2001, MNRAS, 328, 708
- de Avillez & Breitschwerdt (2005) de Avillez M. A., Breitschwerdt D., 2005, A&A, 436, 585
- Dettmar (2005) Dettmar R.-J., 2005, in Hüttmeister S., Manthey E., Bomans D., Weis K., eds, The Evolution of Starbursts Vol. 783 of American Institute of Physics Conference Series, The starformation driven interstellar disk-halo connection. pp 310–318
- Deul & den Hartog (1990) Deul E. R., den Hartog R. H., 1990, A&A, 229, 362
- Ehle et al. (1995) Ehle M., Pietsch W., Beck R., 1995, A&A, 295, 289
- Ferguson et al. (1996) Ferguson A. M. N., Wyse R. F. G., Gallagher J. S., 1996, AJ, 112, 2567
- Fraternali & Binney (2006) Fraternali F., Binney J. J., 2006, MNRAS, 366, 449
- Fraternali et al. (2002) Fraternali F., Cappi M., Sancisi R., Oosterloo T., 2002, ApJ, 578, 109
- Fraternali et al. (2004) Fraternali F., Oosterloo T., Boomsma R., Swaters R., Sancisi R., 2004, in Duc P.-A., Braine J., Brinks E., eds, Recycling Intergalactic and Interstellar Matter Vol. 217 of IAU Symposium, High Velocity Gas in the Halos of Spiral Galaxies. pp 136–+
- Fraternali et al. (2004) Fraternali F., Oosterloo T., Sancisi R., 2004, A&A, 424, 485
- Fraternali et al. (2002) Fraternali F., van Moorsel G., Sancisi R., Oosterloo T., 2002, AJ, 123, 3124
- Geiss et al. (2002) Geiss J., Gloeckler G., Charbonnel C., 2002, ApJ, 578, 862
- González et al. (2004) González R. F., de Gouveia Dal Pino E. M., Raga A. C., Velazquez P. F., 2004, ApJ, 600, L59
- Heiles (1984) Heiles C., 1984, ApJS, 55, 585
- Hernquist (1990) Hernquist L., 1990, ApJ, 356, 359
- Higdon & Lingenfelter (2005) Higdon J. C., Lingenfelter R. E., 2005, ApJ, 628, 738
- Hoopes et al. (1999) Hoopes C. G., Walterbos R. A. M., Rand R. J., 1999, ApJ, 522, 669
- Houck & Bregman (1990) Houck J. C., Bregman J. N., 1990, ApJ, 352, 506
- Kahn (1981) Kahn F. D., 1981, in Kahn F. D., ed., Investigating the Universe Vol. 91 of Astrophysics and Space Science Library, Dynamics of the galactic fountain. pp 1–28
- Kahn & Brett (1993) Kahn F. D., Brett L., 1993, MNRAS, 263, 37
- Kamphuis et al. (1991) Kamphuis J., Sancisi R., van der Hulst T., 1991, A&A, 244, L29
- Koo et al. (1992) Koo B.-C., Heiles C., Reach W. T., 1992, ApJ, 390, 108
- Koo & McKee (1992) Koo B.-C., McKee C. F., 1992, ApJ, 388, 93
- Korpi et al. (1999) Korpi M. J., Brandenburg A., Shukurov A., Tuominen I., 1999, A&A, 350, 230
- Leitherer et al. (1999) Leitherer C., Schaerer D., Goldader J. D., Delgado R. M. G., Robert C., Kune D. F., de Mello D. F., Devost D., Heckman T. M., 1999, ApJS, 123, 3
- Li et al. (2006) Li Z., Wang Q. D., Irwin J. A., Chaves T., 2006, MNRAS, 371, 147
- Long et al. (1996) Long K. S., Charles P. A., Blair W. P., Gordon S. M., 1996, ApJ, 466, 750
- Mac Low & McCray (1988) Mac Low M.-M., McCray R., 1988, ApJ, 324, 776
- Mac Low et al. (1989) Mac Low M.-M., McCray R., Norman M. L., 1989, ApJ, 337, 141
- Marcolini et al. (2007) Marcolini A., Sollima A., D’Ercole A., Gibson B. K., Ferraro F. R., 2007, ArXiv e-prints, 708
- Masciadri et al. (2002) Masciadri E., de Gouveia Dal Pino E. M., Raga A. C., Noriega-Crespo A., 2002, ApJ, 580, 950
- Matthews & Wood (2003) Matthews L. D., Wood K., 2003, ApJ, 593, 721
- Melioli et al. (2005) Melioli C., de Gouveia dal Pino E. M., Raga A., 2005, A&A, 443, 495
- Navarro et al. (1996) Navarro J. F., Frenk C. S., White S. D. M., 1996, ApJ, 462, 563
- Norman & Ikeuchi (1989) Norman C. A., Ikeuchi S., 1989, ApJ, 345, 372
- Oosterloo et al. (2007) Oosterloo T., Fraternali F., Sancisi R., 2007, ArXiv e-prints, 705
- Raga et al. (2002) Raga A. C., de Gouveia Dal Pino E. M., Noriega-Crespo A., Mininni P. D., Velázquez P. F., 2002, A&A, 392, 267
- Raga et al. (2000) Raga A. C., Navarro-González R., Villagrán-Muniz M., 2000, Revista Mexicana de Astronomia y Astrofisica, 36, 67
- Recchi et al. (2001) Recchi S., Matteucci F., D’Ercole A., 2001, MNRAS, 322, 800
- Schaap et al. (2000) Schaap W. E., Sancisi R., Swaters R. A., 2000, A&A, 356, L49
- Semelin & Combes (2002) Semelin B., Combes F., 2002, A&A, 388, 826
- Shapiro & Field (1976) Shapiro P. R., Field G. B., 1976, ApJ, 205, 762
- Snowden & Pietsch (1995) Snowden S. L., Pietsch W., 1995, ApJ, 452, 627
- Swaters et al. (1997) Swaters R. A., Sancisi R., van der Hulst J. M., 1997, ApJ, 491, 140
- Takeuchi & Hirashita (2000) Takeuchi T. T., Hirashita H., 2000, ApJ, 540, 217
- Tenorio-Tagle (1996) Tenorio-Tagle G., 1996, AJ, 111, 1641
- Tenorio-Tagle & Bodenheimer (1988) Tenorio-Tagle G., Bodenheimer P., 1988, ARA&A, 26, 145
- Tomisaka & Ikeuchi (1986) Tomisaka K., Ikeuchi S., 1986, PASJ, 38, 697
- van Albada et al. (1982) van Albada G. D., van Leer B., Roberts Jr. W. W., 1982, A&A, 108, 76
- van Leer (1982) van Leer B., 1982, in Krause E., ed., Numerical Methods in Fluid Dynamics Vol. 170 of Lecture Notes in Physics, Berlin Springer Verlag, Flux-vector splitting for the Euler equations. pp 507–512
- Wakker (2001) Wakker B. P., 2001, ApJS, 136, 463
- Wakker (2004) Wakker B. P., 2004, Ap&SS, 289, 381
- Wang (2005) Wang Q. D., 2005, in Braun R., ed., Extra-Planar Gas Vol. 331 of Astronomical Society of the Pacific Conference Series, Extra-planar Diffuse Hot Gas Around Normal Disk Galaxies. pp 329–+
- Wang (2007) Wang Q. D., 2007, in EAS Publications Series Vol. 24 of EAS Publications Series, Hot Gaseous Halos of Nearby Disk Galaxies. pp 59–72
- Wang et al. (2003) Wang Q. D., Chaves T., Irwin J. A., 2003, ApJ, 598, 969
- Wang et al. (2001) Wang Q. D., Immler S., Walterbos R., Lauroesch J. T., Breitschwerdt D., 2001, ApJ, 555, L99
- Ward-Thompson (2002) Ward-Thompson D., 2002, Science, 295, 76
- Weaver et al. (1977) Weaver R., McCray R., Castor J., Shapiro P., Moore R., 1977, ApJ, 218, 377
- Wolfire et al. (2003) Wolfire M. G., McKee C. F., Hollenbach D., Tielens A. G. G. M., 2003, ApJ, 587, 278
- Woodward & Colella (1984) Woodward P. R., Colella P., 1984, Journal of Computational Physics, 54, 115
Appendix A The ballistic case
To compare the hydrodynamical description of a single fountain given in this paper with the pure kinematics picture given by Bregman (1980), we have built a model to follow the orbits of gas clouds that are ejected from the disk and move ballistically within the same potential well adopted in our hydrodynamical models (see sect. 2.1).
In this simple model we integrate the trajectory of only a single cloud which is modelled as a particle initially moving around circular orbits in the plane and receiving a kick velocity aloft. The integration is performed in cartesian coordinates using the fourth-order Runge-Kutta method, and the trajectory is followed until the cloud falls back to the disk.
In all the cases presented in Fig. 13 the cloud starts at kpc with a kick velocity km s-1. The cases differ only in the direction of . In the bottom panel of Fig. 13 three trajectories in the plane are shown for which is perpendicular to the circular velocity , but have three different inclinations with respect to the Galactocentric distance . The three trajectories in the top panel refer to cases where is orthogonal to but with different slope angles to . The case of orthogonal ejection velocity to the Galactic plane is represented in both panels for an easier comparison.
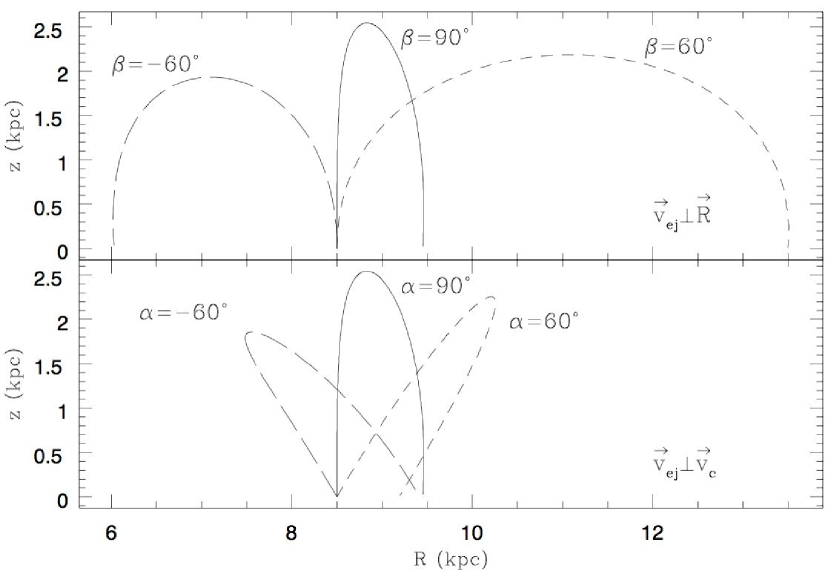
Figure 13 emphasizes the importance of the initial conditions. In the cases illustrated in the bottom panel, despite the very different orbits the cloud falls back on the plane essentially at the same Galactcentric distance, not far from the starting point. In the examples shown in the top panel, instead, the cloud can ”land” much closer to, or quite further away, the Galactic centre. In these cases one can expect consequences in the kinematics of the thick disk, as well as in the stellar abundance gradients along the disk.