K. Radziszewski
(radziszewski@astro.uni.wroc.pl)
Sizes of flaring kernels in various parts of the H line profile
Zusammenfassung
In this paper we present new results of spectra-photometrical investigations of the flaring kernels’ sizes and their intensities measured simultaneously in various parts of the H line profile. Our investigations were based on the very high temporal resolution spectral-imaging observations of the solar flares collected with Large Coronagraph (LC), Multi-channel Subtractive Double Pass Spectrograph and Solar Eclipse Coronal Imaging System (MSDP-SECIS) at Białkow Observatory (University of Wrocław, Poland).
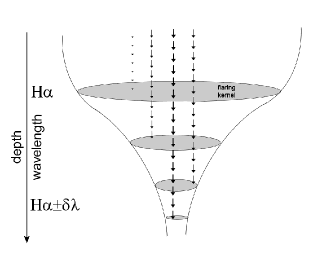
We have found that the areas of the investigated individual flaring kernels vary in time and in wavelengths as well as the intensities and areas of the H flaring kernels decreased systematically when observed in consecutive wavelengths toward the wings of the H line. Our result could be explained as an effect of the cone-shaped lower parts of the magnetic loops channeling high energy particle beams exciting chromospheric plasma.
Solar flares are investigated for more than a century, nevertheless some very important questions still remain unanswered. One of them is a problem of very fast heating of a relatively dense and cold chromospheric plasma by charged particles streaming down along flaring loops from primary energy sources located somewhere close to the tops of the loops and - to some extent - by conduction and by electromagnetic radiation. The accelerated particles travel with nearly relativistic speeds and collide with the chromosphere in fractions of seconds after their release.
Satellite-born observations made in hard X-ray domain of the spectrum clearly reveal that primary regions of the magnetic energy conversion are located high in the corona. There are also secondary hard X-ray sources, located near feet of the flaring loops (so-called foot-point HXR sources”). The co-temporal observations made in visible wavelengths (like in hydrogen H line, 656.3 nm) reveal usually numerous bright compact and/or extended emission sources localized in the closest vicinity of the foot-point HXR sources. The high time resolution observations of the visible flaring kernels show that their intensities undoubtedly vary in time.


It is commonly accepted that due to the fast change of the magnetic parameter between lower corona and photosphere, the chromospheric parts of the magnetic loops (for example channeling high energy particle beams exciting chromospheric plasma in course of the flares), should be roughly cone-shaped (e.g. Gabriel, (1976); Foukal, (1990); Stix, (1989); Aschwanden, (2006)). Unfortunately, the very strong and variable in time deformations of the apparent shape of the tiny solar structures caused by highly variable atmospheric seeing as well as a necessity of the simultaneous 2D observations in numerous wavelengths made the observational proof of this assumption very challenging. Taking advantage of unique parameters and abilities of the MSDP spectrograph we made an attempt to record directly the sizes of the H flaring kernels simultaneously in numerous wavelengths of the line profile. While various parts of the H line are formed on different depths in the chromosphere (Vernazza et al. (1973) and (1981)), even taking into account all obvious factors connected with heterogenous vertical structure of the plasma, its strong turbulence etc., the emission recorded in particular part of the line profile could be used for at least crude determination of the precipitation depth of the non-thermal electrons as well as for evaluation of the size of the emitting region.
The observational data and data reduction are described in Section 2 while the results are presented in Section 3 and discussion of the results in Section 4.
1 Observations and data reduction
The H spectra-imaging observations of the flaring kernels were collected by us with the Large Coronagraph (LC) equipped with MSDP and Solar Eclipse Coronal Imaging System (SECIS) at the Białkow Observatory of the University of Wrocław.
The LC has a 53 cm diameter main objective, its effective focal length is equal to 1450 cm. Spatial resolution of the instrument, usually limited by seeing conditions, is about 1 second of arc. During windy days the very susceptible to gusts LC was replaced by our Horizontal Telescope with compact Jensch-type coelostat and main objective of aperture of 15 cm and focal length of 5 m. The MSDP spectrograph has a rectangular (2D) entrance window, which covers an equivalent area of 32541 arcsec2 on the Sun (Mein, (1991); Rompolt et al., (1994)) and creates H spectra for all pixels inside the field of view simultaneously.
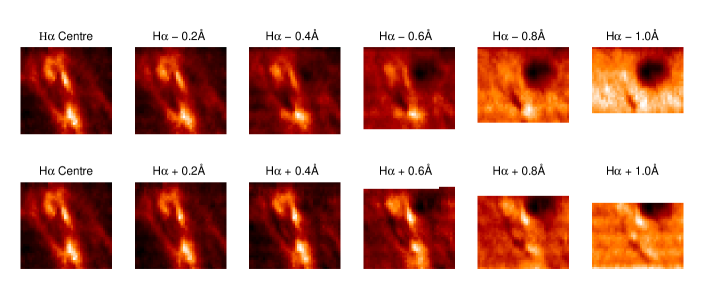
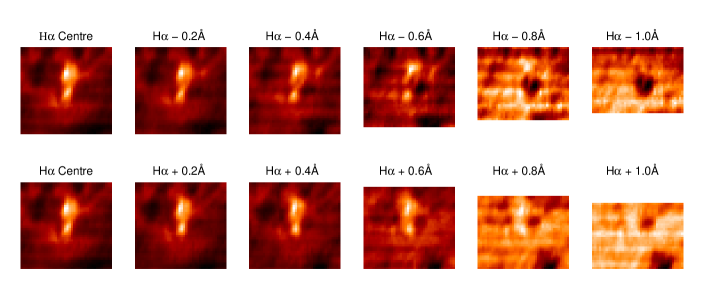
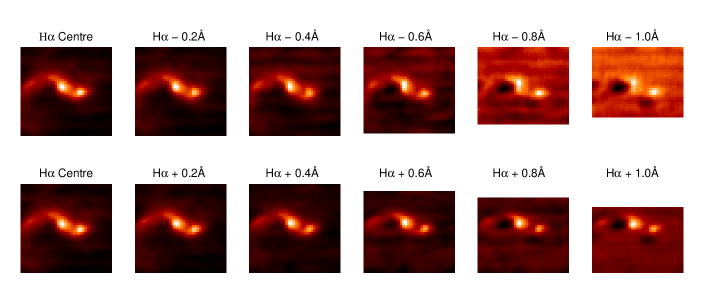
The MSDP spectrograph has a nine-channels prism-box, giving (for each pixel of the field of view) nine intensities in the H line-profile bandwidth range, separated by 0.4 Å. Next the continuous H profiles are interpolated typically in the range 1.2 Å from the line center. Due to the basic optical properties of the MSDP-type spectrographs the actual range of the band-width of the restored profiles depend on the location of the pixels in the frame of the field of view and thus decrease slightly toward the edges of the images (this effect is well visible on Figures 1, 3 and 5). On the basis of the restored H line profiles the quasi-monochromatic images were reconstructed in freely-chosen wavelengths in the line-profile bandwidth range (e.g. separated in wavelengths by 0.2 Å each other as in present work). The spectra-images created by the spectrograph were recorded with the fast CCD camera of SECIS (512512 px2, 1 px=1 arcsec2, up to 70 images per second) (Phillips et al., (2000); Rudawy et al., (2004)). Thus the MSDP spectrograph with SECIS is very suitable for studies of the fast variations of the spectral line profiles emitted by individual H flaring kernels or investigations of the solar structures observed simultaneously in various wavelengths and can be a very valuable source of the observational data for modeling of the sub-second flaring processes (Heinzel, (2003)).


In a course of three observational seasons 2003-2005 we recorded data for almost forty solar flares. For each event we recorded 10 or 20 thousand spectra-images with time resolution freely selected between 0.04 s (25 images per second) and 0.075 s (slightly more than 13 images per second) depending on the intensity of the light beam. More detailed information concerning MSDP-SECIS system and data reduction are available in papers by Radziszewski et al. (2006) and (2007).
As a result of the numerical reduction of the collected spectra-images of each particular flare we obtained a series of 10 or 20 thousand of ”data-cubesconsisting of thirteen two-dimensional, quasi-monochromatic images (band-width equal to 0.06 Å), separated in wavelengths by 0.2 Å. Due to the actual localizations of the investigated flaring kernels in the frames of the fields of views we decided to present the restored profiles consistently for all flares up to 1.0 Å from the H line center only.
The collected data allow us to investigate local temporal variations of the H emission and Doppler-shifts of the emitting material. The temporal variations of the obtained H data (profiles, intensities, areas of the emitting kernels etc.) were compared with temporal variations of the X-ray fluxes recorded with Reuven Ramaty High Energy Solar Spectroscopic Imager (RHESSI) and also with X-ray photometers on boards of the GOES satellites. Our observations, based on high cadence spectra-imaging spectrograph MSDP and RHESSI satellite data, have confirmed the high temporal correlation between HXR and H emissions for several solar flares (see Radziszewski et al. (2006) and (2007), and references therein).
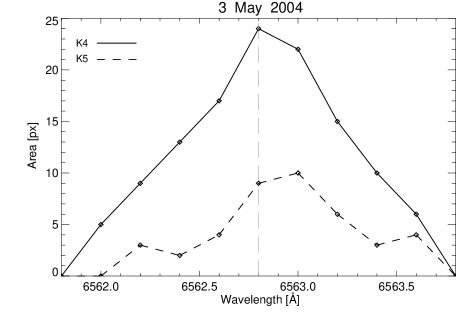
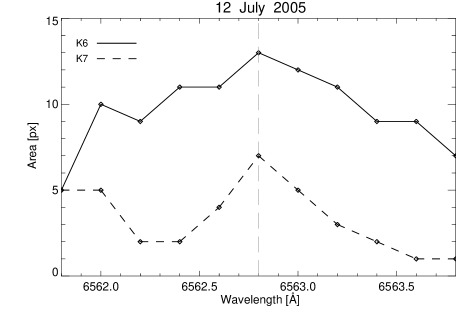
From among almost forty events observed with LC-MSDP-SECIS or HT-MSDP-SECIS systems we have chosen for this work three small and medium GOES class events, observed from the beginning of the soft X-ray flux increase and having well separated, individual flaring kernels. The quality of the selected data was among the best from all collected (stable pointing of the telescope as well as good seeing and weather conditions). The selected data include: C1.2 class solar flare observed in NOAA 10410 active region at 16:10 UT on 16 July 2003 (Figs. 1 and 2); B2.5 class solar flare in NOAA 10603 active region observed at 07:26 UT on 03 May 2004 (Figs. 3 and 4) and C8.3 class solar flare in NOAA 10786 active region observed at 08:03 UT on 12 July 2005 (Figs. 5 and 6).
2 Results of the observations
After standard photometrical and geometrical processing of the raw observational data we established locations, sizes, areas and brightness of the numerous flaring kernels observed simultaneously in various wavelengths (in a frame of the H line profile up to 1.0 Å from the H line center). It is crucial and obligatory to stress that all photometrical and geometrical parameters of the kernels were evaluated strictly at the same moment for all wavelengths (it means, between another, under exactly the same influence of the seeing which could be also considered as a wavelength independent for a whole profile of a single spectral line). On Figures 1, 3 and 5 there are presented 2D quasi-monochromatic images of the selected flaring kernels, obtained simultaneously in various wavelengths and (as a contour maps) sizes and shapes of the flaring regions delimited with an arbitrary selected isophote on the level of 75 % of the net maximum brightness of the kernel (the intensity of the brightest pixel of the evaluated kernel minus the mean emission of the adjacent quiet chromosphere). We checked various methods of determination of the kernels’ sizes in various wavelengths. According to us, the applied method is the most stable and reliable, especially for long series of data, taken under circumstances of variable atmospheric transmittance and seeing. We also checked brightness distributions of the investigated kernels and we did not reveal any local strong increases of brightness, which could cause false estimations of the kernel sizes.
After evaluation of whole series of data (usually covering a period of 8-10 minutes of the flare) we have found that:
- the most significant changes of emission were detected during the early phases of the flare, when high-energy particles beams hit the chromosphere;
- the sizes of the flaring kernels (area or equivalent radius defined as a radius of the circle having the same area as irregular surface) of the investigated flares are biggest when measured on images taken in the H line center or in wavelengths close to the line center;
- the effect of the decrease of the kernels’ areas in H line wings was detected also for series of consecutive images taken during the increase phases of the flares;
- the sizes of the flaring kernels decreased significantly and systematically when measured on images taken (at exactly the same moment) in increased distances from the line center toward the line wings (see Figures 2, 4 and 6), it means, to some extent, toward the deeper layers of the chromosphere (see Figure 7). Most of the kernels show roughly a symmetrical decrease of the visible areas in increased distances from the line center (kernels K1, K3-K7); one kernel only (K2) shows a very asymmetrical decrease of the visible areas (it shrank and disappeared much faster when observed in the blue wing of the H line than in the red one). One can also notice a slight increase of the area of the K7 kernel observed in the far blue wing of the H line.
The effect of the decrease of the flaring kernels sizes was investigated by us only for faint and mid-class solar flares, while in such flares the individual flaring kernels could be easily identified and measured.
3 Discussion
Taking advantage of the unique parameters and abilities of the MSDP spectrograph we recorded on each spectra-image directly the sizes of the H flaring kernels in numerous wavelengths of the H line profile simultaneously, with very short exposure time (0.04-0.075 s) and under exactly the same influence of the atmospheric seeing. We have found that the sizes of the flaring kernels are biggest when measured on images taken in the H line center and decreased significantly when measured on images taken in increased distances from the line center toward the both line wings (see Figures 2, 4 and 6, right panels).
Due to the very heterogenous vertical structure and obvious strong turbulence of the plasma located in the feet of the flaring loop, fast bulk motions of the plasma caused by chromospheric evaporation processes it is not straight, time independent and linear dependence between wavelengths and depth. Nevertheless, our observational results, obtained for numerous flaring kernels of the faint and mid-class solar flares could be caused by a cone-shape of the lower parts of the magnetic loops channeling particle beams exciting chromospheric plasma (see diagram on Figure 7).
In this work we presented in detail the results obtained for seven flaring kernels observed in three solar flares only. A brief inspection of the observations taken during other ten flares of various GOES classes (B and C), recorded during less favorable seeing conditions and having lower overall quality, revealed qualitatively the same effect. However, the effect was not detected by us in strong X3.8 flare observed on 17 January 2005, having bright and extended flaring structures. Such strong flares (especially X class events) seem to be not sufficient for our investigations due to the lack of well separated, individual kernels.
As a next step of our work we plan to investigate spatial displacements of the emission arriving co-temporary from the same kernel but in various wavelengths and temporal changes of kernel positions (their centroids) observed in selected wavelengths (e.g. blue wing) of the H line, as it was already reported by Ji and co-workers (2004).
Acknowledgements.
This work was supported by the Polish Ministry of Science and Higher Education, grant number N203 022 31/2991.Literatur
- Aschwanden, (2006) Aschwanden, M.J.: Physics of the Solar Corona, Springer Verlag, p.127, 2006
- Foukal, (1990) Foukal, P.: Solar Astrophysics, John Wiley and Sons Inc., p.364, 1990
- Gabriel, (1976) Gabriel, A.H.: A magnetic model of the solar transition region, Roy. Soc. Phil. Trans. Ser.A, 281, 339–352, 1976
- Heinzel, (2003) Heinzel, P.: Understanding solar flares from optical observations: How do particle beams affect the lower atmosphere?, Adv. Space Res., 32, 2393–2402, 2003
- Ji et al., (2004) Ji, H., Wang, H., Goode, P. R., Jiang, Y., Yurchyshyn, V.: Traces of the dynamic current sheet during a solar flare, Astrophys. J., 607, L55–L58, 2004
- Mein, (1991) Mein, P.: Solar 2D spectroscopy - A new MSDP instrument, Astron. Astrophys., 248, 669–676, 1991
- Phillips et al., (2000) Phillips, K. J. H., Read, P. D., Gallagher, P. T., et al.: SECIS: The Solar Eclipse Coronal Eclipse Imaging System, Solar Phys., 193, 259–271, 2000
- Radziszewski et al., (2007) Radziszewski, K., Rudawy, P., Phillips, K. J. H.: High time resolution observations of solar H flares. I., Astron. Astrophys., 461, 303–313, 2007
- Radziszewski et al., (2006) Radziszewski, K., Rudawy, P., Phillips, K. J. H., Dennis, B. R.: High time resolution observations of the solar flare H emission, Adv. Space Res., 37, 1317–1322, 2006
- Rompolt et al., (1994) Rompolt, B., Mein, P., Mein, N., Rudawy, P., Berlicki, A.: The MSDP Recently Installed at the Spectrograph of the Large Coronagraph of the Wroclaw Astronomical Institute, JOSO Annual Report 1993, ed. A. v. Alvensleben, 87–91, 1994
- Rudawy et al., (2004) Rudawy, P., Phillips, K. J. H., Gallagher, P. T., Williams, D., Rompolt, B., Keenan, F. P.: Search for 1-10 Hz modulations in coronal emission with SECIS during the August 11, 1999 eclipse, Astron. Astrophys., 416, 1179–1186, 2004
- Stix, (1989) Stix, M., The Sun, An Introduction, Springer Verlag, p.274, 1989
- Vernazza et al., (1973) Vernazza, J. E., Avrett, E. H., Loeser, R.: Structure of the Solar Chromosphere. Basic Computations and Summary of the Results, Astrophys. J., 184, 605–631, 1973
- Vernazza et al., (1981) Vernazza, J. E., Avrett, E. H., Loeser, R.: Structure of the solar chromosphere. III - Models of the EUV brightness components of the quiet-sun, Astrophys. J. Suppl. Ser., 45, 635–725, 1981