11email: oskari.miettinen@helsinki.fi 22institutetext: Dept. of Physics, Georgia Southern University, Statesboro, GA 30460-8031
Radio continuum imaging of the R CrA star-forming region with the ATCA
Abstract
Aims. The aim of this study is to investigate the nature of radio sources associated with young stellar objects (YSOs) belonging to the R CrA cluster. By combining the centimetre radio data with the wealth of shorter wavelength data accumulated recently we wish to refine estimates of the evolutionary stages of the YSOs.
Methods. The region was imaged at 3, 6, and 20 cm using the Australia Telescope Compact Array. Fluxes and spectral indices for the brightest radio sources were derived from these observations. Some of the 3 and 6 cm data were obtained simultaneously, which is useful for reliable spectral index determinations of variable sources.
Results. Eight pointlike sources were detected. Seven of them can be assigned to YSOs, which have counterparts in the X-rays, infrared or submm. One of the YSOs, Radio Source 9, is a Class 0 candidate, and another, IRS 7B, is suggested to be in the Class 0/I transition stage. IRS 7B is associated with extended radio lobes at 6 and 20 cm. The lobes may have a gyrosynchrotron emission component, which could be understood in terms of Fermi accleration in shocks. The Class I objects detected here seem to be a mixed lot. One of these, the wide binary IRS 5, shows a negative spectral index, rapid variability, and a high degree of circular polarisation with % on one of the days of observation. These signs of magnetic activity suggest that at least one of the binary components has advanced beyond the Class I stage. The radio source without YSO assigment, Radio Source 5, has been suggested to be a brown dwarf. The radio properties, in particular its persistent strong emission, do not support this classification.
Conclusions. The radio characteristics of the detected YSOs roughly agree with the scheme where the dominant emission mechanism changes with age. The heterogeneity of the Class I group can possibly be explained by a drastic decline in the jet activity during this stage, which also changes the efficiency of free-free absorption around the protostar.
Key Words.:
stars: formation – ISM: clouds – ISM: individual objects: R CrA cloud – ISM: jets and outflows – radio continuum: ISM1 Introduction
The presence of a protostar in a molecular cloud core is indicated by compact centimetre radio emission, a bipolar molecular outflow, and/or near- or mid-infrared (NIR/MIR) emission (André et al. (2000)). Centimetre continuum radiation observed toward YSOs originates in most cases from thermal free-free emission from partially ionized stellar winds or jets and/or accretion surfaces. Non-thermal gyrosynchrotron radiation has been observed towards the YSO IRS 5 in the R CrA cloud (Feigelson et al. (1998)). Synchrotron emission has been identified via detection of linear polarisation towards a very young T Tauri star by Phillips et al. (1996) (see also Massi et al. (2006)). There is also evidence for extended synchrotron protostellar jets presented in the triple radio source in Serpens (Rodríguez et al. (1989)).
The Corona Australis (CrA) dark cloud is a nearby ( pc, Knude & Høg (1998))111There are also shorter distance estimates for the CrA star-forming region. Marraco & Rydgren (1981) derived a distance of only 129 pc for the R CrA dark cloud. Also, Casey et al. (1998) derived a similar distance of pc for TY CrA. In the present paper, the Hipparcos distance pc is adopted. low- and intermediate-mass star-forming region, where the R CrA core represent the most active site of star formation. The evolutionary stages range from Class 0 objects to pre-main sequence (PMS) stars (Wilking et al. (1997); Nisini et al. (2005); Nutter et al. (2005)). The R CrA region is therefore favourable for studies of the dependence of radio continuum emission on the stellar evolutionary stage.
In recent years, the cluster of YSOs in the R CrA core, also called the Coronet (Taylor & Storey (1984)), have been studied extensively in X-rays, in the infrared, submillimetre, and in radio (Hamaguchi et al. (2005); Nutter et al. (2005); Forbrich et al. (2006); 2007; Forbrich & Preibisch (2007); Groppi et al. (2007)). It has become evident that some of the radio and X-ray sources in the region are highly variable. Forbrich et al. (2007) performed the first simultaneous X-ray, radio, NIR, and optical monitoring of the cluster, and detected seven objects simultaneously in all wavelength bands. These series of studies have given information on the processes and emission mechanisms associated with various stages of early stellar evolution, and helped to ascertain the evolutionary stages of most of the cluster members. However, the Radio Sources 5 and 9, first detected by Brown (1987), have not yet been unambiguously classified. These two sources will be hereafter called as Brown 5 and Brown 9.
In this paper we present centimetre continuum imaging of the R CrA core performed at the Australia Telescope Compact Array using the wavelengths 3, 6 and 20 cm. The purpose of this study was to determine the radio spectral indices of the various sources in the region, and thereby remove some uncertainty concerning their nature. At the same we add a couple of measurement points to the time series of the varying sources. In Sect. 2 of this paper we review briefly the radio continuum emission mechanisms associated with YSOs. The observations and data reduction procedures are described in Sect. 3. The results are presented in Sect. 4. In Sect. 5 we discuss the results, and in Sect. 6 we summarise our conclusions.
2 Radio continuum emission from YSOs
2.1 Spectral index and polarisation
Radio emission from young protostars usually has a spectral index222The spectral index is defined as , where is the flux density and is the frequency., , in the range [-0.1, 2.0]. This range is characteristic for thermal free-free emission from partially ionized gas (, see Martin (1996); Anglada et al. (1998) and references therein). The dependence represents optically thick free-free emission, whereas optically thin emission is almost independent of frequency (e.g., Güdel (2002)). Conforming with this emission mechanism the brightness temperatures measured for protostellar sources are moderate ( K). The emission can originate in ionized jets from protostars or in shocks produced by jets penetrating into the circumstellar material (e.g., Curiel et al. (1987)). Other possible sources are ionized disk wind (e.g., Martin (1996)) or accretion shocks on circumstellar disks (e.g., Winkler & Newman (1980); Neufeld & Hollenbach (1996); see also Ghavamian & Hartigan (1998)).
The predicted spectral index of the so-called standard spherical stellar wind (i.e., fully ionized and isotropic stellar wind with constant velocity) is 0.6 at cm-wavelengths (e.g., Panagia & Felli (1975)). According to the model of Bertout (1983) also accretion can produce a spectral index of 0.6. In this model the region emitting at radio wavelengths is photoionized by soft X-ray and EUV radiation from an accretion shock around a protostellar core. In contrast, in the model of Felli et al. (1982) accreting ionized circumstellar envelope produces a flat spectrum with spectral indices in the range of .
Reynolds (1986) has modelled continuum emission from both collimated and accelerated spherical flows. According to these results, can increase above 0.6 for an accelerated flow, but a collimated ionized flow produces a flat spectrum with . In the model of collimated ionized flow, the opacity decreases with the distance to the central source (see also Anglada et al. (1998)).
Several YSOs show negative spectral indices, , in the radio, characteristic of non-thermal gyrosynchrotron emission (see, e.g., Forbrich et al. (2006); Stamatellos et al. (2007) and references therein). Gyrosynchrotron emission arises from mildly relativistic electrons (Lorentz factor , see Dulk (1985)) gyrating in magnetic fields close to the YSO and/or to the star-disk interaction region. Thus, non-thermal radio emission indicates magnetic activity around protostars.
Also shocks can accelerate electrons to mildly relativistic energies ( MeV). Clear evidence of efficient electron acceleration associated with YSOs have been found in the Serpens triple source (see Feigelson & Montmerle (1999)). Gyrosynchrotron radiation can be generated in jet induced shocks by Fermi acceleration of electrons. In the so-called diffusive shock acceleration (DSA) electron scatters off magnetic irregularities frozen in to the local plasma flow. This interaction can change the direction of electron, which can result in several encounters with the shock front enabling several encounters with the shock. The shock crossings lead to a systematic gain of kinetic energy. Besides having a negative spectral index, gyrosynchrotron emission is characterised by rapid variability, moderate degree of circular polarisation ( %), and very high brightness temperature ( K) (see, e.g., André et al. (1996); Forbrich et al. (2006)).
Partial linear polarisation characteristic of synchrotron radiation from ultrarelativistic electrons () was detected by Phillips et al. (1996) (see Sect. 1), which implies very efficient electron acceleration. As a distinction from the gyrosynchrotron radiation, the degree of circular polarisation (which to order of magnitude amounts to ) of synchrotron radiation is low (Dulk (1985)).
The observed spectral index mainly describes the source average opacity and in the case of inhomogeneous source, the radio emission can originate from both optically thin and thick regions. Thus, the spectral index alone gives only a rough diagnostic of the nature of YSO radio emission (André et al. (1996); Anglada et al. (1998)).
2.2 Relation between radio continuum emission mechanism and evolutionary stage of the YSO
The dominant radio continuum emission mechanism is suggested to change with the age of the YSO (Gibb (1999)). In the Class 0/I stage, the principal emission mechanism is thermal free-free emission (accretion and outflowing jets). Continuum emission from Class II objects (classical T Tauri stars, CTTSs) at cm-wavelengths is caused by thermal free-free mechanism in strong ionized winds. In the Class I/II phase, possible non-thermal component is likely to be free-free absorbed in the surrounding dense ionized gas. The detection of a non-thermal component becomes more and more difficult towards higher frequencies where free-free absorption is accentuated (Güdel (2002)). Later, in the Class III stage (weak-lined T Tauri stars, WTTSs), when circumstellar disks and ejecta are very weak or absent, non-thermal gyrosynchrotron emission from the exposed star can dominate at radio wavelengths due to increased stellar magnetic field (see Feigelson & Montmerle (1999); Gibb (1999); Wilking et al. (2001)).
Free-free emission can dominate gyrosynchrotron emission not only if the density is high (free-free absorption), but also if the temperature is low or the magnetic field is weak. Moreover, different frequency depencies may cause switching between the dominant emission mechanism at a certain frequency (Dulk (1985)). Furthermore, Gibb (1999) suggested that the apparent correlation between radio continuum emission and evolutionary stage could be due to source geometry and optical depth effects.
3 Observations and data reduction
The R CrA star-forming region was observed at 3, 6 and 20 cm continuum with the Australia Telescope Compact Array (ATCA)333Operated by the CSIRO Australia Telescope National Facility., located near Narrabri, Australia. The observations were made during two observing runs in 1998 and 2000. The dates, configurations, phase centres, calibrators, and other observing parameters are given in Table 1. The correlator configuration used provided at each frequency a total bandwith of 128 MHz recorded as a 16 channel spectrum. Four products of the linearly polarised feeds were recorded (XX, YY, XY and YX), and thus all the Stokes parameters can be solved from the calibrated data.
The data were calibrated and imaged using the Miriad software package (Sault et al. (1995)). The visibilities were transformed into maps using natural weighting. The image deconvolution was done with the Miriad task mfclean. Primary beam correction was finally done for images (Miriad task linmos). Intensity maxima exceeding 3 times the local rms are considered as detections. For non-detections we give upper limits.
| Date of observations | 1998 Jan 9/10 | 2000 May 28 | 2000 May 31 | 2000 Jun 9 | 2000 Jun 10 |
| Time (UT) interval | 19:06:05-08:40:55 | 09:56:35-23:11:45 | 09:33:35-21:56:25 | 09:26:15-22:21:55 | 09:25:55-22:03:35 |
| Wavelength | 3 and 6 cm | 3 cm | 3 cm | 6 cm | 20 cm |
| Bandwith | 128 () MHz444Used in all cases. | ||||
| Configuration | 1.5A | 1.5A | 1.5A | 6B | 6B |
| -distance range | 5–149 and 2.6–74.5 k | 5–149 k | 5–149 k | 3.6–99.5 k | 1–30 k |
| Phase centre | |||||
| (, ) | |||||
| Flux calibrator555Calibrator flux densities are the following: PKS 1934-638: Jy, Jy, Jy; B1849-36: Jy, Jy; B1933-400: Jy, Jy, Jy (from the ATNF web site http://www.narrabri.atnf.csiro.au/calibrators/). | PKS 1934-638 | PKS 1934-638 | PKS 1934-638 | PKS 1934-638 | PKS 1934-638 |
| Phase calibratorsb | B1849-36 | B1933-400 | B1933-400 | B1933-400 | B1933-400 |
| Image processing | Naturally weighteda | ||||
| FWHM of synthesized beam | and | ||||
| Beam position angle | and 666The difference between the beam position angles is due to the different amount of flagged data. | ||||
| rms noise level [Jy beam-1] | 97 and 81 | 76 | 47 | 44 | 120 |
| Peak position777These positions refers to peak positions at 3 cm observed in January 1998. | ||||
|---|---|---|---|---|
| No. | [h:m:s] | [::] | Source ID | Source class |
| 1…… | 19 01 43.3 | -36 59 13 | Brown 5888Source number in Brown (1987). | unclear |
| 2…… | 19 01 48.0 | -36 57 22 | IRS 5 | Class I |
| 3…… | 19 01 50.5 | -36 56 38 | IRS 6 | Class II (CTTS) |
| 4…… | 19 01 50.7 | -36 58 10 | IRS 1 | Class I |
| 5…… | 19 01 53.6 | -36 57 12 | R CrA | HAe |
| 6…… | 19 01 55.2 | -36 57 17 | Brown 9b | Class 0 ? |
| 7…… | 19 01 55.3 | -36 57 22 | IRS 7A, IRS 7W999Source used in Forbrich et al. (2006); 2007. | Class I |
| 8…… | 19 01 56.4 | -36 57 28 | IRS 7B, IRS 7Ec | Class 0/I |
| Source | 1998 Jan 9/10 | 2000 May 28 | 2000 May 31 | 2000 Jun 9 | 2000 Jun 10 | |
| [mJy] | [mJy] | [mJy] | [mJy] | [mJy] | [mJy] | |
| Brown 5 | ||||||
| IRS 5 | ||||||
| IRS 6 | - | - | - | - | - | |
| IRS 1 | - | - | ||||
| R CrA | - | - | ||||
| Brown 9101010Blended with IRS 7A at 6 cm in the dataset 1998 Jan 9/10, and at 20 cm in the dataset 2000 Jun 10. | - | - | ||||
| IRS 7A111111For these extended sources we give the integrated flux densities over the pixels above the level as calculated by the Miriad task imfit. | ||||||
| IRS 7Bb | ||||||
| Source | 121212 derived from 1998 Jan 9/10 data using convolved flux densities. | 131313 derived from 2000 May 31 & Jun 9 data using original flux densities. | 141414 derived from 2000 Jun 9/10 data using convolved flux densities. |
| Brown 5 | |||
| IRS 5 | |||
| IRS 1 | - | - | |
| R CrA | - | - | |
| Brown 9 | - | - | |
| IRS 7A | |||
| IRS 7B |
4 Results
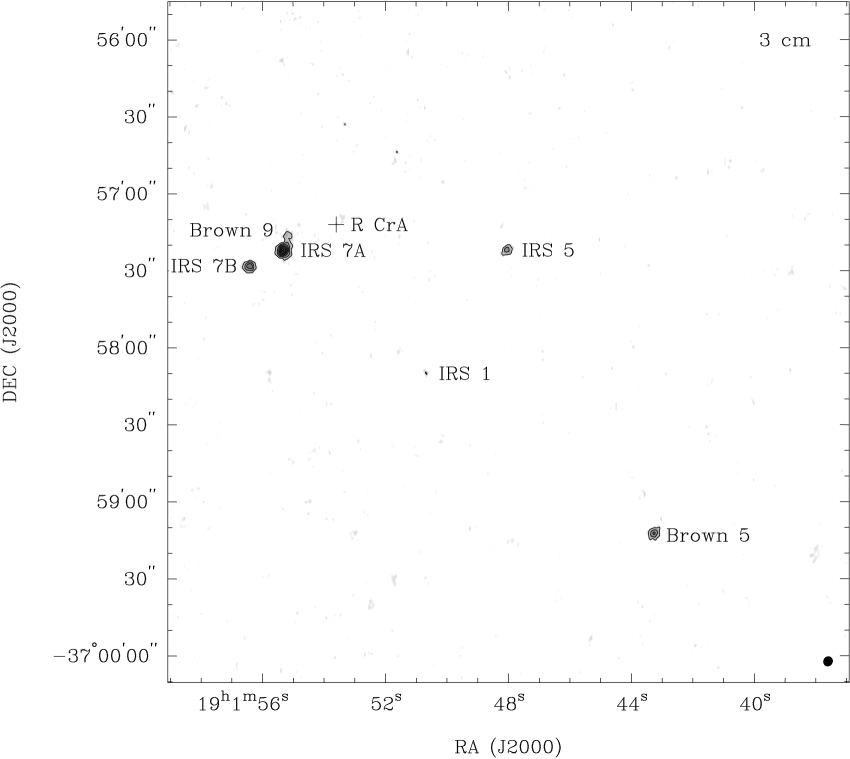
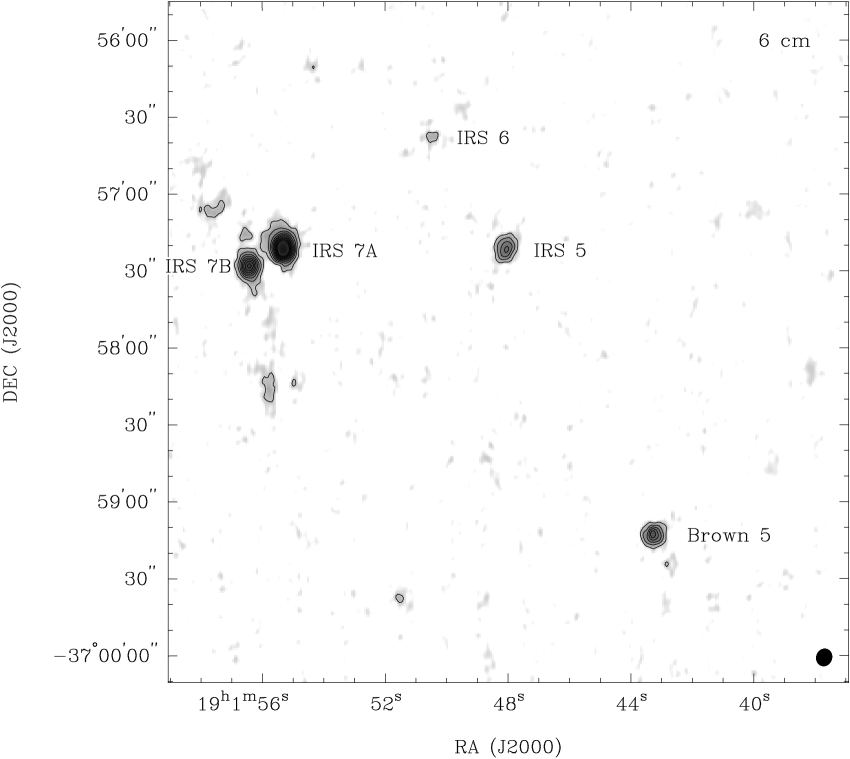
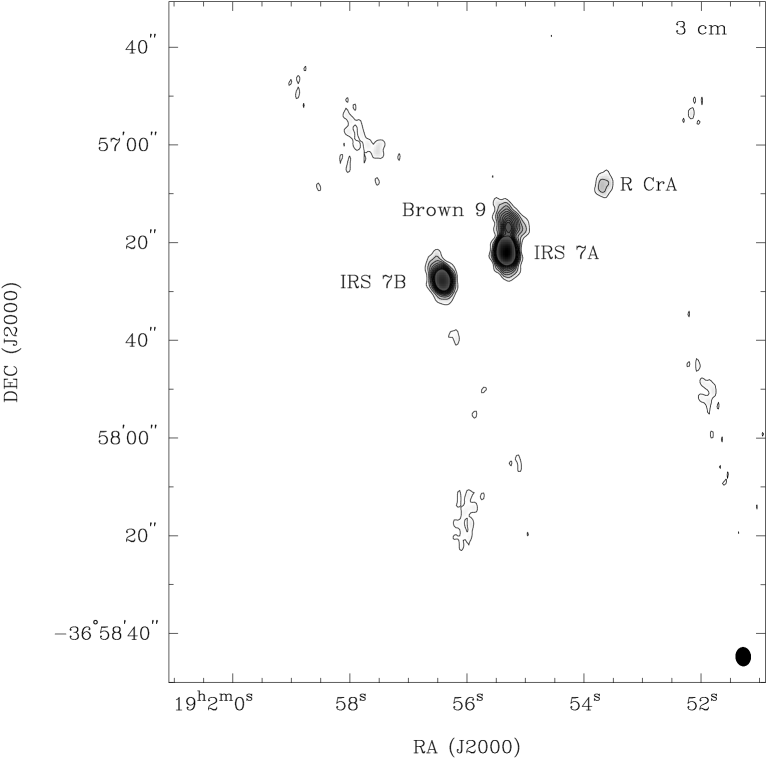
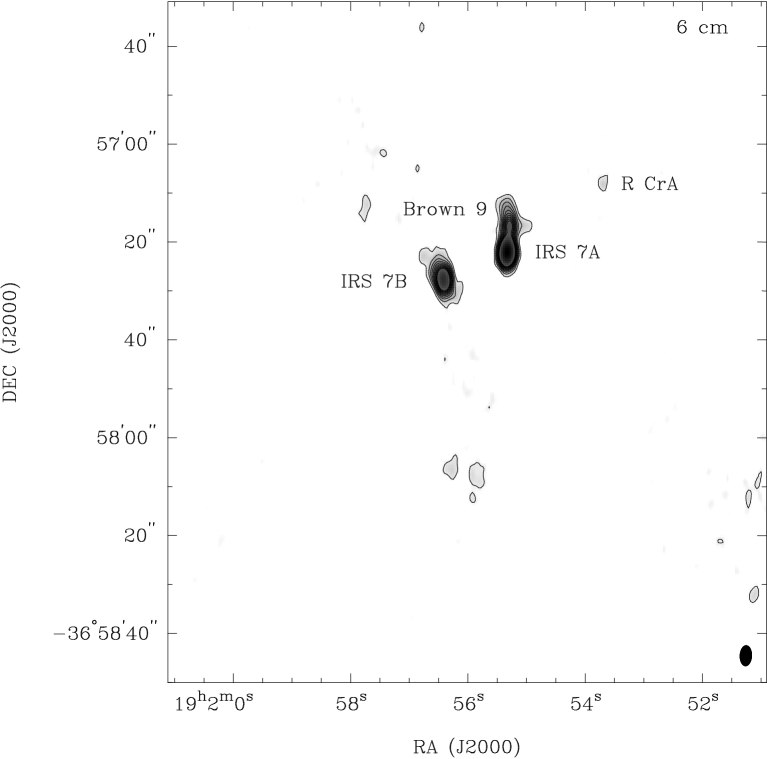
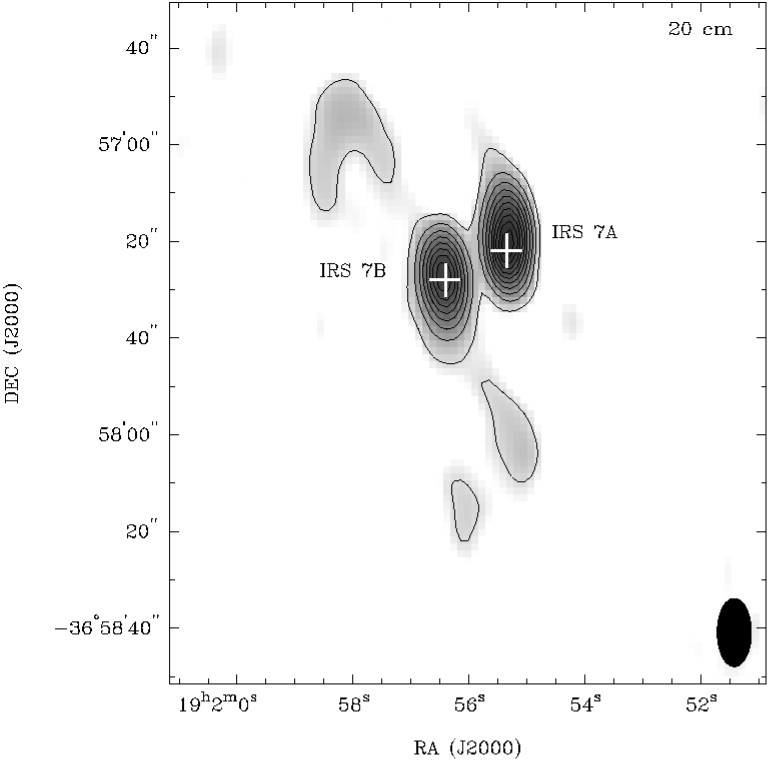
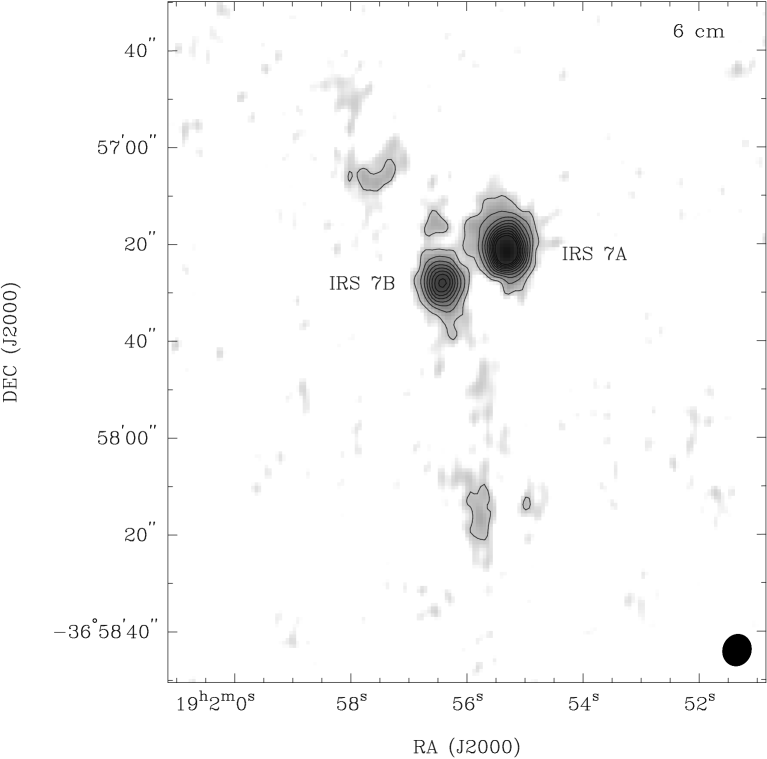
The 3 and 6 cm continuum images from 1998 Jan 9/10 are shown in Figs. 1 and 2, respectively. The 3 and 6 cm images from 2000 May 31 and Jun 9 toward the IRS 7 region are shown in Fig. 3. A comparison of the 20 and 6 cm images from 2000 Jun 10 and 1998 Jan 9/10 showing the radio lobes associated with IRS 7B are presented in Fig. 4. Altogether 8 radio sources were identified by inspecting the maps visually. The sources are listed in Table 2. This gives their J2000 coordinates, identifications with previously known sources, and suggested classifications.
The flux densities are given in Table 3. These were obtained from Gaussian fits using the Miriad task imfit. For the pointlike sources 1 – 6 the flux density is the peak of the Gaussian, whereas for the somewhat extended sources 7 and 8 we give the integrated intensity over the pixels above the level as calculated by imfit. The errors are determined in the fitting procedure. As can be seen from Table 3, only Brown 5, IRS 5, and the IRS 7A/B pair are visible at all three wavelengths.
We also obtained spectral indices between 3 and 6 cm (), and 6 and 20 cm (). For the determination of these spectral indices, the maps at the two frequencies were convolved to the same angular resolution using the Miriad task convol. On May 31 and Jun 9, 2000 we used configurations which gave similar synthesized beams at 3 and 6 cm in order to derive reliable spectral indices for extended sources. In 1998, Jan 9/10, the 3 and 6 cm observations were done simultaneously, and in this case the spectral indices should be more reliable for variable point sources. The spectral indices and , and their errors are given in Table 4. The error estimates are based on the rms errors of the flux densities, and do not take into account the possible errors caused by different beams or source variability.
5 Discussion
All the eight sources detected in the present study are known from previous radio surveys (Brown (1987) (2 and 6 cm, VLA); Suters et al. (1996) (2, 3.5, 6, and 20 cm, VLA and ATCA); Feigelson et al. (1998) (3.5 cm, VLA); Choi & Tatematsu (2004) (0.7 cm, VLA); Forbrich et al. (2006); 2007 (3.6 cm, VLA)). Five of the sources, IRS 5, IRS 6, IRS 1, R CrA, and IRS 7A, have counterparts both in the near/mid-infrared and X-rays. Moreover, IRS 7B, has been recently detected in the mid-infrared (but not in the NIR) and X-rays. Brown 9 corresponds to a submm peak (Groppi et al. (2007)). Brown 5 has only been detected in radio, but it may be associated with a near-IR source (Wilking et al. (1997)). In what follows we discuss the radio properties of the detected sources in detail.
5.1 Comments on individual sources
5.1.1 The IRS 7 region
IRS 7 is the most active complex in the Coronet cluster. A dense, bipolar molecular outflow and a large rotating molecular disk (outer radius AU at pc) were detected in the IRS 7 region (Anderson et al. 1997a ; 1997b). Groppi et al. (2004) found that the envelope surrounding the disk show signs of infall in the HCO spectra. The region contains three compact radio sources, IRS 7A, IRS 7B, and Brown 9. The rotation axis of the molecular envelope coincides with a string of HH objects (Hartigan & Graham (1987); see Fig. 10 in Anderson et al. 1997a ). These features suggest ongoing powerful accretion and possible shocks associated with infall onto an accretion disk.
IRS 7A and IRS 7B are the brightest radio sources in the whole cloud. The evolutionary stages of these sources have been discussed by Wilking et al. (1997), Choi & Tatematsu (2004), Hamaguchi et al. (2005), Forbrich et al. (2006), and Groppi et al. (2007). Brown 9 (Brown (1987)) is located north of IRS 7A (850 AU at pc). Brown 9 and IRS 7A are blended in the 6 cm map from 1998 and in the 20 cm map from 2000.
IRS 7A has not shown much radio variability. The flux densities of IRS 7A are very similar to those observed by Brown (1987), Feigelson et al. (1998) and Forbrich et al. (2006). The flat spectrum with and and can be explained by optically thin emission from ionized circumstellar envelope or a collimated jet. IRS 7A has been detected both in the near-infrared and in the X-ray band. In view of the relatively bright radio emission, these characteristics suggest that the source represents the protostellar Class I.
The relationship between IRS 7A, Brown 9 and the nearby 10m source between the two (Wilking et al. (1997)) has been discussed in Choi & Tatematsu (2004, hereafter CT). They suggest that these sources belong to a system formed by a central star (close to the 10m source, associated with the mm source No. 3 of CT) and ionized jets (IRS 7A and Brown 9) on its both sides. By inspecting the map of CT, the cm map of Forbrich et al. (2006), and the SCUBA 450 m continuum map of Groppi et al. (2007), one agrees that the three sources can be physically connected. It is, however, unlikely that the X-ray source IRS 7A and the submm source Brown 9 would just be jets arising from the 10m source associated to IRS 7. In all other near-IR sources of our sample the hottest spot, i.e. the X-ray source, shows the location of the central protostar. On the other hand, the submm/far-IR spectrum of Brown 9 is not possible to explain with free-free emission from plasma, but it is characteristic of a Class 0 protostar (see Fig. 8 in Groppi et al. (2007)).
The flux densities of Brown 9 at 3 cm found in the present study are mostly similar to those found in the previous studies (Feigelson et al. (1998); Forbrich et al. (2006)). However, the source shows a significant brightening (by a factor of two) since the observation of Brown (1987). The spectral index, , is consistent with thermal free-free emission originating in a collimated ionized flow. The source of this flow is likely to be embedded in core detected with SCUBA.
The IRS 7B flux densities derived here are 0.5–1.5 mJy higher than those reported by Brown (1987), Feigelson et al. (1998) and Forbrich et al. (2006). This difference can be attributed to source variablity. The spectral indices between 3 and 6 cm are and . The spectral index between 6 and 20 cm, , is close to the limit of thermal emission and non-thermal gyrosynchrotron emission (). We note, however, that is derived from simultaneous observations (1998, Jan 9/10) and is much more significant than the value for () based on observations from two consecutive days.
IRS 7B is associated with weak, extended radio emission. The lobes on the northeastern and southern sides of the point source are clearly visible on the 6 cm map from 1998 and the 20 cm map from 2000 (see Fig. 4). These two maps were obtained using configurations with the shortest -distances (see Table 1). Traces of these lobes can be seen in the 3 and 6 cm images from 2000 (Fig. 3), which represent the highest angular resolution available here. The lobes become visible also in these data by applying a Gaussian taper which produces a resolution similar to that in the 20 cm image. The S/N ratio is, however, too poor to compare individual features at 3 and 6 cm. The extended emission was already detected by Brown (1987) at 6 cm and by Suters et al. (1996) at 20 cm. The radio lobes may be associated with a stage prior to the formation of a HH object (Curiel et al. (1993)). The fact that the lobes are more prominent at 6 and 20 cm than at 3 cm or shorter wavelengths suggests a negative spectral index and consequenly, a possible gyrosynchrotron emission component. This led Harju et al. (2001) to suggest that the source could be a distant radio galaxy or a Galactic microquasar. Later observations have, however, ruled out this possibility. Pontoppidan et al. (2003) detected IRS 7B in the 4.67 m absorption lines of solid CO, which clearly originate in circumstellar material. Moreover, Hamaguchi et al. (2005) pointed out that it would be very unlike to observe AGN with X-ray flux of IRS 7B in the IRS 7 region. Also the X-ray spectra of IRS 7B does not resemble those of AGNs. Many properties of IRS 7B, e.g. the large equivalent width of the fluorescent X-ray iron line and the spectral energy distribution, suggest it to be a Class 0 source or an object between Class 0 and Class I phase (Hamaguchi et al. (2005); Nutter et al. (2005); Groppi et al. (2007)).
Given the spectral indices and other properties of IRS 7B, the continuum radiation is probably coming from the surrounding gas which is shock-ionized by the high velocity jet. The radio lobes associated with the thermal radio jet possible have a gyrosynchrotron emission component. This could be understood in terms of DSA of electrons (see Sect. 2.1).
5.1.2 Brown 5 - a brown dwarf ?
This is the Radio Source 5 detected by Brown (1987) using the VLA at 6 cm. It has been suggested that the infrared counterpart of Brown 5 could be a brown dwarf if it lies in the R CrA cloud (Wilking et al. (1997); Feigelson et al. (1998); see also Forbrich et al. (2006)). The infrared source has been detected in the and bands only, with , and . The value of suggests a large interstellar or circumstellar reddening ( for an M9V dwarf, Wilking et al. (1999)). Therefore the object is likely to lie in the cloud or behind it. It should be noted that brown dwarfs are seldom detected in radio (see, e.g., Güdel (2002); Osten & Jayawardhana (2006)). During flares the flux densities of nearby ( pc) brown dwarfs can increase to a few millijanskys, but the average value is an order of magnitude lower (radio luminosity ergs s-1 Hz-1). Assuming that the object lies at the distance of the CrA cloud its (nearly constant) radio luminosity is ergs s-1 Hz-1. This high luminosity would be characteristic of a magnetically active star rather than a brown dwarf (Güdel (2002)). On the other hand, the fact that Brown 5 has not been detected in X-rays (Forbrich et al. (2006); Forbrich et al. (2007)) makes coronal emission from a late-type star a less likely alternative.
The fluxes observed here are similar at all wavelengths to those observed by Suters et al. (1996), Feigelson et al. (1998) and Forbrich et al. (2006). On one day Suters et al. detected an unusually high 3 cm flux, and later on, Forbrich et al. (2006) found that the source is variable on timescales of days to months.
The radio spectral indices, and , indicate optically thin gyrosynchrotron emission, and so magnetic field activity in this object. The former spectral index is similar to that found by Suters et al. on Jul 12, 1992 (), but our 6/20 cm index is very different from their values (). Spectral index derived from 2000 May 31 / Jun 9 data, , is probably not meaningful since the source is variable with a scale of days.
According to Suters et al. (1996) the high obscuration and rapid variations make it more likely that Brown 5 is a PMS star rather than an extragalactic source. However, extragalactic nature cannot be totally ruled out as interstellar scintillation can cause so called IntraDay Variability (IDV, see Gabányi et al. (2007)).
5.1.3 IRS 5
The Class I protostar IRS 5 is known to be a highly variable radio source. Our ATCA observations yield mainly similar flux densities to those observed by Brown (1987), Suters et al. (1996), Feigelson et al. (1998) and Forbrich et al. (2006; 2007). At 20 cm we found a flux of 0.40 mJy, over 2 times lower than the lowest value found by Suters et al. (1996). Suters et al. detected a flare of 6.6 mJy at 6 cm in 1992 and concluded that IRS 5 experienced an outburts in mass loss. The radio spectral indices of IRS 5 found in the present study are and and . We note that the latter two values can be deceptive since the source is highly variable. Suters et al. found spectral indices and , and varied from to , all very different from those derived here. On the other hand, the indices of Suters et al. have rather large errors.
IRS 5 has been detected in X-rays (Koyama et al. 1996; Neuhäuser & Preibisch (1997)), and recently Forbrich et al. (2006; 2007) found it to be the most variable source in X-rays in the R CrA region (see also Forbrich & Preibisch (2007)). Feigelson et al. (1998) detected circularly polarised non-thermal emission from IRS 5 at 3.5 cm, which is also the first such detection for a YSO. This was later confirmed by Forbrich et al. (2006), but interestingly, there was also occasion when IRS 5 did not show circular polarisation in their observations. In the present study, the Stokes- emission of IRS 5 was detected only at 3 cm on May 31, 2000, with the flux density of mJy, the polarisation fraction, , being as large as about 33 %. The upper limits of emission at 3 and 6 cm observed in 1998 Jan 9/10, at 3 cm in 2000 May 28, and at 6 and 20 cm in 2000 Jun 9/10 are about 0.07, 0.20, 0.18, 0.06, and 0.04 mJy, respectively. The corresponding upper limits of are about 9 and 19 % at 3 and 6 cm in 1998 Jan 9/10, respectively, and about 10 % during other measurements in 2000.
The slightly negative spectral index between 3 and 6 cm, and circular polarisation suggest that the radio emission has a substantial non-thermal gyrosynchrotron component. This conforms with the fact that IRS 5 does not appear to be powering an outflow (Feigelson et al. (1998); see also Wang et al. (2004)). Detectable non-thermal emission implies that the immediate surroundings of the star are relatively free of optically thick ionized gas (see Sect. 2.2). The classification of IRS 5 is complicated by the fact that it is a binary with a separation of or 102 AU at 170 pc (Chen & Graham (1993); Nisini et al. (2005)). The binary is also marginally resolved in X-rays (Forbrich & Preibisch (2007)). This together with the rapid variability make the determination of the spectral indices uncertain. Nevertheless, the radio properties of this source suggest that at least one of the components has advanced beyond the Class I stage.
5.1.4 Other detections
The T Tauri star IRS 6 was detected only at 6 cm in the 1998 visibility data with the flux density mJy. Thus, the spectral index cannot be determined. The upper limits of the 3 cm flux density are 0.02 and 0.03 mJy (on Jan 9/10, 1998, and May 28/31, 2000, respectively), and the upper limits of the 6 and 20 cm flux densities are 0.13 and 0.10 mJy (on Jun 9/10, 2000). There are no reported radio emission from this source before Forbrich et al. (2006). Forbrich et al. (2006; 2007) also found very low fluxes of mJy at 3.6 cm.
IRS 1 is another Class I object in the Coronet cluster (Wilking et al. (1986); wilking1992 (1992)). It is also known as HH 100-IR, and is likely a driving source of the HH flow consisting of HH 96, 97, 100, and 98. The flux densities of IRS 1 in the present work are very similar to those observed by Brown (1987), Suters et al. (1996), Feigelson et al. (1998) and Forbrich et al. (2006). At 20 cm IRS 1 remained below the level of 0.36 mJy. The spectral index is consistent with the value derived by Suters et al. (1996). This high spectral index suggests optically thick free-free emission, which can attributed to shocked material. IRS 1 has been detected as a hard X-ray source (Koyama et al. 1996; Neuhäuser & Preibisch (1997)). Even though IRS 1 does not show significant radio variability, it shows clear signs of X-ray variability (Suters et al. (1996); Forbrich et al. (2006)). According to Nisini et al. (2005) a very high fraction of the bolometric luminosity of IRS 1 is due to accretion. In view of these results it seems possible that the cm emission originates in an accretion shock in the circumstellar disk.
The Herbig Ae star R CrA has remained undetected in several surveys, indicating long-term variability (see Forbrich et al. (2006) and references therein). Our 3 cm flux densities are somewhat higher than those observed by Forbrich et al. (2006; 2007). The 6 cm flux of R CrA was mJy. The source was not detected at 20 cm above the level of 0.36 mJy.
Koyama et al. (1996) detected hard X-ray emission close to the position of R CrA and Forbrich et al. (2006) clearly detected X-ray emission from R CrA in all of their Chandra and XMM-Newton datasets. As Forbrich et al. (2006) pointed out, the X-ray emission from this star does not fit into our understanding of stellar X-ray emission mechanisms (magnetically driven corona or shocks caused by strong stellar wind; see also Forbrich & Preibisch (2007)).
Given the substantial error in the spectral index, , it is not possible to make firm conclusions about the emission mechanism for this continuum radiation. However, since R CrA should not drive very strong stellar wind, the upper limit of the spectral index () is excluded. On the other hand, since R CrA is likely to be a driving source of collimated outflow (see, e.g., Suters et al. (1996)), radio emission is probably produced by a collimated, ionized flow.
5.1.5 Non-detections
IRS 2: The Class I protostar IRS 2 is one of the strongest X-ray sources among the objects studied by Forbrich et al. (2006). The non-detection is probably due to primary beam attenuation far from the observation’s phase centre.
IRS 9: The Class I protostar IRS 9 remains undetected at radio also in previous radio observations (see Forbrich et al. (2006)).
T CrA: The Herbig Ae star, T CrA, of spectral F0e is one of the most massive stars in the R CrA core. The non-detection is consistent with the earlier studies of Brown (1987) and Suters et al. (1996).
6 Summary and conclusions
We have conducted a survey of radio continuum emission at 3, 6 and 20 cm in the R CrA star-forming region using the ATCA. Altogether eight pointlike sources were detected. Seven of these can be assigned to YSOs, having counterparts in the X-rays, infrared or submm. We studied their spectral indices, variability, and polarisation to gain information on possible emission mechanisms. In this manner we examined the classifications of the YSOs in the light of the evolutionary scenario presented by Gibb et al. (1999), which relates radio properties to protostellar stages.
Probably the youngest protostars in our sample are Brown 9 and IRS 7B. Brown 9 is a Class 0 candidate and IRS 7B has been suggested to represent a transition stage between Class 0 and Class I (Groppi et al. (2007)). The spectral indices of these two sources are consistent with free-free emission from a collimated jet. IRS 7B shows signs of extended lobes at 6 and 20 cm. The lobes may have a gyrosynchrotron component which possibly can be understood in terms of Fermi acceleration of electrons in shocks associated with high velocity jets from the protostar.
The three Class I protostars detected in this survey, IRS 7A, IRS 5 and IRS 1 have very different characteristics. The spectra of IRS 1 and IRS 7A are consistent with free-free emission, with the distinction that emission from IRS 1 is optically thick, possibly originating in shocks, whereas emission from IRS 7A is optically thin, suggesting a collimated jet. Radio emission from the wide binary star IRS 5 has a substantial non-thermal component indicated by a negative spectral index, rapid variability, and strong Stokes- emission on one of days of observation. These characteristics are signs of magnetic activity close to the stellar photosphere. This suggests that at least one of the components of IRS 5 is free of absorbing ionized gas, and may have already reached an advanced stage.
Two infared-bright Class I candidates in the region, IRS 2 and IRS 9, remained undetected in radio. In accordance with previous results, R CrA (HAe) and the Class II star IRS 6 (CTTS) show weak radio emission. The so far unclassified bright radio source Brown 5 has a mildly negative spectral index, characteristic of optically thin gyrosynchrotron radiation. This source is likely to be an obscured Class III star or an extragalactic source.
The present observations are in rough agreement with the scheme of Gibb et al. (1999) where the dominant emission mechanism changes with the age of an YSO. It was found, however, that Class I stars form a very heterogeneous group as to their radio properties. This can be perhaps understood in terms of a rapid decline in the jet activity, which also changes the efficiency of free-free absorption. The results from IRS 7B suggest that energetic jets from very young protostars can give rise to non-thermal emission via shock acceleration.
The experiences from the R CrA stellar cluster have shown that observations in a wide range of wavelengths, in fact from X-rays to radio, are required to understand the nature of the youngest protostars (Forbrich et al. (2007); Groppi et al. (2007)). At the same it is evident that in the radio regime, higher sensitivity and angular resolution than available now are needed to detect a significant fraction of YSOs in a dense cluster like R CrA, and to study the physical processes which determine their evolution.
Acknowledgements.
We thank the ATCA staff for their help during the observations, and the referee for very helpful comments and suggestions. The Helsinki group acknowledges support from the Academy of Finland through grants 1117206 and 1210518.References
- (1) Anderson, I. M., Harju, J., Knee, L. B. G., & Haikala, L. K. 1997a, A&A, 321, 575
- (2) Anderson, I. M., Harju, J., & Haikala, L. K. 1997b, A&A, 326, 366
- Anderson et al. (1999) Anderson, I. M., Caselli, P., Haikala, L. K., & Harju, J. 1999, A&A, 347, 983
- André et al. (1996) André, P. 1996, in Radio Emission from the Stars and the Sun, ed. A. R. Taylor, & J. M. Paredes (San Francisco: ASP), ASP Conf. Ser. 93, 273
- André et al. (2000) André, P., Ward-Thompson, D., & Barsony, M. 2000, in Protostar and Planets IV, eds. V. Mannings, A. Boss, and S. Russell, Tuscon: Univ. Ariz. Press, p. 59
- Anglada (1996) Anglada, G. 1996, in Radio Emission from the Stars and the Sun, ed. A. R. Taylor, & J. M. Paredes (San Francisco: ASP), ASP Conf. Ser. 93, 3
- Anglada et al. (1998) Anglada, G., Villuendas, E., Estalella, R., et al. 1998, ApJ, 116, 2953
- Bertout (1983) Bertout, C. 1983, A&A, 126, L1
- Brown (1987) Brown, A. 1987, ApJ, 322, L31
- Casey et al. (1998) Casey, B. W., Mathieu, R. D., Vaz, L. P. R., et al. 1998, AJ, 115, 1617
- Chen & Graham (1993) Chen, W. P., and Graham, J. A. 1993, ApJ, 409, 319
- Choi & Tatematsu (2004) Choi, M., and Tatematsu, K. 2004, ApJ, 600, L55
- Curiel et al. (1987) Curiel, S., Cantó, J., & Rodríguez, L. F. 1987, Rev. Mexicana Astron. Astrofis., 14, 595
- Curiel et al. (1993) Curiel, S., Rodríguez, L. F., Moran, J. M., & Cantó, J. 1993, ApJ, 415, 191
- Dulk (1985) Dulk, G. A. 1985, ARA&A, 23, 169
- Feigelson et al. (1998) Feigelson, E. D., Carkner, L., and Wilking, B. A. 1998, ApJ, 494, L215
- Feigelson & Montmerle (1999) Feigelson, E. D., & Montmerle, T. 1999, ARA&A, 37, 363
- Felli et al. (1982) Felli, M., Gahm, G. F., Harten, R. H., Liseau, R., & Panagia, N. 1982, A&A, 107, 354
- Forbrich et al. (2006) Forbrich, J., Preibisch, Th., and Menten, K. M. 2006, A&A, 446, 155
- Forbrich et al. (2007) Forbrich, J., Preibisch, Th., Menten, K. M., et al. 2007, A&A, 464, 1003
- Forbrich & Preibisch (2007) Forbrich, J., and Preibisch, Th. 2007, A&A, 475, 959
- Gabányi et al. (2007) Gabányi, K. É., Marchili, N., Krichbaum, T. P., et al. 2007, A&A, 470, 83
- Ghavamian & Hartigan (1998) Ghavamian, P., & Hartigan, P. 1998, ApJ, 501, 687
- Gibb (1999) Gibb, A. G. 1999, MNRAS, 304, 1
- Groppi et al. (2004) Groppi, C. E., Kulesa, C., Walker, C., & Martin, C. L. 2004, ApJ, 612, 946
- Groppi et al. (2007) Groppi, C. E., Hunter, T. R., Blundell, R., & Sandell, G. 2007, ApJ, 670, 489
- Güdel (2002) Güdel, M. 2002, ARA&A, 40, 217
- Hamaguchi et al. (2005) Hamaguchi, K., Corcoran, M .F., Petre, R., et al. 2005, ApJ, 623, 291
- Harju et al. (20019) Harju, J., Higdon, J. L., Lehtinen, K., and Juvela, M. 2001, ASPC, 235, 125
- Hartigan & Graham (1987) Hartigan, P., & Graham, J. A. 1987, AJ, 93, 913
- Imanishi et al. (2001) Imanishi, K., Koyama, K., & Tsuboi, Y. 2001, ApJ, 557, 747
- Koyama et al. (1996) Koyama, K., Hamaguchi, K., Ueno, S., Kobayashi, N., & Feigelson, E. D. 1996, PASJ, 48, L87
- Knude & Høg (1998) Knude, J., & Høg, E. 1998, A&A, 338, 897
- Marraco & Rydgren (1981) Marraco, H. G., & Rydgren, A. E. 1981, AJ, 86, 1
- Massi et al. (2006) Massi, M., Forbrich, J., Menten, K. M., et al. 2006, A&A, 453, 959
- Martin (1996) Martin, S. C. 1996, ApJ, 473, 1051
- Neufeld & Hollenbach (1996) Neufeld, D. A., & Hollenbach, D. J. 1996, ApJ, 471, L45
- Neuhäuser & Preibisch (1997) Neuhäuser, R., & Preibisch, Th. 1997, A&A, 322, L37
- Nisini et al. (2004) Nisini, B., Antoniucci, S., & Giannini, T. 2004, A&A, 421, 187
- Nisini et al. (2005) Nisini, B., Antoniucci, S., Giannini, T., & Lorenzetti, D. 2005, A&A, 429, 543
- Nutter et al. (2005) Nutter, D. J., Ward-Thompson, D., and André, P. 2005, MNRAS, 357, 975
- Osten & Jayawardhana (2006) Osten, R. A., and Jayawardhana, R. 2006, ApJ, 644, L67
- Panagia & Felli (1975) Panagia, N., & Felli, M. 1975, A&A, 39, 1
- Phillips et al. (1996) Phillips, R. B., Lonsdale, C. J., Feigelson, E. D., and Deeney, B. D. 1996, AJ, 111, 918
- Pontoppidan et al. (2003) Pontoppidan, K. M., Fraser, H. J., Dartois, E., et al. 2003, A&A, 408, 981
- Reynolds (1986) Reynolds, S. P. 1986, ApJ, 304, 713
- Rodríguez et al. (1989) Rodríguez, L. F., Curiel, S., Moran, J. M., et al. 1989, ApJ, 346, L85
- Sault et al. (1995) Sault R. J., Teuben P. J., & Wright M. C. H. 1995, in Astronomical Data Analysis Software and Systems IV, ed. R. Shaw, H. E. Payne, & J. J. E. Hayes, ASP Conf. Ser., 77, 433
- Stamatellos et al. (2007) Stamatellos, D., Ward-Thompson, D., Whitworth, A. P., and Bontemps, S. 2007, A&A, 462, 677
- Suters et al. (1996) Suters, M.; Stewart, R.T., Brown, A., Zealey, W. 1996, AJ, 111, 320
- Taylor & Storey (1984) Taylor, K .N. R, & Storey, J. W. V. 1984, MNRAS, 209, 5P
- Wang et al. (2004) Wang, H., Mundt, R., Henning, Th., and Apai, D. 2004, ApJ, 617, 1191
- White et al. (1992) White, S. M., Pallavicini, R., & Kundu, M. R. 1992, A&A, 257, 557
- Wilking et al. (1986) Wilking, B. A., Taylor, K. N. R., & Storey, J. W. V. 1986, AJ, 92, 103
- (55) Wilking, B. A., Green, T. P., Lada, C. J., Meyer, M. R., & Young, E. T. 1992, ApJ, 397, 520
- Wilking et al. (1997) Wilking, B. A., McCaughrean, M. J., Burton, M. G., et al. 1997, AJ, 114, 2029
- Wilking et al. (1999) Wilking, B. A., Greene, T. P., and Meyer M. R. 1999, AJ, 117, 469
- Wilking et al. (2001) Wilking, B. A., Bontemps, S., Schuler, R. E., et al. 2001, ApJ, 551, 357
- Winkler & Newman (1980) Winkler, K.-H. A., & Newman, M. J. 1980, ApJ, 236, 201