A kpc-scale X-ray jet in the BL Lac source S5 2007+777
Abstract
X-ray jets in AGN are commonly observed in FRII and FRI radiogalaxies, but rarely in BL Lacs, most probably due to their orientation close to the line of sight and the ensuing foreshortening effects. Only three BL Lacs are known so far to contain a kpc-scale X-ray jet. In this paper, we present the evidence for the existence of a fourth extended X-ray jet in the classical radio-selected source S5 2007+777, which for its hybrid FRI/II radio morphology has been classified as a HYMOR (HYbrid MOrphology Radio source). Our Chandra ACIS-S observations of this source revealed an X-ray counterpart to the 19′′-long radio jet. Interestingly, the X-ray properties of the kpc-scale jet in S5 2007+777 are very similar to those observed in FRII jets. First, the X-ray morphology closely mirrors the radio one, with the X-rays being concentrated in the discrete radio knots. Second, the X-ray continuum of the jet/brightest knot is described by a very hard power law, with photon index , although the uncertainties are large. Third, the optical upper limit from archival HST data implies a concave radio-to-X-ray SED. If the X-ray emission is attributed to IC/CMB with equipartition, strong beaming (=13) is required, implying a very large scale (Mpc) jet. The beaming requirement can be somewhat relaxed assuming a magnetic field lower than equipartition. Alternatively, synchrotron emission from a second population of very high-energy electrons is viable. Comparison to other HYMOR jets detected with Chandra is discussed, as well as general implications for the origin of the FRI/II division.
1 Introduction
Multiwavelength imaging spectroscopy of kpc-scale jets in AGN provides direct clues to their structure and emission processes. Traditionally, the information about jet structure first became available in the radio band where the highest angular resolutions are achieved (Bridle & Perley 1984). These observations established that jets may extend on quite substantial scales, with components being ejected from the core and propagating at relativistic velocities; the radio emission is understood as synchrotron radiation from relativistic electrons accelerated via shocks or turbulence.
Optical observations from the ground and then with HST established that many jets emit at these wavelengths, implying energies and thus acceleration events far from the black hole(Macchetto et al. 1994). The advent of the Chandra X-ray Observatory and its discovery of ubiquitous X-ray emission from radio jets has provided a further tool in the study of these systems.
Today, after almost a decade of Chandra observations, it is clear that jet morphologies and spectral properties at X-rays are a function of their power (see Sambruna, Maraschi, & Tavecchio 2008 for a recent review). Powerful jets hosted by FRII radio galaxies are generally narrow and long, extending up to Mpc scales; their emission is concentrated in discrete knots with good spatial correspondence between the radio and the X-rays at least in the inner regions (Sambruna et al. 2004, S04 in the following; Marshall et al. 2005). The SEDs of individual bright knots often show two components: a synchrotron one extending from radio to optical-UV, and a second one uprising in the X-rays whose origin is still debated. A popular scenario is inverse Compton on the CMB photons (IC/CMB), which implies relativistic motion on large scales (S04).
Low-power Chandra jets are found in FRIs (Worrall, Birkinshaw, & Hardcastle 2001). They are shorter than their powerful counterparts, terminating a few kpc from the core where the radio emission “flares” out in a fan-like structure. The X-ray flux lies on the extrapolation of the synchrotron radio-to-optical emission and its soft (photon index 2) spectrum implies a cutoff in or below the X-ray band. Remarkably, jets of intermediate powers exhibit intermediate properties between FRI and FRIIs (Birkinshaw, Worrall, & Hardcastle 2002, Pesce et al. 2001, Sambruna et al. 2007). However, very little is known on the large-scale X-ray emission from jets in BL Lacs, the more aligned versions of FRI sources. This is likely due to foreshortening effects associated to the close alignment of the jet, which prevent the finding of relatively extended and bright radio jets suitable for Chandra studies. One exception is S5 2007+777, which exhibits a bright 19′′-long radio jet with multiple knots and a hybrid FRI-II morphology (see below). We observed S5 2007+777 with Chandra in AO5 and detected the X-ray counterpart of the radio jet, as discussed in this paper.
The paper is structured as follows. The source properties are described in § 2, and the observations in § 3. The results of the imaging and spectroscopy analysis for the core and the jet are given in § 4, while discussion and conclusions follow in § 5. Throughout this paper, a concordance cosmology with H km s-1 Mpc-1, =0.73, and =0.27 (Spergel et al. 2003) is adopted. With this choice, 1′′ corresponds to 4.8 kpc. The energy spectral index, , is defined such that .
2 The source
The core of S5 2007+777 is a classical radio-selected BL Lac from the 1 Jy sample of Stickel et al. (1995), and a superluminal VLBI source (Witzel et al. 1988; Gabuzda et al. 1994). Its redshift, , was derived from weak [OII] and [OIII] emission lines (Stickel et al. 1989). Variability on time scales of a few days was observed from the core at 100m, and at radio and optical frequencies (Peng et al. 2000). Previous ROSAT observations of the core showed a power-law emission with (Urry et al. 1996), while there is no detection at gamma-rays with EGRET (Hartman et al. 1999).
S5 2007+777 has a core-dominated radio morphology in VLA maps at 1.5 GHz (Antonucci et al. 1986), and on sub-pc scales with the VLBI (Perez-Torres et al. 1994). A prominent edge-brightened lobe is present on the Eastern side of the nucleus at 11′′, whereas the Western side exhibits an 19′′-long, knotty jet (see Fig. 1) which ends with no clear hot spot. The radio morphology of S5 2007+777 - with an edge-brightened lobe on the Eastern side and a core-jet morphology on the Western side - led to its classification as a HYMOR (HYbrid MOrphology Radio source; Gopal-Krishna & Wiita 2000), a relatively rare class of sources. Their existence has been taken to argue in favor of the role of the ambient gas in determining the FRI-II division, as opposed to purely the properties of the central engine.
Indeed, the core and jet 4.9 GHz luminosities in S5 2007+777 are and ergs/s/Hz, respectively. The magnitude of the host galaxy of S5 2007+777 is M (Urry et al. 2000). Thus, S5 2007+777 lies at the boundary between FRIs and FRIIs in the revised Owen & Ledlow diagram (Owen & Ledlow 1994) in Figure 7 of Urry et al. (2000).
We derived limits to the inclination of the radio jet using available radio information. S5 2007+777 is a superluminal VLBI source (Witzel et al. 1988; Gabuzda et al. 1994) with a single jet feature observed in the 1980’s moving at 4.7c (converting to our adopted cosmology). More recent VLBA observations (Homan et al. 2001; Kellermann et al. 2004) show at most, subluminal motions within the first 2 mas of the jet. As discussed in Homan et al. (2001), the earlier observations probed larger scale emissions and are not necessarily contradictory to the newer observations.
The superluminal feature constrains the VLBI scale jet to be aligned within 24∘ to our line of sight. The parsec-scale jet (position angle, PA = -81∘ to -100∘; Gabuzda et al. 1994) is aligned to within 20∘–30∘ (projected) of the X-ray detected kpc-scale jet knots (PA -100∘ to -110∘; Figure 1). The intrinsic bend required to produce the projected misalignments is less than (20–30∘)x sin(24∘) = 8∘–12∘. Therefore, the kpc-scale jet is aligned to 32∘–36∘of our line of sight. This limit on the inclination angle implies a relatively large deprojected jet length, 150 kpc.
3 Observations
3.1 Chandra
Chandra observed S5 2007+777 on May 23, 2005. The live time was 36 ks
yielding 33 ks of useful exposure time after removing flaring
background events that occured during the observations. The background
light curves were extracted from source-free regions on the same chip
of the source. The data were analyzed using standard screening
criteria. In particular we used the version 3.3 of the
CIAO software package and the calibration files provided
by the Chandra X-ray Center (CALDB v.3.2.1).
The source was observed at the aim point of the S3 chip of the ACIS-S
detector. Since it was expected to have a bright core, the 1/2
subarray mode (frame time of 1.8 s) was used to reduce the effect of
the nuclear pileup. In a circular region of radius 1′′ the
counts rates of the core of S5 2007+777 is 0.210 0.003 c/s. Despite the
precautions, according to PIMMS the estimated pileup percentage
is non-negligible, 22%, yielding an intrinsic (pileup-corrected)
net count rate of 0.34 c/s. The X-ray image shows a readout streak on
the S3 chip that has been removed by the destreak tool, for
imaging purpose. The core flux and spectrum was extracted using a
circular region centered on the pixel with the highest counts with
radius 3′′. The background was chosen in a panda region on
the same CCD, centered on the source and free of the jet and
serendipitae sources.
For the detected knots, fluxes and spectra were extracted from
ellipses centered on the radio (1.49 GHz) positions and with axis
lengths as listed in Table 1. The corresponding aperture corrections
are in the range 1.01–1.1. In all cases the background was evaluated
in panda regions centered on the nucleus and with inner and
outer radii such as to match the width of the source extraction
region. The choice of this background region ensures that the
contribution of the wings of the PSF as a function of azimuth are
averaged. Figure 1 shows the ACIS image of the source. The net count
rates of the knots are reported in Table 1. The uncertainties on the
X-ray counts, , were calculated according to the formula
, where and
are the uncertainties of the source and the re-scaled by
area background, respectively. In the regime of low counts, to
evaluate the uncertainties we adopted the formula in Gehrels (1986):
.
The ACIS spectra of the core and jet have been analyzed within
XSPEC v.11.3.2. For the jet, spectra were extracted for knot
K8.5, where 40 counts were obtained, and for the full jet (101
counts). For the latter, a rectangular box of dimensions 15.5′′x3.5′′ was used. The spectrum of the core and full jet were
grouped so that each new energy bin had at least 20 counts to enable
the use of the statistics. Errors quoted throughout are
90% for one parameter of interest (=2.7). The spectrum
of knot K8.5, where less than 100 counts were detected, was not
rebinned and it was analyzed with the C-statistic.
Comparing the jet’s total counts to the core’s shows that the jet accounts for only 1% of the total X-ray emission from S5 2007+777. Thus, previous X-ray observations at lower angular resolution were dominated by the unresolved nuclear source emission.
3.2 HST
To constrain the level of optical flux from the jet, we observed S5 2007+777 with HST on May 29, 2005 (GO program 10343). We selected the Advanced Camera for Surveys (ACS; Sirianni et al. 2005) because of the observing efficiency of the WFC camera, and utilized the F814W filter (broad I; pivot wavelength of 8060Å). Over the one orbit allocation, a total exposure of 2763 sec was obtained, split evenly between 3 individual exposures. We additionally obtained from the HST archive a WFPC2 F702W (440 sec; pivot wavelength 6917Å) snapshot image of S5 2007+777 (Scarpa et al. 2000; Urry et al. 2000).
We found no obvious optical counterparts to the radio/X-ray jet knots in the HST images pre- and post-subtraction of the central quasar. Although there are apparent optical excesses in the vicinity of the inner knots (Figure 1), the count rate measured in 1515 pixel boxes centered on the radio peaks are within 1 of the average count rates in adjacent apertures. To derive optical upper limits, we converted these measurements of the fluctuations in the average count rates to flux densities using the inverse sensitivity measurements contained in the PHOTFLAM keyword.
3.3 Radio
To study the radio jet, we obtained matched resolution (1) VLA datasets at 1.49 GHz (A-configuration) and 4.86 GHz (B-configuration) from the NRAO archive. The 1.49 GHz data is from Feb 1985 (program AL41; previously published in Antonucci et al. 1986) and has a total exposure of 35 min. The () coverage was predominantly in the East-West directions, amounting to an elongated North-South beam and resulting in relatively bright artifacts in this direction like the feature just South of the radio core.
The 4.86 GHz data were obtained as part of a variability monitoring campaign of S5 2007+777 in 1997 (Peng et al. 2000). To produce the image, we combined their observations from March 1–7, amounting to about an hour of total exposure time. Peng et al. (2000) found two epochs where the flux densities differed by more than 1%) of the average during this period (but only up to 2–3). We found little difference in the images produced excluding these two exposures and that produced from all of the data so retained the full dataset.
4 Results
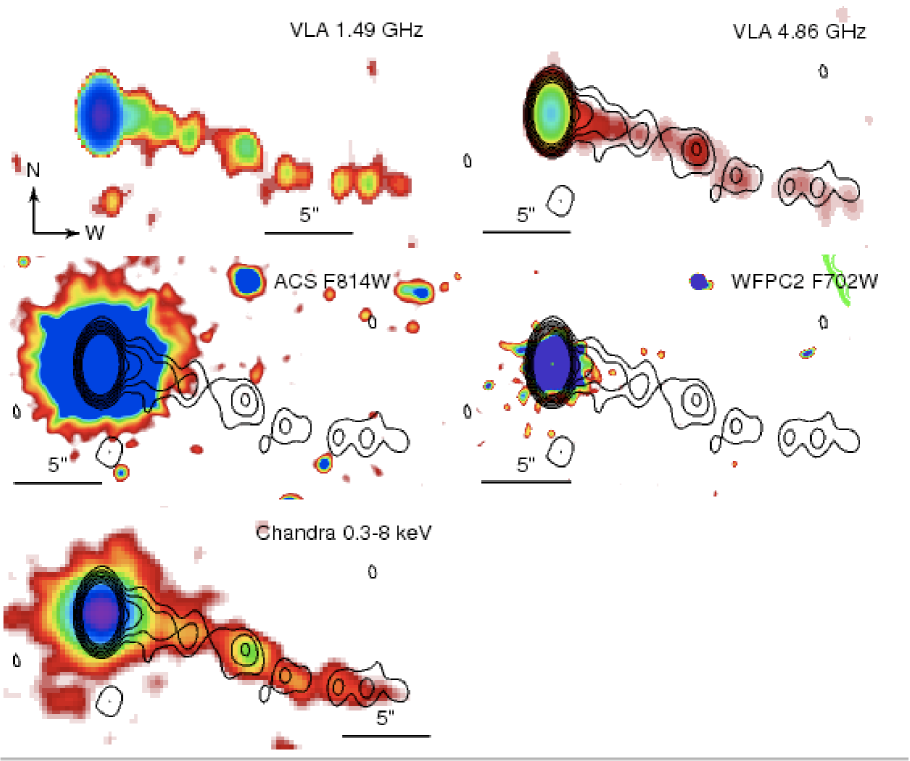
The 0.3–8 keV image of S5 2007+777 is shown in Figure 1, together with the radio and optical data. A prominent jet is present in the X-ray image, in addition to the unresolved core. Below we discuss separately the X-ray data for the core and the X-ray and multiwavelength observations of the jet.
4.1 The Core
Inspection of the ACIS-S images suggests that the core is unresolved
and consistent with a point source. For a more quantitative analysis
we extracted the radial profiles of the core region, using a series of
concentric annuli and panda regions centered on the core and
extending out to 360′′ on the ACIS CCD, with the jet
excised. For the extraction procedure, see Donato et al. (2004). The
jet and field point sources contributions were excluded from the
extraction regions. The ACIS spectrum of the core (see below) was
assumed.
The radial profiles are well fitted by the instrumental PSF, with no need for extra components. In particular, there is no evidence for excess emission over the wings of the PSF which could be attributed to diffuse X-ray emission, contrary to other sources at similar redshifts (Sambruna et al. 2007). Thus, any diffuse circumnuclear emission is confined within 10′′, or 48 kpc.
No flux variability is detected from the core within the 33 ks
exposure. A total of 7,800 counts were measured in 0.3–8 keV,
sufficient to perform spectral analysis. The ACIS-S spectrum of the
core is well fitted by a single power law with Galactic
NH=8.58 cm-2. To account for residual pile-up (see
§ 3.1) the multiplicative component pileup was included in the
model. For the latter, the following parameters (fixed) were assumed:
fr_time=1.8, max_ph=5, g0=1, and
nregions=1. The free parameters were
psffrac=0.96, .
For the power law, the fitted photon index is and the observed flux is F erg cm-2 s-1. The slope is consistent within the large uncertainties with the ROSAT value (Urry et al. 2006), while the extrapolated 0.3–8 keV flux from the latter data is within a factor 2.
4.2 The Jet
4.2.1 The Images
Figure 1 shows a montage of the images of the jet at different
wavelengths, in order of decreasing wavelength. The 1.49 GHz radio
contours from the first image at 1.5′′x0.9′′ resolution
are overlaid on all the following ones; the 4.86 GHz image was
convolved with the same beam. The Chandra image in the energy band
0.3–8 keV was rebinned by a factor 0.5 and adaptively smoothed with
csmooth in CIAO using a Gaussian function of standard
deviation 2 pixels ( 0.5′′). Assuming a typical value for
the ACIS standard deviation of 0.8′′, the final resolution is
1.2′′, comparable to the radio. To obtain a similar
resolution in the optical, the ACS data were smoothed with
fgauss in FTOOLS with a standard deviation of 7 pixels,
or 0.35′′, with a corresponding FWHM ′′.
The most striking result from Figure 1 is the detection of an X-ray counterpart to the radio jet, with very similar morphology at the two wavelengths. Such a match between radio and X-ray morphology is rarely found in FRIs but can be observed in powerful FRIIs (e.g., 1354+195; S04; Schwartz et al. 2007). However, in a significant number of FRII jets the X-ray-to-radio flux ratios decrease along the jet (S04; Sambruna et al. 2006). There is no detection of the jet in the optical.
The radio emission of the jet consists of several discrete knots extending SW of the core. In this paper we adopt the conventional nomenclature for the knots Kx.x where x.x is the distance in arcsec of the knot from the core. A total of 5 radio knots are present, for an overall extent of 19′′, with the brightest radio knot being located mid-stream at 8.5′′. At 1.49 GHz, the jet extends rather linearly until knot K11.1, after which a bend is present in the W direction with a position angle change of ∘.
In the ACIS-S image the radio jet exhibits X-ray emission from every knot, fading at the end of the radio jet. The brightest X-ray counterpart, with 40 net counts or 43% of the total jet counts (Table 1), is knot K8.5, which is also the brightest in the radio. The X-ray counts from the knots are listed in Table 1.
A weak radio counterlobe is present in the radio images of S5 2007+777 (not shown here). There is no X-ray or optical detection of neither the lobe or its hotspot.
To better quantify the jet properties we extracted profiles along the main jet axis (longitudinal profiles) at three wavelengths: radio at both 1.49 GHz and 4.86 GHz, and X-rays (0.3–8 keV). The images were reprocessed to ensure similar resolutions (0.9′′) at all wavelengths as explained above. The profiles were extracted by collapsing the flux of the jet onto a box 19′′-long and 1.5′′-wide. The profiles of the jet are shown in Figure 2.
The radio core is bright and the VLA images are dynamic range limited. With the overall faintness of the jet, the details of the fainter radio features are uncertain as evident from the slightly differing profiles between the two radio images. In this respect, the knot positions are based on the Chandra data, and regions where there are apparently multiple radio knots, like K15.9, are defined as a single region. The low signal-to-noise ratio Chandra data for the jet makes it difficult to make definitive statements about possible radio/X-ray offsets for all but the brightest knot, K8.5. Here, there is a possible centroid shift by 0.5′′ with the X-ray peak downstream of the radio one.
4.2.2 The spectra
ACIS spectra were extracted for the full jet and for the brightest knot K8.5, following the procedure described in § 2.1. The ACIS spectra of both the jet and K8.5 are consistent with a single power law with Galactic column density; the parameters are listed in Table 2. The fitted photon indices are hard, 1.0, albeit within large uncertainties. The jet emission is thus harder than the nuclear emission, similar to what is observed in the intermediate FRI/II 3C 371 and PKS 2201+044 (Sambruna et al. 2007).
We also tried a thermal model fit to the ACIS spectra of the jet. For the full jet, a thermal model is equally acceptable, but at the fitted temperature, kT=64 keV, it effectively mimicks a power law. Similar results are found for knot K8.5.
The observed 0.3–8 keV fluxes for the core and the jet are listed in
Table 2. Table 1 reports the monochromatic flux densities at 1 keV for
the individual knots. The flux densities were calculated with
PIMMS using the knot’s count rate in column 2 and assuming a
power-law spectrum with photon index and Galactic
NH. All fluxes are background-subtracted and corrected for finite
aperture effects.
Also listed in Table 1 are the radio energy indices for each knot calculated between 1.49 and 4.86 GHz. With 10-15 errors in the individual flux densities, the errors in the two point spectral indices are 0.15-0.2 (larger for the fainter features). This means the spectrum of the radio jet is basically constant within the joint errors.
Using the flux densities at 4.86 GHz and 1 keV we calculated the radio-to-X-ray index, . The latter is reported in the last column of Table 1. For all knots , fully consistent with the distribution observed for FRII jets (S04). There are no variations of along the jet of S5 2007+777, at odds with most FRIIs (e.g., Figure 5 in S04); whereas in S5 2007+777 the ratio is remarkably constant ( within 0.1 of 0.8).
5 Discussion
5.1 X-ray emission process
With its one-to-one correspondence between the X-ray and radio emission, the Chandra jet of S5 2007+777 strongly resembles that of powerful FRIIs (S04). As in FRIIs, this morphological similarity provides first clues to the origin of the high-energy emission. A natural possibility is that the X-rays are produced via inverse Compton scattering of seed photons off the same electrons responsible for the synchrotron radio emission. If the X-rays were the high-energy tail of the radio synchrotron emission, the knot intensity would be expected to decrease, and the continuum to soften, with respect to the radio emission, unless reacceleration occurs throughout the volume. Indeed in 3C 371 and PKS 2201+041 where the synchrotron model provides an adequate description of the SEDs the X-ray spectra clearly steepen along the jet (Sambruna et al. 2007).
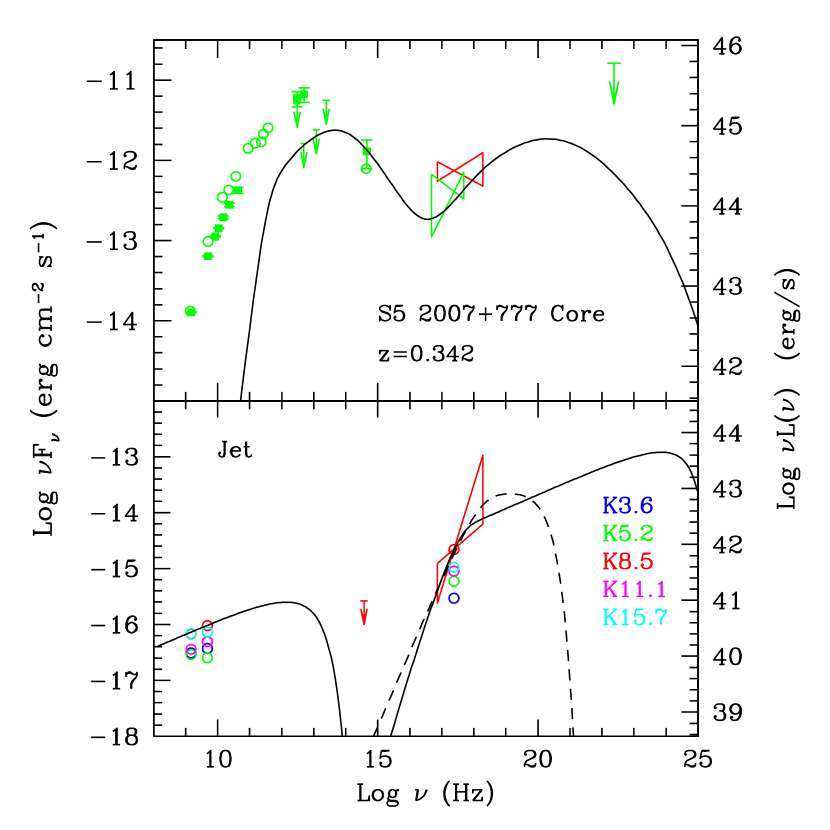
To better quantify the properties of the X-ray jet of S5 2007+777 and derive physically interesting parameters, we assembled its Spectral Energy Distribution (SED) from radio to X-rays using the results in Table 1 and 2. The SEDs of the various knots are shown in the bottom panel of Figure 3. For knot K8.5 we also plot the X-ray spectrum and a 3 upper limit to the optical emission derived from the ACS data. Taking into account the upper limit in the optical, the SED for knot K8.5 appears concave; furthermore, the X-ray continuum appears hard, implying that a large fraction of the emission occurs above the X-ray energy band and is currently unseen.
The top panel of Figure 3 shows the SED of the core of S5 2007+777. The latter was assembled using literature data (from NED) as well as the ACIS spectrum from this work. The previous ROSAT continuum is also plotted for comparison (Urry et al. 1996), as well as the EGRET upper limit to the GeV flux. The core optical-to-X-ray SED appears concave, as commonly observed in intermediate-luminosity, low-energy peaked BL Lacs. The X-ray emission from the core is weaker compared to the radio by a factor 10. In the core SED the fraction of luminosity contained in the low- and high-energy humps is estimated to be roughly similar, while the jet is clearly dominated energetically by the high-energy component.
To model the SEDs of both the core and jet, we assumed a synchrotron + inverse Compton (IC) model. The basics of this model are described in Maraschi & Tavecchio (2003) and Tavecchio et al. (2000). The solid lines in the panels of Figure 3 represent the closest attainable fit. The corresponding parameters are reported in Table 3. A different origin of the seed photons for the IC process was assumed in the core and the jet.
In the core, seed photons are generally provided - in BL Lacs like S5 2007+777 - both by the synchrotron photons themselves (SSC) and ambient photons external to the jet (EC). The lack of strong thermal features in the optical, together with the EGRET upper limit and the slope of the X-ray continuum, suggests a limited importance of the EC component and thus we consider only SSC emission, with the result that the high-energy component in the core SED cuts-off above a few GeV. We also choose to reproduce a relatively low state consistent with the IR upper limits from IRAS, while the simultaneous observations of Peng et al. (2000) refer to a higher state. The similarity of the multiwavelength jet to FRIIs suggests that, as in the latter sources, the X-ray emission from the S5 2007+777 jet could originate from IC scattering of the CMB photons off the jet electrons (for criticisms to this intepretation see Harris & Krawczynski 2006). The hard X-ray emission can be reproduced assuming that it belongs to the low-energy tail of the IC/CMB component: this choice implies a relatively large value for the minimum energy of the relativistic electrons, , compared to the “typical” value for FSRQs (S04).
A Doppler factor of is derived with the IC/CMB model, assuming equipartition between electrons and magnetic field. This implies that the jet is observed under a rather small viewing angle, ∘–5∘, which, in turn, translates into a deprojected length of the jet of Mpc. This length is comparable to those of the FRII jets hosted by quasars (S04), estimated through IC/CMB modeling. Considering that the jet of S5 2007+777 has a clear FRII morphology and that the radio power of the jet ( erg s-1 Hz-1) is not too far from that of the FRII sources of S04 (clustering around erg s-1 Hz-1), a length of 1 Mpc could be in principle acceptable. A possible way to reduce the value of the Doppler factor, thus increasing the required viewing angle, is to relax the equipartition condition, allowing for the electrons to dominate over the magnetic field. For example, to get an inclination angle of 20∘, the electron density would be a factor larger than the magnetic density. The IC/CMB model for the jet is plotted in Figure 3 as a solid line.
An alternative possibility is that the X-ray emission is instead produced by synchrotron radiation from a second population of relativistic electrons with very high maximum energy. The latter could coexist with the radio emitting electrons (e.g., Uchiyama et al. 2007) or belong to another region of the jet (see e.g. Jester et al. 2006 for the jet of 3C 273). Stawarz & Ostrowski (2002) proposed that a turbulent acceleration mechanism operating in a boundary layer around the jet could lead to a piled-up energy distribution, whose peaked synchrotron emission can be quite hard (up to ). The emission is expected to peak at X-rays if the characteristic velocity of the magnetic turbulence is of the order of the Alfven velocity. A synchrotron model along these lines is shown in Figure 3 (dashed line) and the parameters are reported in Table 3. We assume two cospatial electron populations. The first one (S1) follows a power law energy distribution up to and is responsible for the radio emission. The X-ray emission is reproduced assuming a power-law electron distribution (S2) extending from to . The particle energy density of the latter is negligible with respect to that of S1, which is in equipartition with the the magnetic energy density.
Thus, the X-ray emission observed from the jet of S5 2007+777 and others (S04) could be explained by the synchrotron emission of high-energy electrons piled-up in the jet boundary layer. On the other hand, this solution is largely underconstrained. Moreover, the good coincidence between the radio and the X-ray emission suggests a close relation between the radio emitting and X-ray emitting relativistic electrons in this source, lending support to the IC/CMB interpretation.
An interesting feature of the IC/CMB model is that it predicts relatively large emission at gamma-rays, with a very hard spectrum at GeV energies, while the synchrotron model has a cutoff at a few MeV (as discussed for 3C 273 by Georganopoulos et al. 2004). The exact level and position of the IC/CMB peak depends on the value of maximum energy of the relativistic electrons, which is not well constrained due to the lack of data between the radio and optical band. With the conservative assumption adopted here that the peak of the synchrotron component lies around Hz, the jet emission above a few GeV is comparable to the predicted, softer emission from the core. Conceivably future GLAST observations of S5 2007+777 during core low-states could in principle discriminate the origin of the jet X-ray flux on the basis of a detection at GeV energies with a hard spectrum. However, at the predicted flux level, long integration times are necessary for a detection, thus this test does not look feasible for S5 2007+777 until after a few years of the LAT operations. A more promising source is 3C 273 (Georganopoulos et al. 2004).
5.2 Comparison with other HYMOR jets detected with Chandra
The radio morphology of S5 2007+777 - with a lobe and hotspot on the Eastern side and a core-jet morphology on the Western side - has led to its classification as a HYMOR (HYbrid MOrphology Radio source; Gopal-Krishna & Wiita 2000). The hybrid morphology has been taken to demonstrate that the origin of the FRI / FRII division is also to ascribe to the environment, with gas distribution asymmetries on the two sides of the nucleus being responsible for different jet fates (Gopal-Krishna & Wiita 2000). This would rule out models attributing the origin of the dichotomy solely to different central engines or jet composition in the two classes.
Interestingly, from the list of 6 sources compiled by Gopal-Krishna & Wiita (2000) two other HYMOR jets were observed and detected with Chandra. These are the z=0.055 BL Lac PKS 0521-365 (Birkinshaw et al. 2002) and the z=0.240 BAL quasar PG 1004+130 (Miller et al. 2006). The radio morphology of both sources is strongly reminiscent of S5 2007+777, with a radio lobe + hotspot on one side of the core and a jet without lobe/hotspot on the other. However, the X-ray properties are somewhat different.
In PKS 0521–365 the X-ray observations reveal diffuse thermal emission around the core on the host galaxy halo’s scales (few kpc). The X-ray jet emission peaks up-stream of the radio knot at a few kpc from the core, and is described by a steep 2 power law model indicative of synchrotron emission (Birkinshaw et al. 2002). Overall, the X-ray jet and environment of PKS 0521–365 resemble strongly an FRI. Note that at the lower redshift of this source we are probing relatively smaller scales than in S5 2007+777. Also, since both weak broad and narrow optical emission lines are detected in PKS 0521–365 over the variable non-thermal continuum (Danziger et al. 1979), beaming is likely to be modest in this source. Indeed, a fit of the core SED provides an inclination angle 30∘ (Pian et al. 1996).
A more appropriate and interesting comparison is between S5 2007+777 and PG 1004+130 as their redshifts are similar. In the BAL quasar X-ray emission from the SE radio jet was detected with Chandra (Miller et al. 2006) at 8′′ (30 kpc) from the core. As noted by Miller et al. (2006), the X-ray emission is aligned with the FRI jet but displaced upstream with respect to the radio emission by about 5′′ which could indicate deceleration if the X-ray emission is attributed to the IC/CMB process. On the contrary, in S5 2007+777 the offset between the X-ray and radio emission is negligible and if any, in the opposite direction - the radio precedes the shorter wavelengths.
A possible difference between the two sources is the slope of the X-ray continuum emission of the two jets. In PG 1004+130 the latter is , while for S5 2007+777 we found a flatter value (but within large 1 uncertainties), . In both jets, the optical upper limit, lying below the extrapolation from radio to X-rays, implies a concave SED. Using the ratio of the core radio to optical flux, Miller et al. derive an inclination angle 45∘ for PG 1004+130, and infer that beaming is not affecting the jet properties. An IC/CMB fit to the SED yields and an inclination angle 19∘ (Miller et al. 2006). Based on this value for the angle, Miller et al. dismiss an IC-CMB origin for the X-ray emission, and prefer to model the X-ray emission with synchrotron from a second particle population in the jet.
Note, however, that in the 4.9 GHz map shown by Gopal-Krishna & Wiita (their Fig. 1c) the radio jet of PG 1004+130 appears much more prominent and better collimated than in a typical FRI suggesting that some amount of beaming could be present. Indeed, the method used by Miller et al. (2006) for estimating the inclination angle, based on the core radio-to-optical luminosity ratio, RV (Wills & Brotherton 1995) and core-to-lobe flux ratio, suffers from very large uncertainties. We thus suggest that the IC/CMB model discussed by Miller et al. (2006) implying modest beaming () and a relatively large angle, 20∘, could be viable. Weak beaming is also inferred from the X-ray properties of the jet in PKS 0521–365 (see above). Thus, S5 2007+777 stands out among the HYMOR jets probed by Chandra as the source with the largest beaming if the IC/CMB model is adopted. This result is consistent with its core classification as a BL Lac object.
In this context, there are some interesting implications for the cause of the FRI/II division. The general tendency of the X-ray emission from bona fide FRII jets to fade before the end of the radio emission can be naturally interpreted as deceleration of the jet bulk motion. However, in the context of an IC/CMB origin of the X-ray emission, if deceleration is due to entrainment of external matter (Tavecchio et al. 2006; but see Hardcastle 2006), the length a jet can travel before becoming subrelativistic depends on the transported bulk kinetic energy. It follows that in similar gas environments more powerful jets will remain relativistic over larger scales. Thus, a combination of interactions with ambient gas and jet power are required to account for the different FRI/FRII morphologies, confirming earlier findings (Owen & Ledlow 1994). From this perspective, it may not be coincidental that hybrid morphologies are found at intermediate powers, when relatively small changes in the environment can cause deceleration to set in at different scales.
6 Conclusions
We have analyzed and discussed the kpc-scale radio and X-ray jet in the classical radio-selected BL Lac S5 2007+777. Its properties appear peculiar, both for the close correspondence of X-ray and radio morphologies and for its hard X-ray continuum. Moreover, if an IC/CMB origin for the jet X-ray emission is accepted, the jet intrinsic size appears rather extreme. Relaxing the equipartition condition, however, ameliorates this difficulty.
Among the HYMOR jets detected with Chandra, S5 2007+777 stands out as unusual in its similarity to powerful FRIIs, and in possibly requiring the highest beaming. On the other hand, a synchrotron origin for the X-ray jet, can not be ruled out on the basis of the present data.
References
- (1)
- (2) Antonucci, R. R. J., Hickson, P., Olszewski, E. W., & Miller, J. S. 1986, AJ, 92, 1
- (3)
- (4) Birkinshaw, M., Worrall, D.M., & Hardcastle, M.J. 2002, MNRAS, 335, 142
- (5)
- (6) Bridle, A.H. & Perley, R.A. 1984, ARA&A, 22, 319
- (7)
- (8) Danziger, I.J., Fosbury, R.A.E., Goss, W.M., & Ekers, R.D. 1979, MNRAS, 188, 415
- (9)
- (10) Gabuzda, D. C., Mullan, C. M., Cawthorne, T. V., Wardle, J. F. C., & Roberts, D. H. 1994, ApJ, 435, 140
- (11)
- (12) Gopal-Krishna & Wiita, P.J. 2000, A&A, 363, 507
- (13)
- (14) Hardcastle, M.J. 2006, MNRAS, 366, 1465
- (15)
- (16) Hartman, R.C. et al. 1999, ApJS, 123, 79
- (17)
- (18) Harris, D.E. & Krawczynski, H. 2002, ApJ, 565, 244
- (19)
- (20) Homan, D. C., Ojha, R., Wardle, J. F. C., Roberts, D. H., Aller, M. F., Aller, H. D., & Hughes, P. A. 2001, ApJ, 549, 840
- (21)
- (22) Jester, S., Harris, D.A., Marshall, H.L., & Meisenheimer, K. 2006, ApJ, 648, 900
- (23)
- (24) Kellermann, K. I., et al. 2004, ApJ, 609, 539
- (25)
- (26) Marshall, H. L. et al. 2005, ApJS, 156, 13
- (27)
- (28) Miller, B. P. et al. 2006, ApJ, 652, 163
- (29)
- (30) Owen, F.N. & Ledlow, M.J. 1994, in ASP Conf. Series 54, The Physics of Active Galaxies, ed. G.V.Bicknell, M.A. Dopita, & J.P. Quinn (San Francisco: ASP), 31
- (31)
- (32) Peng, B. et al. 2000, A&A, 353, 937
- (33)
- (34) Perez-Torres, M.A., Marcaide, J.M., Guirado, J.C. & Ros, E. 2004, A&A, 428, 847
- (35)
- (36) Pesce, J.E., Sambruna, R.M., Tavecchio, F., Maraschi, L., Cheung, C.C., Urry, C.M., Scarpa, R. 2001, ApJ, 556, L79
- (37)
- (38) Pian, E. et al. 1996, ApJ, 459, 169
- (39)
- (40) Sambruna, R.M., Maraschi, L., & Tavecchio, F. 2008, in Proceedings of the HEPRO meeting in Dublin, Ireland, September 2007, in press
- (41)
- (42) Sambruna, R.M. et al. 2007, ApJ, 670, 74
- (43)
- (44) Sambruna, R.M. et al. 2006, ApJ, 641, 717
- (45)
- (46) Sambruna, R.M., Gambill, J.K., Maraschi, L., Tavecchio, F., Cerutti, R., Cheung, C.C., Urry, C.M., & Chartas, G. 2004, ApJ, 608, 698 (S04)
- (47)
- (48) Sambruna, R.M., Maraschi, L., Tavecchio, F., Urry, C.M., Cheung, C.C., Chartas, G., Scarpa, R., & Gambill, J.K. 2002, ApJ, 571, 206
- (49)
- (50) Scarpa, R., Urry, C. M., Falomo, R., Pesce, J. E., &
- (51) Treves, A. 2000, ApJ, 532, 740
- (52)
- (53) Schwartz, D.A. et al. 2007, A&SS, 311, 341
- (54)
- (55) Sirianni, M., et al. 2005, PASP, 117, 104
- (56)
- (57) Spergel, D. N., et al. 2003, ApJS, 148, 175
- (58)
- (59) Stawarz, L. & Ostrowski, M. 2002, ApJ, 578, 763
- (60)
- (61) Stickel, M., Fried, J. W., Kuehr, H., Padovani, P., & Urry, C.M. 1993, ApJ, 374, 431
- (62)
- (63) Tavecchio, F., et al. 2006, ApJ, 641, 732
- (64)
- (65) Tavecchio, F., Maraschi, L., Sambruna, R.M., & Urry, C.M. 2000, ApJ, 544, L23
- (66)
- (67) Uchiyama, Y. et al. 2006, ApJ, 648, 910
- (68)
- (69) Urry, C. M., Scarpa, R., O’Dowd, M., Falomo, R., Pesce, J. E., & Treves, A. 2000, ApJ, 532, 816
- (70)
- (71) Wills, B.J. & Brotherton, M. 1995, ApJ, 448, L81
- (72)
- (73) Witzel, A., Schalinski, C. J., Johnston, K. J., Biermann, P. L., Krichbaum, T. P., Hummel, C. A., & Eckart, A. 1988, A&A, 206, 245
- (74)
- (75) Worall, D.M., Birkinshaw, M., & Hardcastle, M.J.2001, MNRAS, 326, L7
- (76)