33email: galja@sai.msu.ru, shakura@sai.msu.ru
Modeling of non-stationary accretion disks in X-ray novae A 062000 and GRS 112468 during outburst
Abstract
Aims. We address the task of modeling soft X-ray and optical light curves of X-ray novae in the high/soft state.
Methods. The analytic model of viscous evolution of an externally truncated accretion -disk is used. Relativistic effects near a Kerr black hole and self-irradiation of an accretion disk are taken into account.
Results. The model is applied to the outbursts of X-ray nova Monocerotis 1975 (A 0620$-$00) and X-ray nova Muscae 1991 (GRS 1124$-$68). Comparison of observational data with the model yields constraints on the angular momentum (the Kerr parameter) of the black holes in A 062000 and GRS 112468: and , and on the viscosity parameter of the disks: and . We also conclude that the accretion disks should have an effective geometrical thickness times greater than the theoretical value of the distance between the photometric layers.
Key Words.:
accretion disks – binaries – novae: individual (Nova Mon 1975; Nova Mus 1991)1 Introduction
X-ray novae are the low-mass X-ray close binary systems (LMXBs) with a relativistic component, a black hole, or a neutron star (see, e.g., Tanaka & Shibazaki, 1996; Esin et al., 2000; Cherepashchuk, 2000). Much attention has been drawn to X-ray novae because they provide black hole candidates with the most reliable mass determinations (Cherepashchuk, 2000; McClintock & Remillard, 2003). The secondary component is a red dwarf, which nearly fills its Roche lobe, and transfer rates are estimated to be as low as /yr (Tanaka & Shibazaki, 1996). Once every several decades, the accretion rate onto the central object rises (up to /yr), and the system flares up as a Nova at all wavelengths.
In a significant number of X-ray novae the X-ray flux declines in an exponential fashion after the peak of an outburst, with a characteristic time of days (see, e.g., McClintock & Remillard, 2003). The optical flux also decays exponentially but about two times more slowly. The X-ray emission of the majority of X-ray novae during an outburst can be interpreted as the sum of a hard power-law component and a soft component produced by a multi-temperature black body disk with a maximum temperature keV (Tanaka & Shibazaki, 1996). As a rule, during the first several tens of days after the peak, the soft component dominates the power-law component (this stage is called the high/soft state). After 100–150 days the spectrum becomes harder as the power-law component prevails. An outburst usually lasts for several months.
Up to now the mechanism of the outbursts in X-ray novae has not been completely understood, but it most probably involves an instability of the outer disk regions (King & Ritter, 1998; Cherepashchuk, 2000). This instability, related to hydrogen ionization, was initially proposed to explain dwarf novae, in which accretion occurs onto a white dwarf (Meyer & Meyer-Hofmeister, 1981; Smak, 1984; Cannizzo, 1993). Subsequently, the concept was extended to X-ray novae. Van Paradijs (1996) followed by King & Ritter (1998) suggested that irradiation of the outer parts of the accretion disk by central X-rays has a significant impact on the dynamics of the evolutionary cycle in X-ray novae. Such irradiation is low in the dwarf novae (Dubus et al., 2001; Lasota, 2001).
To explain the spectral evolution of X-ray novae, a number of models have been proposed (see review by McClintock & Remillard, 2003). Esin et al. (1997) proposed a scenario involving a change of cooling mechanisms with decreasing accretion rate. According to their model, at the outburst peak and through the subsequent 100–150 days, the disk is geometrically thin and optically thick and embedded in a hot corona. As the accretion rate falls, the disk, begining from the center, gradually becomes advection-dominated, geometrically thick, and optically thin (Narayan et al., 1998). Using a succession of stationary models with different accretion rates, Esin et al. (1997, 2000) describe the X-ray and optical light curves and the spectral evolution of X-ray nova Muscae 1991 and X-ray nova Monocerotis 1975. To explain the observed X-ray-to-optical flux ratio they considered an irradiation of the disks and assumed that 80–90% of the incident X-ray flux is thermalized in the disks, which are thicker than given by the standard theory.
Naturally, time-dependent phenomena in disks call for a dynamical model. Whereas a stationary hydrostatic approximation can be kept to describe the vertical structure of the disk, a non-stationary model should primarily address its radial structure.
A theory of time-dependent accretion -disks in binary systems has been worked out by Lipunova & Shakura (2000) (hereafter LS00) and subsequently used to describe X-ray and optical light curves of X-ray nova Monocerotis 1975 and X-ray nova Muscae 1991 (Lipunova & Shakura, 2002, hereafter LS02). The model applies to the first several tens of days after the outburst peak, when the spectral state is high/soft, the hydrogen is ionized in the whole disk, and before the secondary maximum. The disk is considered to be externally truncated due to tidal interactions in a binary. Fitting the observational light curves of the two X-ray novae provided estimates of the -parameter and relationships between the black hole mass and the distance to the systems. Actually, a new method of estimating the -parameter of accretion disks was proposed, and the -parameter turned out to be rather high, 0.2–0.6.
In the present work, we develop the model of LS02 further. We include the effect of self-irradiation of the disk and take into account the general relativistic effects on the radial structure of the disk and on light propagation near a Kerr black hole. The last effect increases the degree of irradiation remarkably compared to the plain space-time geometry, even for a non-rotating black hole (Suleimanov et al., 2007).
2 The model
2.1 Time-dependent accretion disk
The theory of time-dependent accretion has been put forward in the work of Lyubarskij & Shakura (1987) and developed for an -disk in a close binary system by \al@ lip-sha2000.
A diffusion-type differential equation of non-stationary accretion is solved analytically assuming specific outer boundary conditions.The size of the disk is fixed due to tidal effects, and the accretion rate through the outer boundary is negligible compared with the rate through the inner boundary of the disk. The opacity coefficient is a power-law function of density and temperature . Separate regimes with scattering and Kramers absorption are considered. The vertical structure is treated anaytically on the basis of a method proposed by Ketsaris & Shakura (1998). As a result, the accretion rate at each radius is a power-law function of time and of some other parameters. In the case of Kramers opacity, it is given by (LS00):
| (1) |
Here is the specific angular momentum of the disk matter at the outer radius; has dimensions of seconds and normalizes the initial accretion rate; is a dimensional “diffusion constant” depending on the -parameter, the black hole mass, and the opacity coefficient ; function is a polynomial truncated to three terms:
| (2) |
where is the ratio of the angular momentum at a given disk radius to the angular momentum at the outer disk radius.
One can infer from (1) that the accretion rate near the central object hardly depends on . The disk dynamics (variations in the accretion rate, in particular) are defined by its structure at outer radii, because it is there that the characteristic viscous timescale is the longest. Changes in the accretion rate, occurring on a smaller time scale at inner radii, respond to the course of evolution at the outer disk. Thus, to analyze the light curves of a fully ionized accretion disk in any spectral band, one can use solution (1) written for the case of Kramers opacity .
We take (Frank et al., 2002, chap. 5), which is the best fit to the real opacity of matter with solar abundances when hydrogen is fully ionized and bound-free absorption by heavy elements is present. Then the diffusion constant takes the form
| (3) |
The numerical constant in (3) incorporates the opacity coefficient and a factor about that accounts for the vertical structure solution (for more details see \al@lip-sha2000,lip-sha2002; \al@lip-sha2000,lip-sha2002, ).
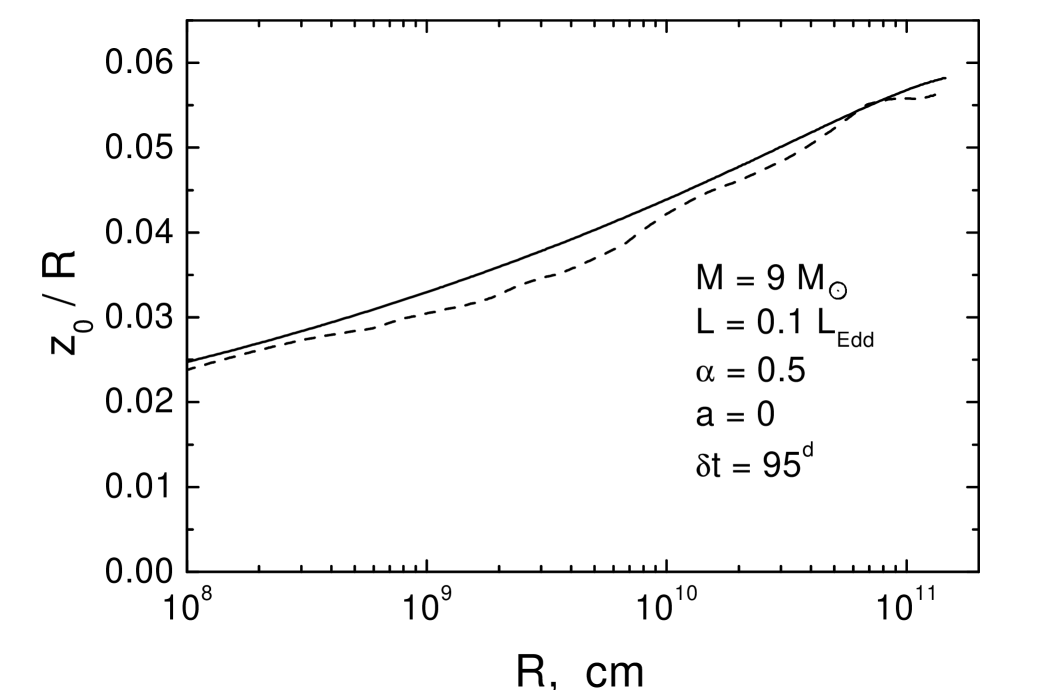
The key parameters for computing the emission of the disk are the effective temperature and the half-thickness of the disk, crucial for calculating self-irradiation. LS00 provides the half-thickness of the disk for the zones with Kramers opacity:
| (4) |
Here the numerical constant contains a factor about that accounts for the vertical structure solution and thus depends on the value (see Suleimanov et al. (2007) and Eq. (36) therein). Function is such that and
| (5) |
Figure 1 shows the ratio versus radius obtained by solving the vertical structure equations with the tabulated opacity values calculated for the solar chemical abundance (Kurucz, 1994; Suleimanov, 1991; Lipunova & Suleimanov, 2004). It can be seen that the half-thickness of the disk calculated from the real (tabulated) opacity is reproduced satisfactorily by Eq. (4).
The effective temperature of the disk may be written as
| (6) |
where is the Stephan-Boltzmann constant; ; is a “structure function” such that for a stationary, not-truncated disk in the Newtonian limit . Taking general relativistic effects into account following Page & Thorne (1974) and Riffert & Herold (1995) with zero torque at the inner disk radius, we have
| (7) |
where
| (8) | |||||
and . The term in the first square brackets of Eq. (7) represents a general relativistic correction and approaches 1 at large radii. The term in the second square brackets of Eq. (7) results from the non-stationary solution, and it equals approximately near the outer radius and at small radii.
At the outer edge of the disk there are additional sources of heating. Some type of collision between the disk and the incoming matter may cause a development of a hot area. Moreover, the tidal interactions rise steeply at (Ichikawa & Osaki, 1994) and lead to a corresponding energy release. We believe that neither of the above effects contributes significantly to the optical flux during the outburst and do not include them in the present study.
2.2 X-ray spectrum
In the vicinity of a compact relativistic object, the outgoing X-ray spectrum is disturbed by the effects of Doppler boosting due to the disk rotation, gravitational focusing, and the gravitational redshift (Cunningham, 1975). To calculate the spectrum of a disk, as detected by an observer at infinity, we use a computer code by Speith et al. (1995), which provides a transfer function allowing for these effects.
The transfer function is applied to the local X-ray spectra, which are diluted Planck spectra with a color temperature due to Compton scattering, where (Shimura & Takahara, 1995; Davis et al., 2005).
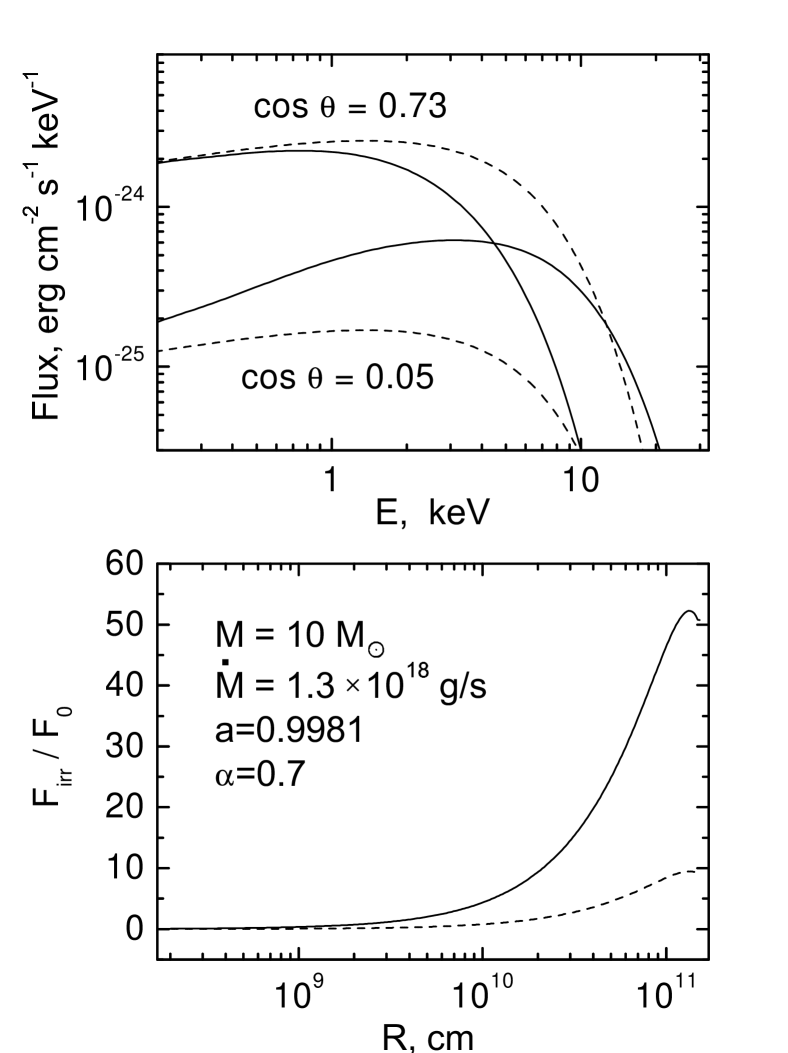
Figure 2 illustrates the general relativistic effects on the spectrum of the accretion disk around a Kerr black hole (the Kerr parameter ). Shown are the spectrum as seen by a remote observer for a disk inclination () and the spectrum for (). Naturally, the spectral shape of the X-ray emission received by the outer disk ( is large) differs significantly from what is seen by a remote observer. The intensity of the illuminating flux is significantly higher than calculated without general relativistic effects.
There are different methods of computing general relativistic effects on light propagation. An example of another implementation is one by Li et al. (2005), which is realized in the model “kerrbb” in the xspec package. However, kerrbb is restricted to inclination angles . Thus we cannot readily use it to obtain the flux illuminating the outer disk, the calculation of which we describe in the following section.
To calculate the X-ray flux at the Earth we take interstellar absorption into account (Morrison & McCammon, 1983).
2.3 Self-irradiation of the disk
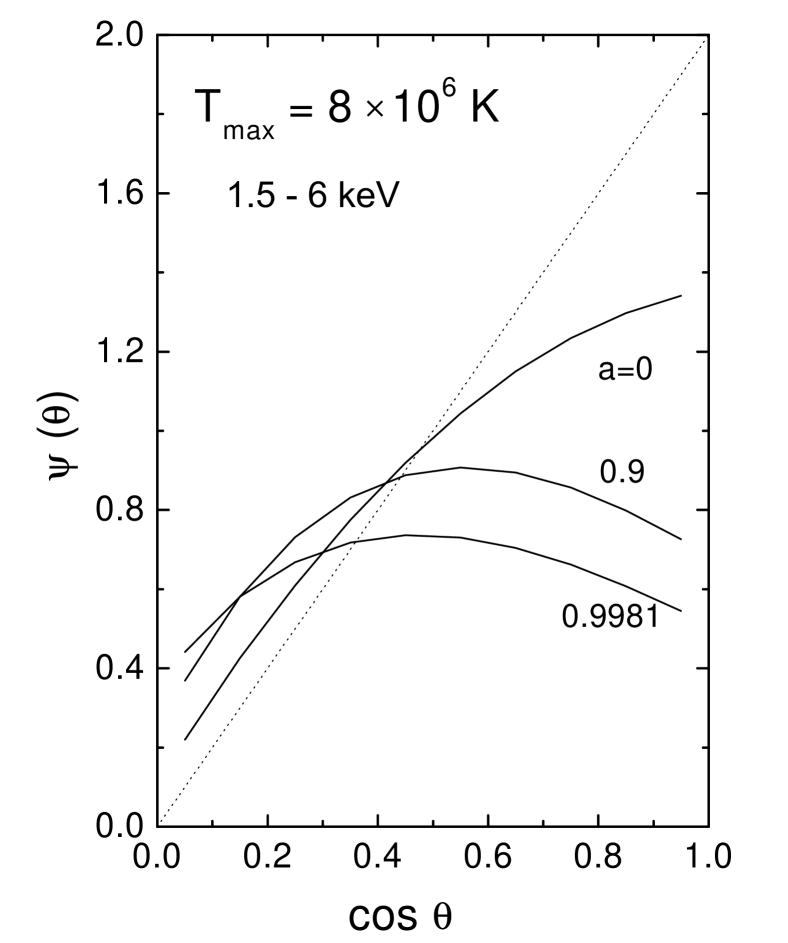
The flux falling onto a unit area that is normal to the emission outgoing at an angle to the disk axis, can be written as
| (9) |
where is the luminosity of the central X-ray source and the distance of the unit area from the center. In plain space-time geometry, for a flat disk as the central source, . We use the function provided by the code of Speith et al. (1995). Examples of for some values of the Kerr parameter are shown in Fig. 3
To calculate flux absorbed by a unit area of the disk, one should allow for not all of the incident flux being thermalized (Shakura & Sunyaev, 1973; van Paradijs, 1996; King & Ritter, 1998):
| (10) |
where is a thermalization coefficient, and the term in square brackets stands for the inclination of the disk surface to the incident rays. Assuming the disk to be geometrically thin, the distance is replaced by the radius of the disk at which the area in question is located.
The geometrical factor in the square brackets of Eq. (10) is remarkably different for the cases of the time-dependent model and a stationary disk. A stationary disk with has approximately the same as in Eq. (4). However, value differs significantly. Using Eq. (4) we obtain the geometrical factor for a non-stationary, externally-truncated disk,
| (11) |
which is for , while the geometrical factor for a steady-state disk model (Shakura & Sunyaev 1973) is ; thus, the time-dependent disk near the outer radius is less irradiated.
The factor can be thought of as a coefficient for the reprocessing of incident X-rays (“reprocessing efficiency”), i.e. the fraction of X-rays absorbed in the under-photosphere layers. Values of suggested by researchers differ significantly. For low-mass X-ray binaries, de Jong et al. (1996) obtained a low value for reprocessing efficiency . In contrast, modeling the outbursts of GRS 112468 and A 062000, Esin et al. (2000) assume that almost all the incident X-ray flux is thermalized, .
Taking another approach, a value for the reprocessing efficiency can be derived from an accurate consideration of the atmosphere of an accretion disk exposed to the incident radiation (Suleimanov et al., 1999). For a disk with ionized hydrogen, a decisive factor is the spectrum of the incident X-rays. Only rather hard X-rays, of energy keV, penetrate the layers where the optical continuum is produced. Softer X-rays are absorbed higher in the atmosphere and reprocessed to the far UV (Suleimanov et al., 1999; El-Khoury & Wickramasinghe, 1999). To raise the optical emission from the disk, the temperature should increase at the depths where the optical continuum is formed. However, most of the X-rays with energies over 10 keV are reflected due to electron scattering. Thus, it is mainly X-rays in the interval keV that are reprocessed to optical emission. The high/soft spectral state of X-ray novae is characterized by soft X-ray spectra with a corresponding black body temperature keV. Using Eq. (22) from Suleimanov et al. (1999) we obtain low values of the reprocessing efficiency, .
Esin et al. (2000) generally conclude that the outer parts of accretion disks in the high/soft state should be significantly thicker than follows from the standard model of Shakura & Sunyaev (1973). Concerning this result we bring up the following argument. The irradiation cannot increase the thickness of the disk beyond the values predicted by Eq. (4), either in the regions where Kramers opacity applies, or in the regions with partly ionized hydrogen (Dubus et al., 1999; Suleimanov et al., 2007). However, a layer of hot coronal gas could be present above the disk due to the irradiation of the outer disk by hard X-rays (Begelman et al., 1983; Begelman & McKee, 1983; Ko & Kallman, 1994; Różańska & Czerny, 1996; Proga & Kallman, 2002; Jimenez-Garate et al., 2002). Such a corona, optically thick in the radial direction, effectively increases the geometrical thickness of the disk and augments the degree of self-irradiation. Furthermore, the corona could be inhomogeneuos and contain optically thick gas blobs as proposed for supersoft X-ray sources by Suleimanov et al. (2003). In this case the reprocessing efficiency can increase significantly due to multiple scattering between the blobs.
There is another possibility for increasing a disk’s thickness. Recent simulations of magnetorotational turbulence (e.g. Miller & Stone, 2000; Turner, 2004; Hirose et al., 2006) show that magnetic pressure is significant in the upper layers of the disk, probably resulting in a vertically extended atmosphere. Thus, the optical-depth unity surface can be located a factor of two above the “standard” disk surface (Hirose et al., 2006).
In view of the present uncertainty, we consider the reprocessing efficiency as a parameter. For the same reason, we do not calculate the half-thickness of the disk using the tabulated values of opacity coefficient but utilize Kramers approximation. In Eq. (10), the presence of the corona is treated as the increased thickness of the disk, which equals multiplied by a chosen factor.
It should be noted that consideration of the hard spectral component, which is emitted by a central source (possible central corona) and characterized by , would enhance the self-irradiation of the disk.
2.4 Optical emission from the disk
The spectrum of the time-dependent disk at any moment of time is calculated by integrating local spectra over radius:
| (12) |
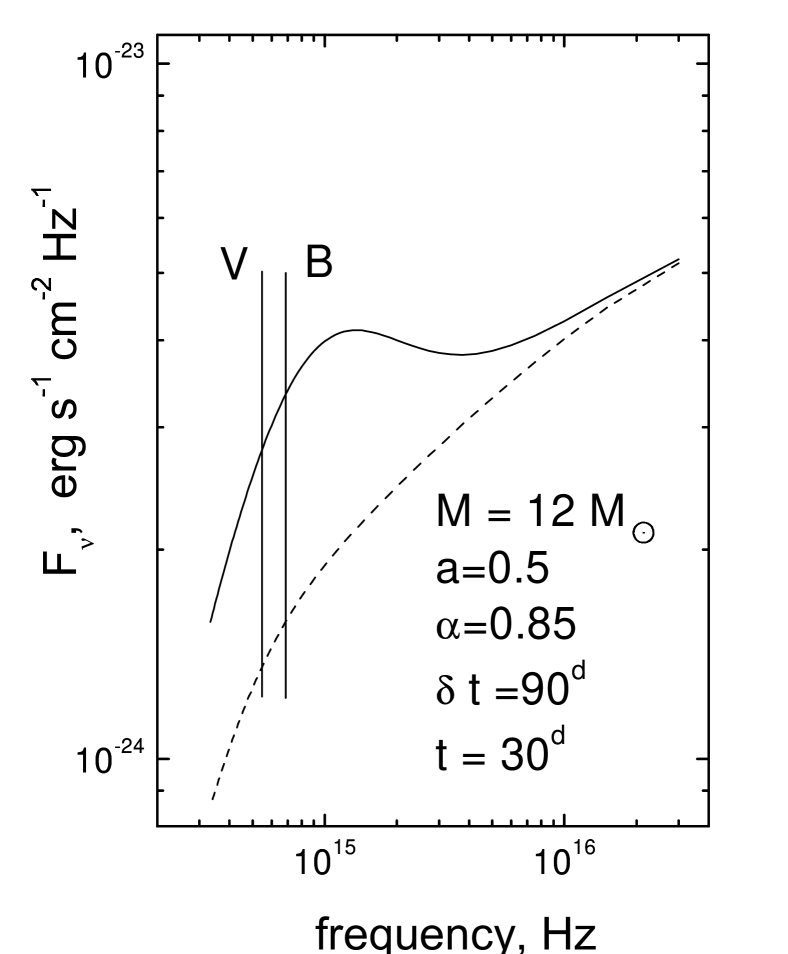
At the outer parts of the disk the local spectra are Planck functions with an effective temperature increased due to the intercepted X-ray flux
| (13) |
where is the effective temperature (Eq. 6) in the absence of X-ray irradiation. The spectral flux density at the Earth is given by
| (14) |
where the distance to the system, the inclination of the disk, is the optical depth for interstellar absorption.
The unabsorbed optical and UV spectrum of a self-irradiated disk is shown in Fig. 4.
3 Modeling procedure
The physical parameters of X-ray novae (mass, Kerr parameter, viscosity parameter , etc.) are sought by comparing modeled and observed light curves. A particular model of the disk is defined by a set of input physical parameters. Some of these can be varied and some are assumed to be known from observations.
To compare the model with observations, we chose several values calculated in a specific way from observational data– “fitted light curve parameters”– and fit them by the model.
3.1 Fitted light-curve parameters
As shown in LS02, the X-ray and optical light curves of the X-ray novae considered are represented well by linear functions in “log(flux)–time” coordinates throughout the first 40–60 days after the peak. Thus each light curve can be described by a pair of parameters: the slope and the flux at a reference time, which are to be fitted. This approach allows one to significantly reduce the computer time required for finding satisfactory model parameters.
In the course of the modeling, we reproduce the following values: the slope of the X-ray light curve , the slope of the optical light curve in the band , the X-ray flux , the flux , the color index , and, optionally, . All parameters, except for the first two, are calculated for a reference time.
3.2 Input parameters of the model
The free input parameters are: the black hole mass , its Kerr parameter , the viscosity parameter of the disk, the time parameter to fix the accretion rate at time , and the reprocessing efficiency . Other variable parameters of the model are the color-to-effective temperature ratio and the ratio , where is the height of X-rays’ interception.
The parameters that are more or less fixed include: the optical component mass , the mass function , the period of the binary , and the interstellar absorption, expressed by parameter for an X-ray band (the number of H atoms along the line of sight per cm2) or by the color excess for optical bands.
The mass of the optical component and the interstellar absorption are not very precisely known. In LS02 they were varied within narrow limits, and it was shown that the effect of the variation was small, so we fix their values.
Given the binary mass, one obtains the semi major axis of the binary system
| (15) |
and can calculate the outer radius of the disk approximately. We take this equal to 80% of the radius of a sphere whose volume equals that of the black hole’s Roche lobe (Eggleton, 1983):
| (16) |
where . This approximation agrees with calculations by Paczynski (1977) and with the direct estimates of disk sizes in cataclysmic variables (Sulkanen et al., 1981). One can also derive the inclination of the binary plane:
| (17) |
It is necessary to mention that the inner disk can have another inclination to the line of sight. The black hole angular momentum can be misaligned with that of a binary due to asymmetric previous supernova explosion. In this case the inner disk will tilt toward to equatorial plane of the black hole (Bardeen & Petterson, 1975). We do not consider this possibility in the present study and assume that the inner and the outer parts of the disk have the same inclination; therefore, some of our results can be biased, black hole angular momentum in particular.
The distance to the system is defined in the course of the modeling. As the limits on black hole masses and distances are known from observations, they are used to restrict the allowed ranges of other parameters.
3.3 Qualitative investigation of nonstationary accretion in -disks
Before proceeding to the model results, we discuss the qualitative features of the nonstationary model.
An estimate of can be derived from Eqs. (15) and (16) in the approximation that
| (18) |
Using this relation and Eq. (1), we obtain
| (19) |
Next, the bolometric luminosity of the disk can be written as
| (20) |
where is the efficiency of conversion of gravitational energy to radiation, dependent on the dimensionless Kerr parameter ; is the maximum color temperature at radius
| (21) |
Here represents a dependence on the Kerr parameter. For a Schwarzschild black hole , , and for a maximally rotating Kerr black hole , , . Recall that the color temperature is times greater than the effective temperature. From Eqs. (19) and (20) we have
| (22) |
Ebisawa et al. (1994) obtained the maximum color temperature variations for GRS 112468. Figure 5 shows good agreement between the observed decrease and the theoretical dependence on time (Eq. 22).
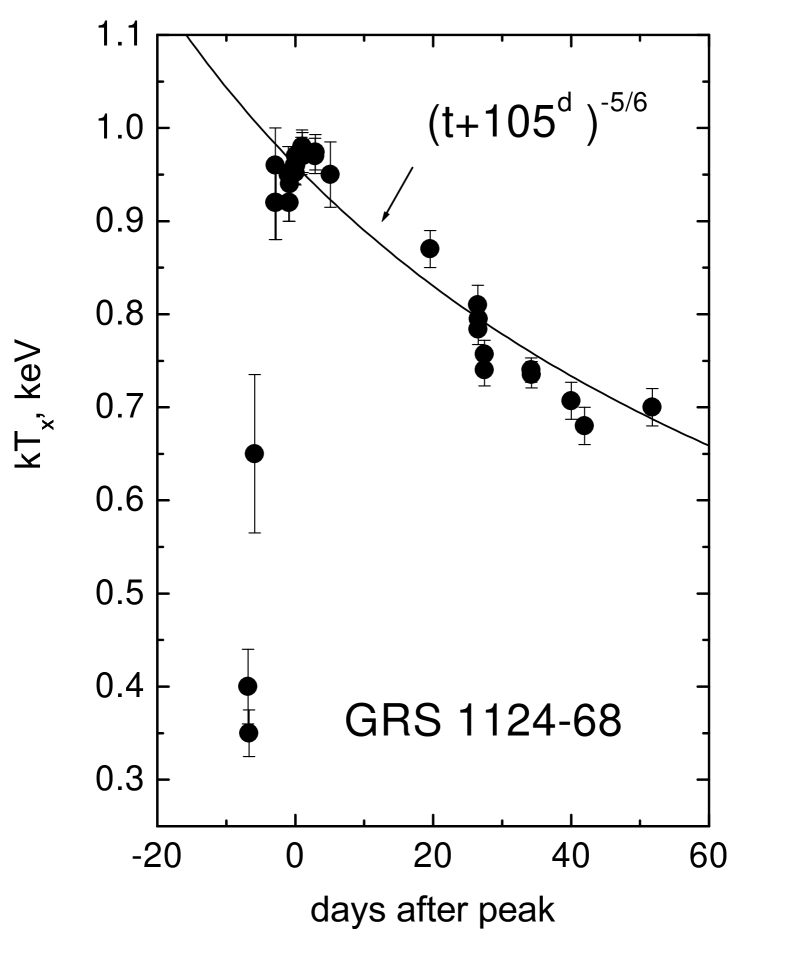
The fading of an X-ray light curve is faster than that of a bolometric light curve, expressed by Eq. (19). An interval of the spectrum that we consider can be approximated by Wien’s law with a temperature close to the maximum color temperature of the disk. Thus, variation in the X-ray flux of a soft X-ray transient is governed by the decreasing color temperature and the associated shift of the Wien-like spectrum to lower energies; a well-known exponential dependence of the light curve on time emerges (LS00). The optical light curves have flatter slopes because the main decrease in the disk luminosity happens at high energies.
Let us calculate the slope of an optical light curve, for example, in the band. Because the optical flux from the disk is mainly determined by the reprocessed X-ray emission from the central source, we can write
| (23) |
where index comes from a relation between the optical flux and the effective temperature. For instance, in the Rayleigh-Jeans part of the spectrum . The time dependence of the effective temperature at the outer edge of the disk can be obtained from Eq. (10):
| (24) |
or, using Eqs. (4), (19), and (20),
| (25) |
The slope of the light curve at time is
| (26) |
and is essentially determined only by the parameter and vice versa. Our numerical estimations yield for the spectrum of an irradiated disk. Substituting values of slopes from Table 1 into Eq. (26), we obtain that is approximately 90 and 100–110 days for A 062000 and GRS 112468 (for the 30th and the 50th days after the peak, respectively).
| Parameter | A 062000 | GRS 112468 |
|---|---|---|
| [days] | ||
| [atoms cm-2] | ||
| photons s-1 cm-2 | erg s-1 cm-2 | |
| [erg s cm2] | ||
| … |
- a
- b
-
c
is obtained from following Zombeck (1990).
The color index obviously determines the temperature at the outer disk edge . Thus, the parameters , , and , which produce a satisfactory model, should be related to meet the condition , defined by Eq. (25). To conclude, we note a basic feature: for a constant black hole mass and , an increase in the Kerr parameter will cause the distance to the binary to decrease (cf. Eqs. (20) and (21)).
4 Outbursts of Nova Mon 1975 (A 062000) and Nova Mus 1991 (GRS 112468)
Observational parameters for Nova Mon 1975 and Nova Mus 1991 are summarized in Table 1. We take and optical light curves collected in LS02. The light curve of A 062000 is taken from Liutyi (1976), van den Bergh (1976), and Duerbeck & Walter (1976) and transferred to units of erg cm-2 s-1 in the same way as described in LS02.
By and large, the outbursts are very much alike. Let us point out the distinctions. In GRS 112468, all light curves decline more slowly: the decay time scales, or “-folding times”, of the X-ray and optical light curves are 35 days and 68 days for GRS 112468 as against 30 days and 57 days for A 062000. In addition, the optical-to-X-ray flux ratio at the peak in A 062000 is times higher than in GRS 112468. The color index is greater for GRS 112468 (the object is “redder”), although the color excess is higher for A 062000.
The input parameters of the model are varied within the following limits: , the Kerr parameter : , the -parameter: , the time normalization parameter : days. The modeling results critically depend on the reprocessing efficiency , which we vary between 0 and 1.
4.1 A 062000. Importance of irradiation
We use the keV light curve obtained with the SAS-3 CSL-A (Kuulkers, 1998). The flux data are converted from counts s-1 to photons cm-2 s-1 assuming a Crab-like spectrum. The following normalizations are adopted: Crab counts/s (Buff et al., 1977), Crab photons cm-2 s-1 in keV. We believe the resulting error to be acceptable because keV and keV fluxes in Crab units are close to each other (Kaluzienski et al., 1977), and thus the spectral shapes of A 062000 and the Crab should be similar in the X-ray range in question.
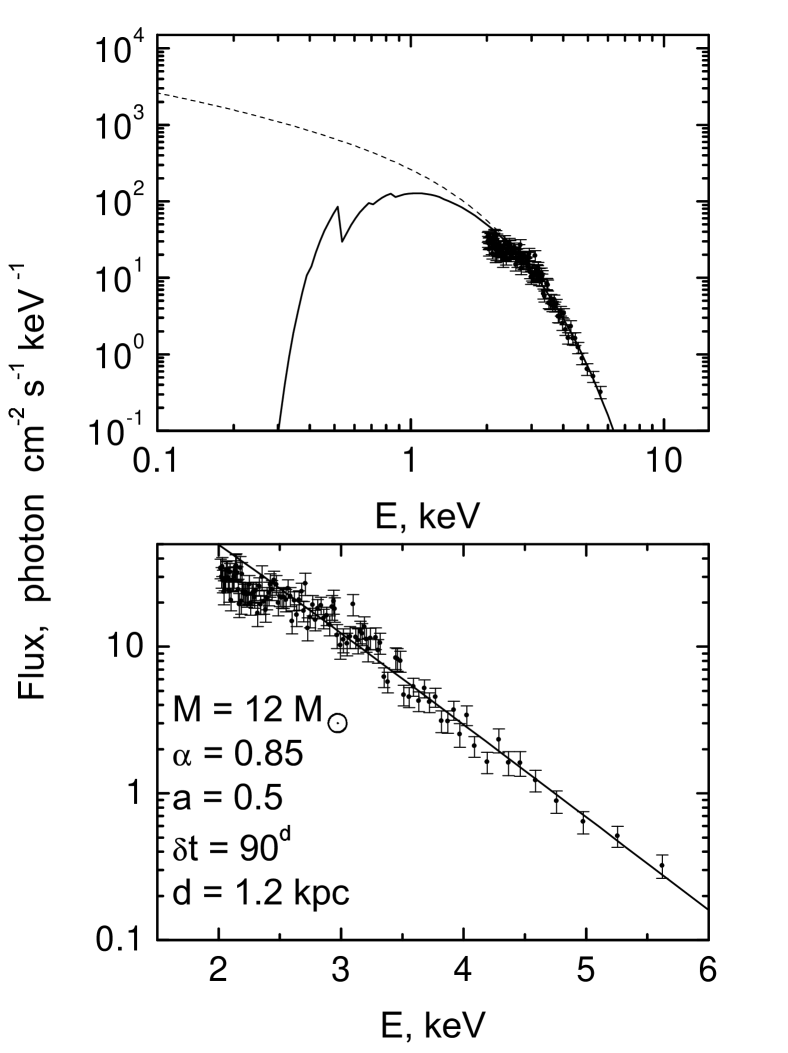
In Fig. 6 we compare the X-ray spectrum calculated from the model with the spectrum observed by Long & Kestenbaum (1978). The latter was obtained on the 70th day after the peak, when the flux had the same magnitude as on the 50th day (Kuulkers, 1998). We conclude that the chosen normalizations are satisfactory.
During the interval of days after the peak the multi-temperature black body disk component dominates the spectrum (see LS02, ). In Table 1 the slopes of the light curves are calculated for this time interval, and values and correspond to the 30th day.
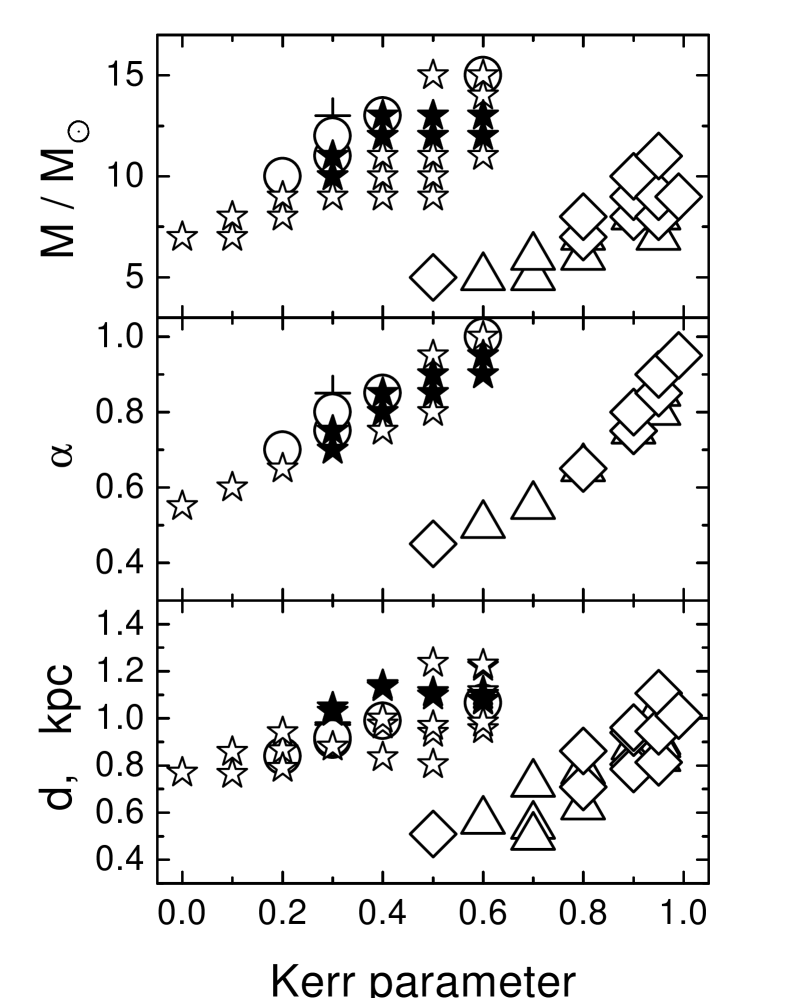
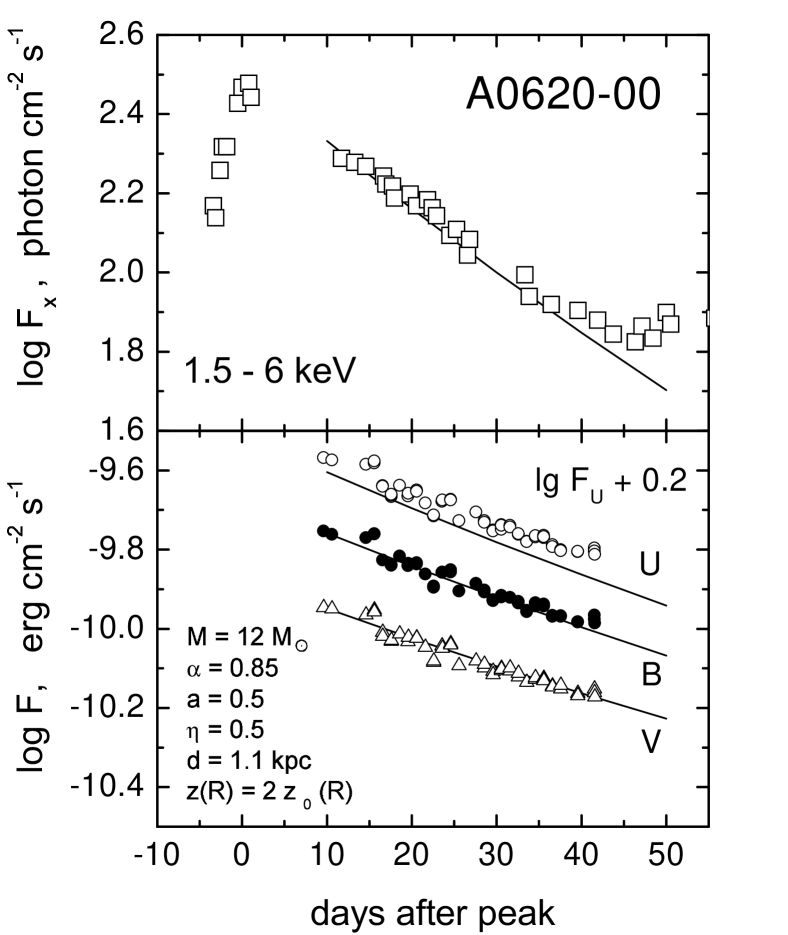
In LS02 the difficulty of reproducing the slope of the optical light curves of A 062000 was revealed. Including reprocessed emission helps to solve the issue. In the case of the self-irradiated disk, the slope of the optical light curve steepens, partly because the incident flux declines faster with time than the intrinsic flux, but mainly because has to be decreased to adjust the optical-to-X-ray flux ratio, and is uniquely related to the slope (see Eq. (26)). Modeling results are presented in Fig. 7. The relation between allowable values of the black hole mass, the Kerr parameter, and the -parameter reflects the constancy of the value . An example of the modeled and observed light curves is shown in Fig. 8.
There are two parameters that define the effect of irradiation (see Eq. (10)): the reprocessing efficiency and the ratio . In the Newtonian limit the combination is decisive, but in general relativity this is correct only approximately due to the relativistic function . Our calculations show that the observed parameters can be fitted with . Evidently, the reprocessing efficiency can hardly be as high as 1. Therefore, the accretion disk in this X-ray nova must have an effective geometrical thickness greater than that given by Eq. (4). One can introduce the so-called irradiation parameter to rewrite Eq. (10): (see, for example, Dubus et al., 2001). For the model presented in Fig. 8, in the time span days, the irradiation parameter, calculated at the outer radius cm, changes in the range .
There are no satisfactory models with the Kerr parameter for (Fig. 7). We also investigate the influence of parameter . Results with are presented in Fig. 7 by diamonds (for = 1 and = 1) and triangles ( = 0.5 and = 2). One can see that models with have higher values of the Kerr parameter, which compensate the decrease in the color temperature. Other parameters (the black hole masses, -parameter, and the distance), though somewhat decreased, are still in the same range. Therefore, any uncertainty in leads mainly to a deviation of the Kerr parameter.
In some of the models, the effect of limb darkening was included. For the local X-ray spectra, the limb darkening was taken into account assuming the dominant electron scattering, and the grey atmosphere (Eddington) approach was used for the local optical spectra (Chandrasekhar, 1950; Sobolev, 1949, 1969). The corresponding results are shown in Fig. 7 by pluses. Taking account of limb darkening leads to some increase in the black hole mass, the -parameter, and the distance to the binary, not altering the results qualitatively.
Independent estimates of the system parameters can be used to constrain our results further. Available in the literature are estimates of the distance kpc (Shahbaz et al., 1994; Barret et al., 1996) and the black hole mass: (Shahbaz et al., 1994), (Haswell et al., 1993). The highest quoted accuracy is of the estimates given by Gelino et al. (2001a): and kpc. The constructed models agree with these values if and the Kerr parameter (Fig. 7).
4.2 GRS 112468
Ebisawa et al. (1994) fit the spectra obtained during the 1991 outburst of GRS 112468 with a model comprising two components: a hard power-law component and a soft component emitted by a multicolor disk (Mitsuda et al., 1984). They present a time evolution of model parameters: the maximum temperature and the inner radius of the multicolor disk, as well as the photon index and the hard keV flux from the power-law component. This information allows us to calculate the unabsorbed keV flux. In Table 1 the slopes of the light curves are calculated for a 20–50 day interval.
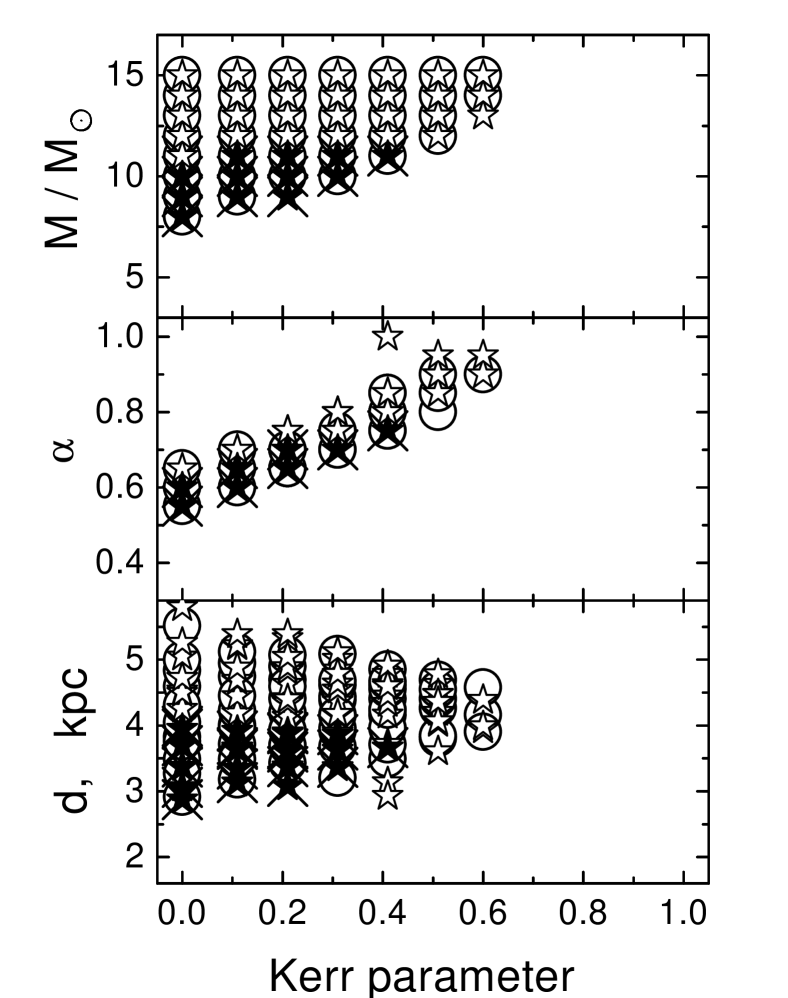
It is possible to fit the light curves with plausible values of reprocessing efficiency, , keeping the standard thickness of the disk. For this system the relation is fulfilled. One gets almost same results with three different sets of parameters: (1) , ; (2) , ; (3) , (see Figs. 9 and 10). The parameter lies in the range from 100 to 115 days in all models. Figure 9 presents allowable intervals for the mass, the Kerr parameter, the -parameter, and the distance, which lies in the interval from 2.5 to 6 kpc.
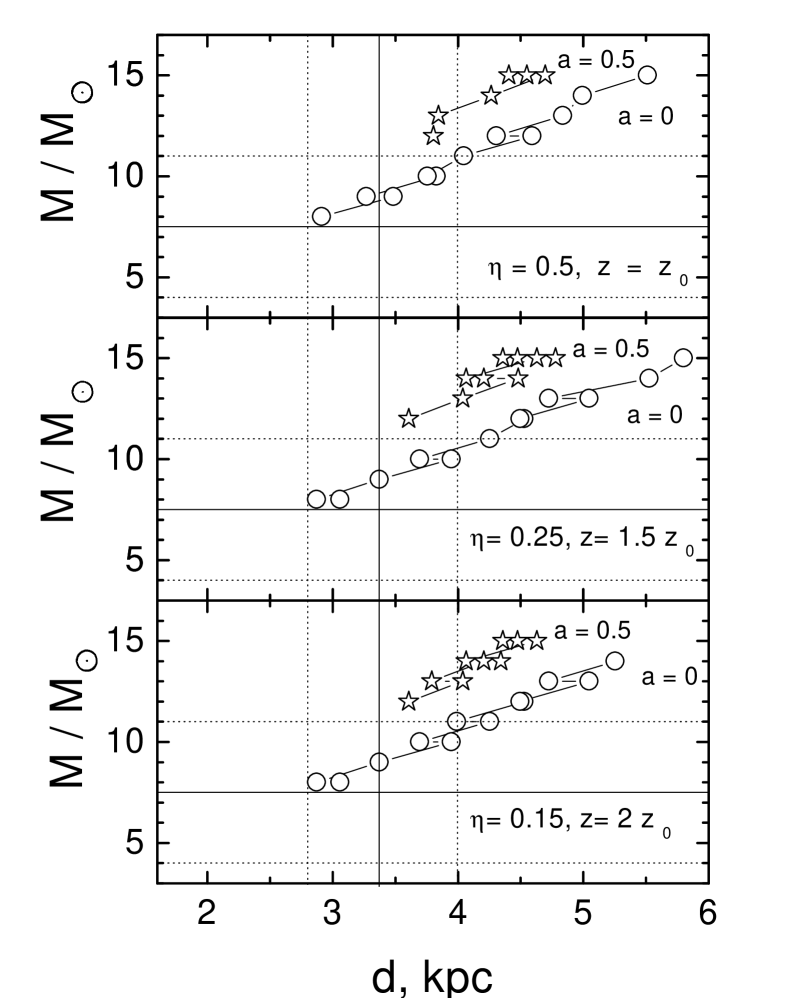
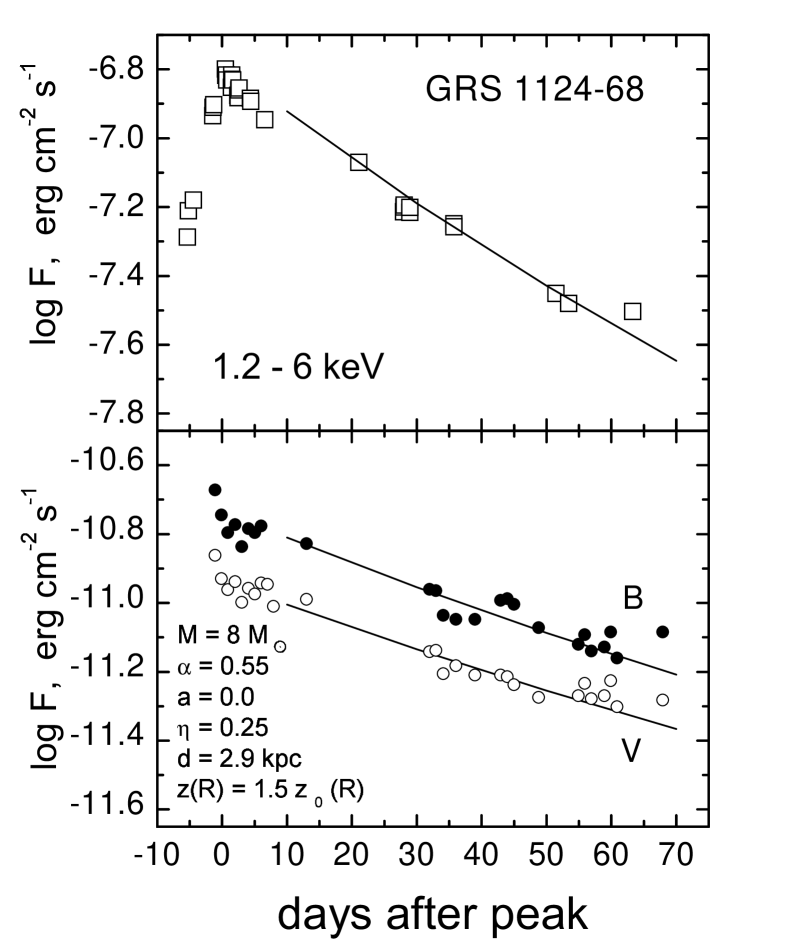
Figure 11 illustrates the modeled light curves for parameters , , , , , and . During the interval of days, the irradiation parameter (see Sect. 4.1), calculated at the outer radius cm, decreases from to .
4.2.1 Distance to GRS 112468
Independent estimates of the distance and the black hole mass are: kpc and (Shahbaz et al., 1997), kpc and (Orosz et al., 1996). The highest accuracy for the black hole mass is claimed by Gelino et al. (2001b) and Khruzina et al. (2003): and , respectively. Gelino et al. (2001b) estimate the distance as kpc or even kpc (Gelino, 2004).
The constructed models cannot agree with the distances obtained by Gelino et al. (2001b) and Gelino (2004), tending more to the estimates of Shahbaz et al. (1997). For the black hole mass , , and , we come to the following allowable intervals of parameters: the distance kpc, the Kerr parameter , and the -parameter (Fig. 9).
The above estimates of the distance are derived from an analysis of light curves and spectra in optical and IR bands obtained during the quiescent state of the X-ray nova. The basic element for determining the distance in quiescence is the spectral class of the secondary. It is found from optical spectra ( K4V, Orosz et al., 1996) and yields a corresponding effective temperature ( K). However, the optical light curves of the secondary imply a reflection, and it is necessary to assume (Khruzina et al., 2003). Thus, the apparent spectral class of the secondary is biased; if the actual effective temperature of the secondary is lower, then the binary is closer.
Another way to constrain the distance is to study X-ray spectra obtained during the outburst. Ebisawa et al. (1994) obtain a non-relativistic relation between the black hole mass and the distance, which can be rewritten as follows:
| (27) |
This relation appears to agree with our results (Fig. 9), keeping in mind that slight changes due to relativistic corrections might be present.
It is worth noting here the possibility of increasing a distance obtained from X-ray data. The inner disk radius can be greater than the radius of the last marginally stable orbit . This phenomenon is discussed for other Galactic black hole candidates (Gilfanov et al., 1999; Chaty et al., 2003). The inner region, evacuated by the standard disk, becomes hot and optically thin, so not contributing to the soft X-ray flux. We tested a number of models with the inner radius moved away up to . The imposed boundary condition was that the viscous stress tensor becomes zero at and is non-zero at the inner radius . We came to the conclusion that all such models, which satisfactorily fitted the data, had higher values of the Kerr parameter and unchanged values of the mass and the distance.
5 Discussion and conclusions
As shown, the model with non-stationary accretion onto a compact binary component, developed for an -disk in LS00, can account for the X-ray and optical light curves of the two X-ray novae considered, A 062000 and GRS 112468, in the high/soft state. Dedicated modeling of the light curves has previously been attempted in LS02. In the present study we extend the modeling by including the effects of general relativity on light propagation near black holes and self-irradiation of the disks.
One needs to assume a rather large contribution of reprocessed flux in the optical light curves. A thin disk encounters difficulties here in explaining the required amount of intercepted flux. A twisted disk could be suggested here as a solution because its regions facing the center undergo increased illumination (Dubus et al., 1999; Esin et al., 2000), but the total benefit, calculated for the whole surface of one disk side, is ambiguous due to the effect of self-shielding (Suleimanov et al., 2007).
In the current study we prefer another explanation. We suggest the presence of matter above the disk in the form of a hot corona with temperature K (e.g., corresponding to the atmosphere or the “warm corona” of Jimenez-Garate et al., 2002). By intercepting X-rays, the corona effectively increases the disk thickness. This idea manifests itself in the computation of the optical emission when we substitute the half-thickness of the disk by the value representing the height of X-rays’ interception. Furthermore, if the corona is inhomogeneous, i.e. consists of cooler blobs surrounded by hotter plasma, then multiple scattering between the blobs could explain the high values of the reprocessing efficiency (Suleimanov et al., 2003).
The outer parts of the disks in A 062000 and GRS 112468 have remarkably different properties. The disk in GRS 112468 turns out to be thinner and/or and weakly thermalizes the intercepted X-ray flux. Probably the illumination of the outer disk in A 062000 is more pronounced because of the higher Kerr parameter. If we freeze the disk thickness at a standard value and re-calculate models with the parameters used in Figs. 8 and 11, we find that the irradiating flux in A 062000 is twice that in GRS 112468. This could be the reason for the more developed corona above the outer disk in A 062000. Another possible source for the extended atmosphere of the disk is the magnetic pressure supporting the outer layers of the disk (e.g. Hirose et al., 2006). This would agree with the higher value of in A 062000, given that the magnetorotational instability generates the viscosity.
To bound the resulting parameters we need to invoke independent estimates of the mass and the distance. Then for A 062000 we obtain the intervals: and the Kerr parameter . For GRS 112468 we find and the Kerr parameter if the distance to the system lies between 3 and 4 kpc. If we do not apply the knowledge of the mass and the distance, we are nevertheless able to confirm the high value of the turbulent parameter: (middle panels in Figs. 7 and 9). Such values of are in aproximate agreement, but slightly higher than the commonly proposed values for thin, fully ionized disks: (e.g., King et al., 2007).
The accuracy of the estimates of obtained suffers from limitations in the calculations of the X-ray flux made in the model and from the observational data. In this regard, we should also mention a simplified account of the tidal effects in the analytic model of a non-stationary disk (LS00). Presumably, the accretion disk in an X-ray nova binary has a fixed outer radius, at which a delta function-type transport of angular momentum to the orbital motion occurs due to tidal interactions. A physically more comprehensive consideration, involving a real form of the tidal torque (Papaloizou & Pringle, 1977; Smak, 1984; Ichikawa & Osaki, 1994; Hameury & Lasota, 2005), could revise the solution (Eq. 1) and thus change the estimates of (see Eq. (19)). From this point of view, the value of obtained for the outer disk is a “characteristic” parameter of the model. However, an advanced treatment would not change significantly the theoretical , and thus , if the tidal interactions are small in the whole disk and rise very steeply only near (Ichikawa & Osaki, 1994).
Our estimates of the Kerr parameter basically accord with a variety of estimates recently obtained for several stellar mass black holes: for M33 X7, for GRO J165540, for 4U 154347, for GRS 1915105, for LMC X3 (Liu et al., 2008; Shafee et al., 2006; McClintock et al., 2006; Davis et al., 2006). In these works, X-ray spectra are fitted by spectral models of a relativistic accretion disk (Li et al., 2005; Davis & Hubeny, 2006), and the black holes masses and orbital inclination angles are well known. Also, the Fe line method has been used to obtain an estimate for the black hole spin in GX 3394 (Miller et al., 2008).
The model presented here can only be applied during the first few tens of days after the peak and fails to explain the late outburst phases. In the low/hard state, the thin disk model cannot adequately account for the observed spectra and energetics of X-ray novae. The ADAF model is believed to be appropriated instead (Esin et al., 1997, 2000). On the other hand, complex X-ray light curves at the early outburst phases, for example those of GRO J1655-40 and XTE J1550-564, can hardly be interpreted by means of the present method. These binaries are highly inclined to the line of sight, and the flat thin disks are obscured by the outer thick disks during the early outburst (see Narayan & McClintock, 2005). The law of accretion rate evolution (Eq. 1) also does not hold for the events involving an additional enhanced mass transfer from the secondary.
Our choice of the two X-ray novae stems from their exhibiting the most classical shape of X-ray nova light curves. The prospect of a future determination of in ionized accretion disks in binary systems is likely to come from modeling the evolution of disk parameters during the time when the disk spectral component dominates in the spectrum of an exponentially decaying X-ray nova in the high/soft state, and preferably with known parameters and orbital elements of the binary.
Acknowledgements.
The X-ray data for A 062000 were kindly provided by E. Kuulkers. We thank R. Porkas, K. Postnov, and the anonymous referee for useful comments. The work was supported by the Russian Foundation for Basic Research (projects 06–02–16025 and 09–02–00032) and by the President’s Program for Support of Leading Science Schools (grant Nsh.–4224.2008.2). V. F. Suleimanov is supported by the DFG grant SFB/Transregio 7 ”Gravitational Wave Astronomy”. N. I. Shakura is grateful to the Max Planck Institute for Astrophysics (Garching, Germany) for the opportunity for annual short-term study visits. G. V. Lipunova is grateful to the Offene Ganztagesschule of the Paul-Klee-Grundschule (Bonn, Germany) and Stadt Bonn for providing a possibility for her full-day scientific activity.References
- Bardeen & Petterson (1975) Bardeen, J. M., & Peterson, J. A. 1975, ApJ, 195, L65
- Barret et al. (1996) Barret, D., McClintock, J. E., & Grindlay, J. E. 1996, ApJ, 473, 963
- Begelman & McKee (1983) Begelman, M. C. & McKee, C. F. 1983, ApJ, 271, 89
- Begelman et al. (1983) Begelman, M. C., McKee, C. F., & Shields, G. A. 1983, ApJ, 271, 70
- Buff et al. (1977) Buff, J., Jernigan, G., Laufer, B., et al. 1977, ApJ, 212, 768
- Cannizzo (1993) Cannizzo, J. K. 1993, The Limit Cycle Instability in Dwarf Nova Accretion Disks (Accretion Disks in Compact Stellar Systems), 6
- Chandrasekhar (1950) Chandrasekhar, S. 1950, Radiative transfer. (Oxford, Clarendon Press, 1950.)
- Chaty et al. (2003) Chaty, S., Haswell, C. A., Malzac, J., et al. 2003, MNRAS, 346, 689
- Chen et al. (1997) Chen, W., Shrader, C. R., & Livio, M. 1997, ApJ, 491, 312
- Cheng et al. (1992) Cheng, F. H., Horne, K., Panagia, N., et al. 1992, ApJ, 397, 664
- Cherepashchuk (2000) Cherepashchuk, A. M. 2000, Space Science Reviews, 93, 473
- Cunningham (1975) Cunningham, C. T. 1975, ApJ, 202, 788
- Davis et al. (2005) Davis, S. W., Blaes, O. M., Hubeny, I., & Turner, N. J. 2005, ApJ, 621, 372
- Davis et al. (2006) Davis, S. W., Done, C., & Blaes, O. M. 2006, ApJ, 647, 525
- Davis & Hubeny (2006) Davis, S. W. & Hubeny, I. 2006, ApJS, 164, 530
- de Jong et al. (1996) de Jong, J. A., van Paradijs, J., & Augusteijn, T. 1996, A&A, 314, 484
- della Valle et al. (1991) della Valle, M., Jarvis, B. J., & West, R. M. 1991, Nature, 353, 50
- Dubus et al. (2001) Dubus, G., Hameury, J.-M., & Lasota, J.-P. 2001, A&A, 373, 251
- Dubus et al. (1999) Dubus, G., Lasota, J.-P., Hameury, J.-M., & Charles, P. 1999, MNRAS, 303, 139
- Duerbeck & Walter (1976) Duerbeck, H. W. & Walter, K. 1976, A&A, 48, 141
- Ebisawa et al. (1994) Ebisawa, K., Ogawa, M., Aoki, T., et al. 1994, PASJ, 46, 375
- Eggleton (1983) Eggleton, P. P. 1983, ApJ, 268, 368
- El-Khoury & Wickramasinghe (1999) El-Khoury, W. & Wickramasinghe, D. 1999, MNRAS, 303, 380
- Esin et al. (2000) Esin, A. A., Kuulkers, E., McClintock, J. E., & Narayan, R. 2000, ApJ, 532, 1069
- Esin et al. (1997) Esin, A. A., McClintock, J. E., & Narayan, R. 1997, ApJ, 489, 865
- Frank et al. (2002) Frank, J., King, A., & Raine, D. J. 2002, Accretion Power in Astrophysics, 3rd edn. (Cambridge, UK: Cambridge University Press)
- Gelino (2004) Gelino, D. M. 2004, in Revista Mexicana de Astronomia y Astrofisica Conference Series, Vol. 20, Revista Mexicana de Astronomia y Astrofisica Conference Series, ed. G. Tovmassian & E. Sion, 214–214
- Gelino et al. (2001a) Gelino, D. M., Harrison, T. E., & McNamara, B. J. 2001a, AJ, 122, 971
- Gelino et al. (2001b) Gelino, D. M., Harrison, T. E., & Orosz, J. A. 2001b, AJ, 122, 2668
- Gilfanov et al. (1999) Gilfanov, M., Churazov, E., & Revnivtsev, M. 1999, A&A, 352, 182
- Hameury & Lasota (2005) Hameury, J.-M. & Lasota, J.-P. 2005, A&A, 443, 283
- Haswell et al. (1993) Haswell, C. A., Robinson, E. L., Horne, K., Stiening, R. F., & Abbott, T. M. C. 1993, ApJ, 411, 802
- Hirose et al. (2006) Hirose, S., Krolik, J. H., & Stone, J. M. 2006, ApJ, 640, 901
- Ichikawa & Osaki (1994) Ichikawa, S. & Osaki, Y. 1994, PASJ, 46, 621
- Jimenez-Garate et al. (2002) Jimenez-Garate, M. A., Raymond, J. C., & Liedahl, D. A. 2002, ApJ, 581, 1297
- Kaluzienski et al. (1977) Kaluzienski, L. J., Holt, S. S., Boldt, E. A., & Serlemitsos, P. J. 1977, ApJ, 212, 203
- Ketsaris & Shakura (1998) Ketsaris, N. A. & Shakura, N. I. 1998, Astronomical and Astrophysical Transactions, 15, 193
- Khruzina et al. (2003) Khruzina, T. S., Cherepashchuk, A. M., Bisikalo, D. V., Boyarchuk, A. A., & Kuznetsov, O. A. 2003, Astronomy Reports, 47, 621
- King et al. (2007) King, A. R., Pringle, J. E., & Livio, M. 2007, MNRAS, 376, 1740
- King & Ritter (1998) King, A. R. & Ritter, H. 1998, MNRAS, 293, L42
- Ko & Kallman (1994) Ko, Y.-K. & Kallman, T. R. 1994, ApJ, 431, 273
- Kurucz (1994) Kurucz, R. 1994, CD-ROMs No. 19-22. Cambridge, Mass.: Smithsonian Astrophysical Observatory, 1994.
- Kuulkers (1998) Kuulkers, E. 1998, New Astronomy Review, 42, 1
- Lasota (2001) Lasota, J.-P. 2001, New Astronomy Review, 45, 449
- Li et al. (2005) Li, L.-X., Zimmerman, E. R., Narayan, R., & McClintock, J. E. 2005, ApJS, 157, 335
- Lipunova & Shakura (2000) Lipunova, G. V. & Shakura, N. I. 2000, A&A, 356, 363
- Lipunova & Shakura (2002) Lipunova, G. V. & Shakura, N. I. 2002, Astronomy Reports, 46, 366
- Lipunova & Suleimanov (2004) Lipunova, G. V. & Suleimanov, V. F. 2004, Baltic Astronomy, 13, 167
- Liu et al. (2008) Liu, J., McClintock, J., Narayan, R., Davis, S., & Orosz, J. 2008, ArXiv e-prints, 803
- Liutyi (1976) Liutyi, V. M. 1976, Soviet Astronomy Letters, 2, 43
- Long & Kestenbaum (1978) Long, K. S. & Kestenbaum, H. L. 1978, ApJ, 226, 271
- Lyubarskij & Shakura (1987) Lyubarskij, Y. E. & Shakura, N. I. 1987, Soviet Astronomy Letters, 13, 386
- McClintock & Remillard (2003) McClintock, J. E. & Remillard, R. A. 2003, ArXiv Astrophysics e-prints: astro-ph/0306213
- McClintock et al. (2006) McClintock, J. E., Shafee, R., Narayan, R., et al. 2006, ApJ, 652, 518
- Meyer & Meyer-Hofmeister (1981) Meyer, F. & Meyer-Hofmeister, E. 1981, A&A, 104, L10
- Miller & Stone (2000) Miller, K. J., Stone, J. M. 2008, ApJ, 534, 398
- Miller et al. (2008) Miller, J. M., Reynolds, C. S., Fabian, A. C., et al. 2008, ArXiv e-prints, 802
- Mitsuda et al. (1984) Mitsuda, K., Inoue, H., Koyama, K., et al. 1984, PASJ, 36, 741
- Morrison & McCammon (1983) Morrison, R. & McCammon, D. 1983, ApJ, 270, 119
- Narayan et al. (1998) Narayan, R., Mahadevan, R., & Quataert, E. 1998, in Theory of Black Hole Accretion Disks, 148
- Narayan & McClintock (2005) Narayan, R., & McClintock, J. F. 2005, ApJ, 623, 1017
- Orosz et al. (1996) Orosz, J. A., Bailyn, C. D., McClintock, J. E., & Remillard, R. A. 1996, ApJ, 468, 380
- Paczynski (1977) Paczynski, B. 1977, ApJ, 216, 822
- Page & Thorne (1974) Page, D. N. & Thorne, K. S. 1974, ApJ, 191, 499
- Papaloizou & Pringle (1977) Papaloizou, J. & Pringle, J. E. 1977, MNRAS, 181, 441
- Proga & Kallman (2002) Proga, D. & Kallman, T. R. 2002, ApJ, 565, 455
- Riffert & Herold (1995) Riffert, H. & Herold, H. 1995, ApJ, 450, 508
- Różańska & Czerny (1996) Różańska, A. & Czerny, B. 1996, Acta Astronomica, 46, 233
- Shafee et al. (2006) Shafee, R., McClintock, J. E., Narayan, R., et al. 2006, ApJ, 636, L113
- Shahbaz et al. (1994) Shahbaz, T., Naylor, T., & Charles, P. A. 1994, MNRAS, 268, 756
- Shahbaz et al. (1997) Shahbaz, T., Naylor, T., & Charles, P. A. 1997, MNRAS, 285, 607
- Shakura & Sunyaev (1973) Shakura, N. I. & Sunyaev, R. A. 1973, A&A, 24, 337
- Shimura & Takahara (1995) Shimura, T. & Takahara, F. 1995, ApJ, 445, 780
- Shrader & Gonzalez-Riestra (1993) Shrader, C. R. & Gonzalez-Riestra, R. 1993, A&A, 276, 373
- Smak (1984) Smak, J. 1984, Acta Astronomica, 34, 161
- Sobolev (1949) Sobolev, V. V. 1949, Uchenye Zapiski Leningrad. Univ., Seria Matem. Nauk, 18, N 1163
- Sobolev (1969) Sobolev, V. V. 1969, 1, Vol. F-531, Course in Theoretical Astrophysics (NASA)
- Speith et al. (1995) Speith, R., Riffert, H., & Ruder, H. 1995, Computer Physics Communications, 88, 109
- Suleimanov et al. (1999) Suleimanov, V., Meyer, F., & Meyer-Hofmeister, E. 1999, A&A, 350, 63
- Suleimanov et al. (2003) Suleimanov, V., Meyer, F., & Meyer-Hofmeister, E. 2003, A&A, 401, 1009
- Suleimanov (1991) Suleimanov, V. F. 1991, Soviet Astronomy Letters, 17, 245
- Suleimanov et al. (2007) Suleimanov, V. F., Lipunova, G. V., & Shakura, N. I. 2007, Astronomy Reports, 51, 549
- Sulkanen et al. (1981) Sulkanen, M. E., Brasure, L. W., & Patterson, J. 1981, ApJ, 244, 579
- Tanaka & Shibazaki (1996) Tanaka, Y. & Shibazaki, N. 1996, ARA&A, 34, 607
- Turner (2004) Turner, N. J. 2004, ApJ, 605, L45
- van den Bergh (1976) van den Bergh, S. 1976, AJ, 81, 104
- van Paradijs (1996) van Paradijs, J. 1996, ApJ, 464, L139
- Weaver & Williams (1974) Weaver, H. & Williams, D. R. W. 1974, A&AS, 17, 1
- Wu et al. (1983) Wu, C.-C., Panek, R. J., Holm, A. V., Schmitz, M., & Swank, J. H. 1983, PASP, 95, 391
- Zombeck (1990) Zombeck, M. V. 1990, Handbook of space astronomy and astrophysics (Cambridge: University Press, 1990, 2nd ed.)