Tel.: +44 207848 1531
Fax: +44 207848 2420
22email: nicholas.cade@kcl.ac.uk
Plasmonic engineering of metal nanoparticles for enhanced fluorescence and Raman scattering
Abstract
We have investigated the effects of tuning the localized surface plasmon resonances (LSPRs) of silver nanoparticles on the fluorescence intensity, lifetime, and Raman signal from nearby fluorophores. The presence of a metallic structure can alter the optical properties of a molecule by increasing the excitation field, and by modifying radiative and non-radiative decay mechanisms. By careful choice of experimental parameters we have been able to decouple these effects. We observe a four-fold increase in fluorescence enhancement and an almost 30-fold increase in decay rate from arrays of Ag nanoparticles, when the LSPR is tuned to the emission wavelength of a locally situated fluorophore. This is consistent with a greatly increased efficiency for energy transfer from fluorescence to surface plasmons. Additionally, surface enhanced Raman scattering (SERS) measurements show a maximum enhancement occurs when both the incident laser light and the Raman signal are near resonance with the plasmon energy. Spatial mapping of the SERS signal from a nanoparticle array reveals highly localized differences in the excitation field resulting from small differences in the LSPR energy.
Keywords:
Fluorescence enhancement, Fluorescence lifetime, LSPR, Nanoparticles, SERS1 Introduction
Noble metal nanoparticles are being used increasingly in spectroscopic techniques with biomedical applications, including detection, labelling, cell tagging and sorting, imaging enhancers, and as therapeutic agents Stuart2005 . When metal nanoparticles are excited by electromagnetic radiation of a certain wavelength, their conduction electrons exhibit collective oscillations known as a localized surface plasmon resonance (LSPR). For a specific nanoparticle, the wavelength of the LSPR is sensitive to a variety of factors, such as the size, shape, interparticle spacing, and dielectric environment vanduyne01 ; mock02 ; schatz03 ; Jin2003 ; Rechberger2003 ; Murray2006 ; Stranik2007 ; Gonzalez2007 . The presence of a plasmonic structure can dramatically alter the optical properties of a locally situated molecule barnes98 ; fort08 : The excitation field is strongly enhanced due to both the surface plasmons and the lightning rod effect for highly curved metal surfaces. This has important consequences in Raman spectroscopy, as the signal can be enhanced by many orders of magnitude via surface enhanced Raman scattering (SERS) from metal nanoparticles nie97 . Furthermore, metallic structures can also modify both the radiative and the nonradiative decay rates for a molecule lakowicz02 ; dulkeith02 ; kuhn06 ; gerber07 ; Muskens2007 , resulting in enhanced fluorescence emission and greater photostability by reducing the excited state lifetime.
Recent improvements in nanofabrication methods have enabled tuning of the LSPR to optimize the optical enhancement properties, for a wide range of nanostructured systems; these include nanoshells Jackson2004 , nanocrescents Kim2006 , nanovoids perney06 , and various other types of nanoparticles Felidj2003 ; Corrigan2005 . Here, we investigate the effects of tuning the plasmon resonance on fluorescence intensity and lifetime, and Raman scattering, for two types of nanostructures. By careful choice of experimental parameters we have been able to separately investigate modifications arising from enhancement of the excitation field and from modified radiative decay mechanisms. For fluorophores on nanostructures with an LSPR matching the fluorescence emission, we have observed a four-fold increase in intensity and an almost 30-fold increase in decay rate relative to unmodified molecules. SERS measurements indicate that enhancement of the excitation field is also highly sensitive to the overlap between the LSPR and the laser / Raman line.
2 Experimental Details
Glass coverslips were immersed in a solution of 3:1 sulphuric acid and hydrogen peroxide for an hour. After rinsing in deionized water, the coverslips were transferred to a solution of ammonium hydroxide, hydrogen peroxide, and water in a 1:1:4 ratio, and heated at 80 ∘C for an hour. The coverslips were then thoroughly rinsed in deionized water again. This process removes organic matter and hydroxylates the glass surface. 500 nm diameter latex spheres (Invitrogen) were diluted in deionized water and drop-cast onto a coverslip, then left to dry; as the water evaporated the spheres assembled into a close-packed lattice vanduyne01 . A 0.5 nm layer of chromium was then deposited onto the slide by thermal evaporation in a vacuum chamber; this increases the adhesion of silver which was subsequently deposited to a thickness of 40 nm. The latex spheres were removed by sonication in chloroform, leaving a continuous periodic array of Ag nanoparticles. All chemicals mentioned in this report were purchased from Sigma Aldrich unless explicitly stated.
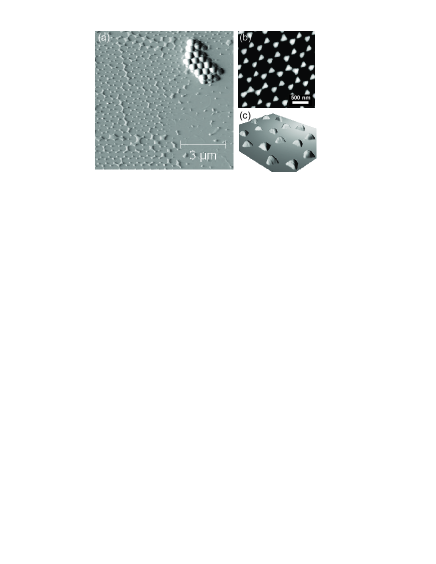
Figure 1(a) shows an atomic force microscopy (AFM) image of a boundary region of nanoparticles, formed from a single layer of latex spheres (left side). There is a small region of residual latex spheres in the top right corner. Figure 1(b) shows individual particles within the array, which have a base length of 120 nm; Figure 1(c) is a 3-dimensional representation showing the formation of well defined facets.
To investigate the plasmonic effects of the nanoparticles on nearby fluorophores, two identical samples were fabricated as described above. One sample was kept as a control, and the second was modified by growing a thin capping layer of SiO2: 200 l of undiluted (3-aminopropyl)trimethoxysilane (APS) was spin-coated onto the sample; this has a strong chemical affinity for metal surfaces and acts as a primer to render the surface vitreophilic. The sample was then left overnight in a solution of sodium silicate and ammonium hydroxide at pH 11.75, which produced a SiO2 shell a few nanometers thick Liz-Marzan1996 . Extinction spectroscopy (Perkin-Elmer Lambda 800) was used to determine the LSPRs of the samples.
For fluorescence measurements, a chlorophyll derivative pheophorbide-a (PPa) was dissolved to a concentration of M in a 0.75 solution of poly(methylmethacrylate) (PMMA) in toluene. 200 l of this solution was spin-coated on both of the different nanoparticle arrays at 2000 rpm for 1 minute; this produced a thin film (20 nm) of PPa in a PMMA matrix, uniform across the sample. Each sample was prepared for high resolution optical measurements by applying a thin layer of index-matching polymer mountant (Mowiol 4-88) to a clean coverslip and affixing this on top of the nanoparticle array / PPa film.
Fluorescence lifetime and intensity images were obtained using a scanning confocal microscope (Leica TCS SP2, 63 water objective, 1.2 NA), with a synchronous time correlated single photon counting module (Becker and Hickl SPC-830). Excitation was with a 488 nm continuous-wave (CW) Ar+ laser (intensity) or 467 nm 20 MHz pulsed diode laser (Hamamatsu PLP) (lifetime), at a power far below fluorescence saturation in both cases. Decay transients were analyzed using iterative reconvolution (TRI2 software), including an instrumental response of 90 ps.
For Raman investigations, an array of Ag nanoparticles was created using 650 nm latex spheres, as described above. Rhodamine 6G (R6G) dye was then deposited onto the array by vacuum sublimation to produce a uniform monolayer coverage. Spatially averaged Raman spectra were acquired using a Renishaw spectrometer with a 20 objective lens (Leica, 0.4 NA). To reduce fluorescence background, excitation was at 752 nm using a home-made tunable CW Ti:sa laser. To obtain high resolution SERS maps, a 100 objective lens (Leica, 1.4 NA) was used with a high precision scanning stage (Prior H101).
3 Fluorescence Enhancement
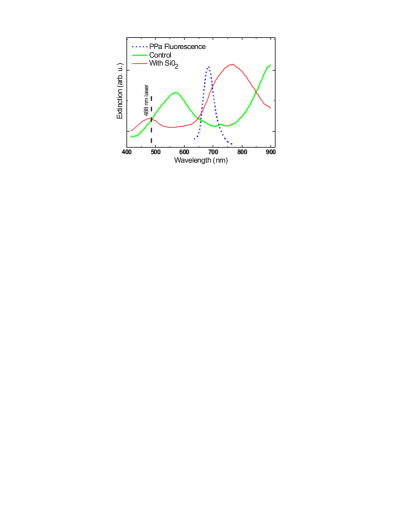
Extinction spectra from the two nanoparticle samples are shown in Figure 2. Each spectrum has two main extinction resonances corresponding to dipole (650 nm) and quadrupole (650 nm) LSPR modes schatz03 ; nelayah07 . The addition of the SiO2 capping layer has produced a large shift (150 nm) in the position of both LSPR modes; crucially, the main dipole peak has a much larger overlap with the emission spectrum of PPa, shown as a dotted line in Figure 2. AFM analysis of the nanoparticles after SiO2 growth shows a negligible change in height, but a more spheroidal shape than the control nanoparticles. Extinction measurements taken after the addition of the PPa film and mountant showed a negligible shift and slight narrowing of the LSPR peak, for both samples. This suggests that, for the thin SiO2 layer used here, the shift in LSPR position due to a change in the dielectric environment is much less than the shift resulting from other factors such as size and shape vanduyne01 ; mock02 .
Importantly, the laser excitation wavelengths are far from the dipole LSPR peaks shown in Figure 2, in a region where the extinction characteristics are almost identical for both samples. The excitation is also off-resonance with all PPa absorption peaks Korth1998 . Any effects originating from an increased excitation field should be greatly reduced, and similar for both samples kuhn06 ; hence, any differences in the fluorescent properties of the two samples will result from changes in resonant coupling of emission radiation to plasmons in the metal nanoparticles, as discussed below.
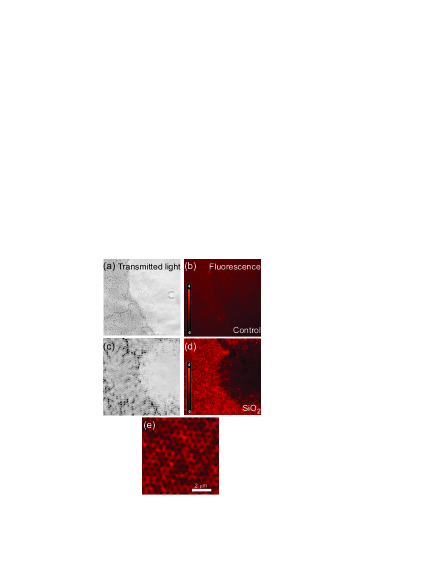
Figure 3(a) is a transmitted light image of a boundary region between nanoparticles and glass similar to that of Figure 1(a), for the control sample. The corresponding confocal PPa fluorescence signal detected from this region is shown in Figure 3(b). Figures 3(c) and (d) are transmitted and fluorescence images for the SiO2 capped nanoparticles, respectively. Figure 3(e) is a high resolution image from a region in (d). Spectral analysis has verified that the emission originates from PPa and is not caused by photoluminescence from the nanoparticles or scattered laser light. In contrast to the control sample, the fluorescence images show highly localized enhancement from fluorophores close to nanoparticles; the intensity scale has been normalized between Figures 3(b) and (d) to the signal from the glass. These images show a four-fold increase in emission intensity for fluorophores on nanoparticles modified by SiO2 relative to the control sample. The actual enhancement in the vicinity of the nanoparticles is much greater than that measured in the far-field: within a confocal spot of 400 nm diameter, only those fluorophores within approximately 10–20 nm of the nanoparticle will show significant enhancement anger06 ; rm07 ; this corresponds to 5 of the excitation region. For the control sample, the essentially uniform fluorescence intensity indicates that any enhancement effects from the nanoparticles are negated by quenching close to the metal. Further tests were done to verify that this increase in enhancement is a direct result of the LSPR shift, as described in the next section.
4 Fluorescence Lifetime Modification
Using time-resolved fluorescence measurements, it is possible to further verify the separate contributions to the fluorescence enhancement arising from modified excitation and decay channels in the presence of a metal nanoparticle.
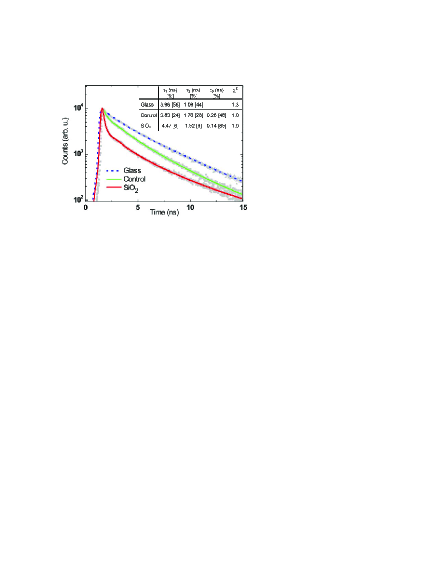
Figure 4 shows spatially integrated decay transients from the PPa film on glass and on nanoparticles with and without SiO2. Each transient has been fitted with a bi- or tri-exponential decay: the corresponding lifetime components, their respective relative amplitudes, and reduced values are summarized in the table. The errors in the lifetimes are all ns.
The fluorescence decay of PPa on glass has a biexponential nature with 4 ns and 1 ns components of approximately equal amplitude; this is due to concentration quenching and thin film effects. Lifetime measurements were taken of PPa in 0.75 PMMA in toluene, before spin-coating, at concentrations of M and M. These had mono-exponential decays with lifetimes of 5.6 ns and 6.0 ns, respectively, which are consistent with previously reported values for PPa in different environments and concentrations Korth1998 ; Roder2000 . The quantum yield of PPa is also significantly reduced in a thin film due to interactions with the matrix and other dye molecules: Lagorio et al. have reported values of around 0.05 for PPa samples exhibiting similar lifetimes to those measured here for PPa on glass Lagorio2001 .
For PPa on nanoparticles without SiO2, the fluorescence decay has two components similar to those on glass, and an additional short lifetime component of 260 ps which accounts for approximately half of the total amplitude. However, the decay transient for PPa on the SiO2 sample is significantly different, and essentially comprises just a single lifetime of 140 ps. This indicates a 30-fold increase in decay rate relative to unmodified fluorophores on glass. These results are consistent with spatially resolved lifetime measurements we have taken for R6G dye on nanoparticles: we observed an order of magnitude increase in decay rate from a localized volume around the nanoparticles due to the additional metal-induced radiative mechanisms rm07 .
Lakowicz has proposed that excited fluorophores can nonradiatively transfer energy to surface plasmons, which in turn radiate the emission of the coupling fluorophores Lakowicz2005 . As the transfer efficiency approaches 100 , the effective quantum yield of the fluorophore approaches unity Aslan2005 . For the samples investigated here, the increased decay rate and intensity for the SiO2 sample is consistent with a more efficient coupling of the PPa fluorescence to surface plasmons, leading to an order of magnitude increase in quantum yield.
As the SiO2 capping layer is relatively thin (5 nm), fluorescence quenching effects will be significant for both nanoparticle arrays Stranik2007 ; however, quenched fluorophores will give a negligible contribution to the total fluorescence lifetime signal and the effects can be disregarded. The residual longer lifetime components seen for the SiO2 sample are probably from unmodified fluorophores in the film far from the nanoparticles Muskens2007 , as discussed in the previous section.
Further tests were done to check that the observed modifications to fluorescence intensity and lifetime originated from the shift in plasmon resonance between the samples, and were not caused by the SiO2 itself: Additional nanoparticle arrays were fabricated with varying amounts of Ag deposited but no SiO2. After measuring the extinction spectra, a sample was chosen with an almost identical LSPR peak to that of the SiO2 sample. A thin film of PPa in PMMA was then deposited, and fluorescence intensity and lifetime measurements were taken as before. The results are very similar to those shown in Figures 3 and 4 for the SiO2 sample: strong fluorescence enhancement is observed around the nanoparticles and the fluorescence decay is essentially monoexponential with a lifetime of 150 ps.
5 Surfaced enhanced Raman scattering
5.1 Nanoparticle arrays
In contrast to the mechanisms discussed in the last section, the enhanced Raman signal seen in SERS measurements is due to the increase in intensity of the local excitation field around an individual nanoparticle: maximum SERS enhancement should occur when the LSPR coincides with a wavelength between that of the exciting laser and the Raman line Felidj2003 . With these optimum excitation conditions, the SERS enhancement depends on the fourth power of the total electric field , due to an increase in both the incident laser field and the emission field at the Raman frequency kneipp02 .
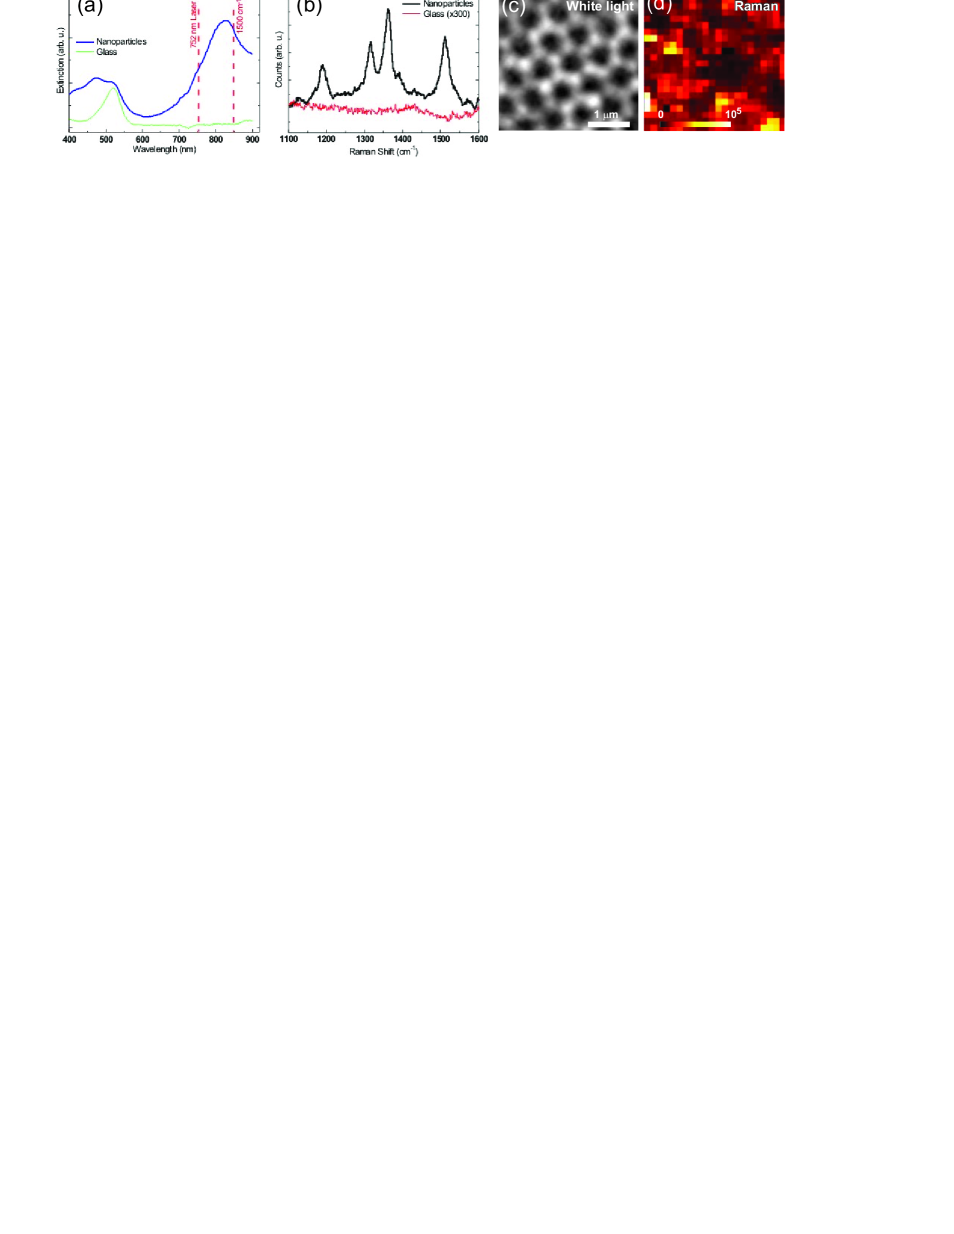
To investigate the suitability of these nanoparticles for use in SERS-based biosensors, an array of Ag nanoparticles was covered with a thin film of R6G, as described previously. Figure 5(a) shows ensemble extinction spectra from the R6G covered nanoparticles and from R6G on glass. Figure 5(b) shows the Raman spectra from R6G on a region of nanoparticles (2 s acquisition time) and from R6G on glass (10 min acquisition time). As no Raman signal was obtained from the glass region, it is not possible to calculate an absolute value for the enhancement factor; however, a lower limit of can be estimated using the noise level in the glass spectrum. To further investigate the SERS enhancement, high resolution spatial maps were obtained of the Raman signal over the nanoparticles; Figure 5(d) shows the integrated intensity under the 1500 cm-1 Raman line, for a region of nanoparticles similar to 5(c).
Figure 5(a) shows that the position of the ensemble LSPR peak for this nanoparticle array lies between the exciting laser and the Raman lines; hence we would expect a very strong overall SERS enhancement, as seen in Figure 5(b). However, the LSPR of an individual nanoparticle is highly sensitive to small changes in its size, shape, and local environment Sherry2006 ; hence, variations between nanoparticles will lead to highly localized differences in the field enhancement. This is particularly noticeable in SERS measurements, due to the dependence, and results in the creation of optical “hot spots”, as seen in Figure 5(d) gresillon99 .
5.2 Thin Ag films
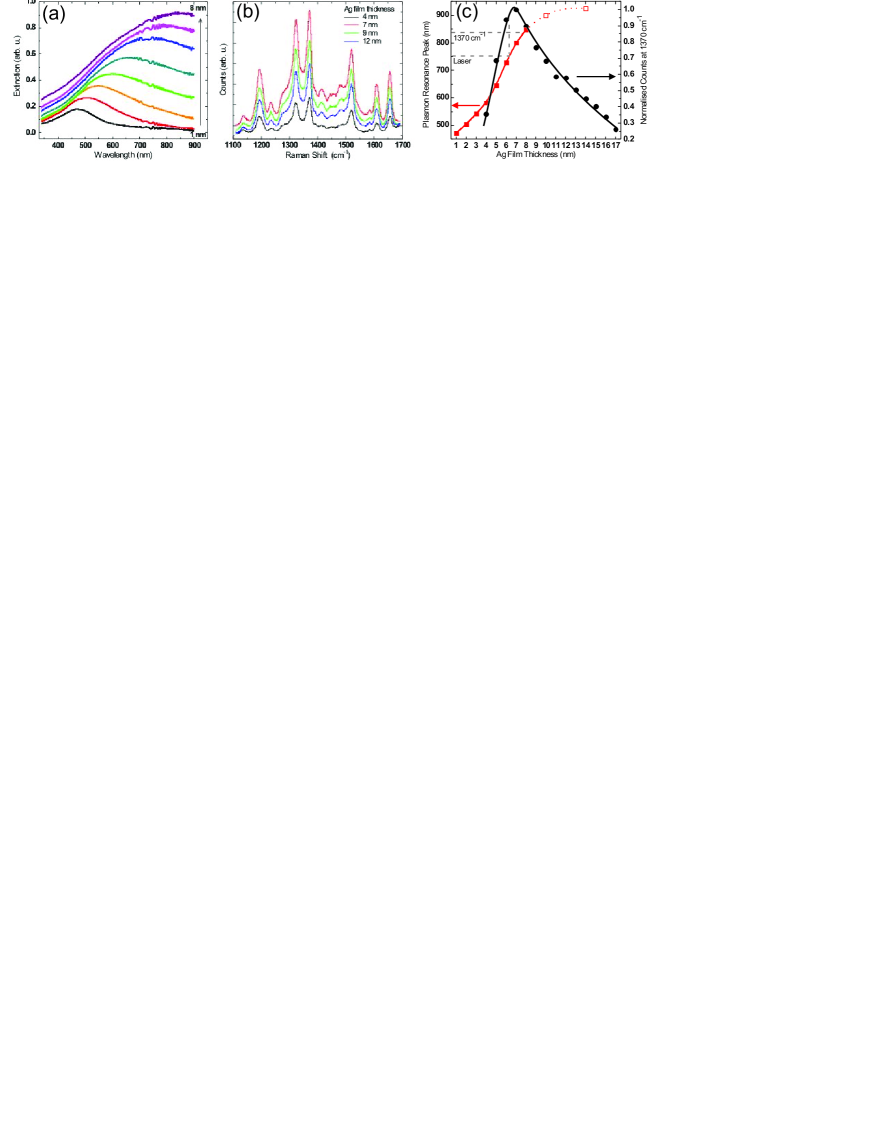
The effect of tuning the plasmon resonance on SERS enhancement was also investigated: a sample was prepared by thermal deposition of Ag films with a range of nominal thicknesses, on the same glass slide. Extinction spectra were then taken, as shown in Figure 6(a): the position of the plasmon resonance shifts from below 500 nm to above 900 nm with increasing film thickness.
A thin layer of R6G dye was deposited by vacuum sublimation, creating a uniform coverage over the different Ag films. Raman spectra were acquired using a 752 nm laser and a 20 objective, and are shown in Figure 6(b) for a selection of Ag films. The data from Figures 6(a) and (b) are summarized in 6(c): The left axis (squares) shows the shift in the plasmon peak with increasing film thickness, with the dotted region indicating estimated positions outside of the instrument range. The right axis (circles) shows the intensity of the Raman peak at 1370 cm-1, normalized to the maximum value. The dashed lines indicate the wavelength of the laser and a corresponding shift of 1370 cm-1.
With increasing film thickness, the SERS enhancement shows a sharp maximum at 7 nm and decreases again for thicker films. As discussed above, when both the incident laser light and the Raman signal are near resonance with the plasmon energy, the SERS enhancement will have a maximum dependence; the data in Figure 6(c) show very good agreement with this. A rigorous analysis of the data requires additional factors to be considered, such as grain size, morphology, and surface coverage; this will be reported elsewhere.
6 Conclusion
We have presented an investigation into the effects of tuning the plasmon resonance of metal nanoparticles on the optical properties of nearby fluorophores. Two essentially identical arrays of nanoparticles were prepared, and the LSPR position of one was shifted to produce a large overlap with the emission from a thin layer of the chlorophyll derivative PPa. For the modified sample, we observe a four-fold increase in fluorescence intensity and an almost 30-fold increase in decay rate relative to unmodified fluorophores. By careful choice of experimental parameters we have been able to decouple the influence of changes in the excitation field; the results are consistent with a greatly increased efficiency for energy transfer from fluorescence to surface plasmons, for the optimized nanoparticles. The effect of tuning the LSPR on SERS signal was also investigated; in this case a maximum enhancement occurs when both the incident laser light and the Raman signal are near resonance with the plasmon energy. Spatial mapping of the SERS signal from a nanoparticle array shows an enhancement of more than 5 orders of magnitude in small hot spots, due to highly localized differences in the excitation field. These results have important implications for a wide range of fluorescence-based technologies; in particular, plasmonic engineering of nanostructures will have a crucial role in the development of novel biomedical applications, including biosensors, high throughput screening systems, and non-invasive therapy.
7 Acknowledgements
The authors would like to thank K. Suhling and M. Green (Dept. of Physics, King’s College London) for helpful discussions and advice. This work was supported by the EPSRC (UK).
References
- (1) Stuart D et al (2005) Biological applications of localised surface plasmonic phenomenae. IEE Proc: Nanobiotech 152(1):13–32
- (2) Haynes C, Van Duyne R (2001) Nanosphere lithography: A versatile nanofabrication tool for studies of size-dependent nanoparticle optics. J Phys Chem B 105(24):5599–5611
- (3) Mock JJ et al (2002) Shape effects in plasmon resonance of individual colloidal silver nanoparticles. J Chem Phys 116(15):6755–6759
- (4) Kelly K et al (2003) The optical properties of metal nanoparticles: The influence of size, shape, and dielectric environment. J Phys Chem B 107(3):668–677
- (5) Jin R et al (2003) Controlling anisotropic nanoparticle growth through plasmon excitation. Nature 425(6957):487–490
- (6) Rechberger W et al (2003) Optical properties of two interacting gold nanoparticles. Opt Commun 220(1-3):137–141
- (7) Murray W et al (2006) Overlayers on silver nanotriangles: Field confinement and spectral position of localized surface plasmon resonances. Nano Lett 6(8):1772–1777
- (8) Stranik O et al (2007) Optimization of nanoparticle size for plasmonic enhancement of fluorescence. Plasmonics 2(1):15–22
- (9) Gonz lez AL, Noguez C (2007) Optical properties of silver nanoparticles. Phys Status Solidi (c) 4(11):4118–4126
- (10) Barnes WL (1998) Fluorescence near interfaces: the role of photonic mode density. J Mod Opt 45:661–699
- (11) Fort E, Grésillon S (2008) Surface enhanced fluorescence. J Phys D: Appl Phys 41(1):013001
- (12) Nie S, Emory SR (1997) Probing single molecules and single nanoparticles by surface-enhanced Raman scattering. Science 275(5303):1102–1106
- (13) Lakowicz JR et al (2002) Radiative decay engineering: 2. Effects of silver island films on fluorescence intensity, lifetimes, and resonance energy transfer. Anal Biochem 301(2):261–277
- (14) Dulkeith E et al (2002) Fluorescence quenching of dye molecules near gold nanoparticles: Radiative and nonradiative effects. Phys Rev Lett 89(20):203002
- (15) Kühn S et al (2006) Enhancement of single-molecule fluorescence using a gold nanoparticle as an optical nanoantenna. Phys Rev Lett 97(1):017402
- (16) Gerber S et al (2007) Tailoring light emission properties of fluorophores by coupling to resonance-tuned metallic nanostructures. Phys Rev B 75(7):073404
- (17) Muskens O et al (2007) Strong enhancement of the radiative decay rate of emitters by single plasmonic nanoantennas. Nano Lett 7(9):2871–2875
- (18) Jackson JB, Halas NJ (2004) Surface-enhanced Raman scattering on tunable plasmonic nanoparticle substrates. Proc Nat Acad Sci 101(52):17930–17935
- (19) Kim J et al (2006) Spectral tuning of localised surface plasmon-polariton resonance in metallic nano-crescents. IEE Proc: Nanobiotech 153(3):42–46
- (20) Perney NM et al (2006) Tuning localized plasmons in nanostructured substrates for surface-enhanced raman scattering. Opt Express 14(2):847–857
- (21) Felidj N et al (2003) Optimized surface-enhanced Raman scattering on gold nanoparticle arrays. Appl Phys Lett 82(18):3095–3097
- (22) Corrigan T et al (2005) Enhanced fluorescence from periodic arrays of silver nanoparticles. J Fluorescence 15(5):777–784
- (23) Liz-Marzan L et al (1996) Synthesis of nanosized gold-silica core-shell particles. Langmuir 12(18):4329–4335
- (24) Nelayah J et al (2007) Mapping surface plasmons on a single metallic nanoparticle. Nat Phys 3:348–353
- (25) Korth O et al (1998) Photophysical investigations of Langmuir-Blodgett mono- and multilayer films of pheophorbide-a. Thin Solid Films 320(2):305–315
- (26) Anger P et al (2006) Enhancement and quenching of single-molecule fluorescence. Phys Rev Lett 96(11):113002
- (27) Ritman-Meer T et al (2007) Spatial imaging of modifications to fluorescence lifetime and intensity by individual ag nanoparticles. Appl Phys Lett 91(12):123122
- (28) Röder B et al (2000) Photophysical properties of pheophorbide a in solution and in model membrane systems. J Porphyrins Phthalocyanines 4(1):37–44
- (29) Lagorio MG et al (2001) Photophysics on surfaces: Absorption and luminescence properties of Pheophorbide-a on cellulose. Phys Chem Chem Phys 3(8):1524-1529
- (30) Lakowicz JR (2005) Radiative decay engineering 5: Metal-enhanced fluorescence and plasmon emission. Anal Biochem 337(2):171–194
- (31) Aslan K et al (2005) Annealed silver-island films for applications in metal-enhanced fluorescence: Interpretation in terms of radiating plasmons. J Fluorescence 15(5):643–654
- (32) Kneipp K et al (2002) Surface-enhanced raman scattering and biophysics. J Phys: Condens Matter 14(18):R597–R624
- (33) Sherry L et al (2006) Localized surface plasmon resonance spectroscopy of single silver triangular nanoprisms. Nano Lett 6(9):2060–2065
- (34) Grésillon S et al (1999) Experimental observation of localized optical excitations in random metal-dielectric films. Phys Rev Lett 82(22):4520–4523