Multifragmentation threshold in
collisions at 30 MeV/nucleon
Abstract
We analyzed the on reaction at MeV/nucleon in the aim of disentangling binary sequential decay and multifragmentation decay close to the energy threshold, i.e. MeV/nucleon. Using the backtracing technique applied to the statistical models GEMINI and SMM we reconstruct simulated charge, mass and excitation energy distributions and compare them to the experimental ones. We show that data are better described by SMM than by GEMINI in agreement with the fact that multifragmentation is responsible for fragment production at excitation energies around MeV/nucleon.
keywords:
Backtracing technique , multifragmentation , binary sequential , excitation energy , SMM , GEMINIPACS:
25.70.-z 25.70.Pq 24.10.PaINDRA and CHIMERA collaborations
, , , , , , , , , , , , , , , , , , , , , , , , , , , , , , , , , , , ,
1 Introduction
Heavy ion collisions at intermediate energy (20-100 MeV/nucleon) feature several mechanisms, such as fusion, deep inelastic collisions (DIC) and direct reactions present at low energy, or incomplete fusion and multifragmentation, characteristic of higher energies [1]. Through heavy-ion collisions, very excited nuclei can be produced offering the possibility to study nuclei far from their ground state conditions. The investigation of the thermodynamical properties of nuclear matter, such as temperature, density, excitation energy, can then be carried out. There is intense theoretical and experimental research surrounding the debate on the presence of a liquid-gas phase transition at the origin of the multifragmentation process [2]-[6].
At low excitation energies, the decay of hot nuclei follows the predictions of the statistical model for a compound nucleus, and the deexcitation occurs by binary sequential decays [7],[8]. For systems excited at higher energy around 3 MeV/nucleon [9], the multifragmentation channel opens which is interpreted as a manifestation of a liquid-gas phase transition [10]. Many experimental clues have been collected recently [3],[11] on multifragmentation and its relation to phase transition. Nonetheless the question is still debated. Disentangling binary sequential decay from multifragmentation close to the threshold should help to better define the thermodynamical properties mentioned above.
In this aim we will study the decay of hot nuclei formed in the reaction at MeV/nucleon [12]. Using the backtracing technique [13]-[15] the data will be compared with the predictions of two codes : GEMINI [16] for binary sequential decay, and the Statistical Multifragmentation Model (SMM) [17] for multifragmentation. The reaction dynamics was simulated by Boltzmann-Nordheim-Vlasov (BNV) transport model simulations which describe the evolution of the one-body distribution function according to the nuclear mean field and including the effects of two-body collisions with the test-particle method [18], [19]. We used a soft equation of state ( MeV) and a free nucleon-nucleon collision cross-section . The time evolution of the density contour in the reaction plane for various impact parameters was simulated [20]. Those simulations [12] predict the formation of a single source by incomplete fusion for small impact parameters ( fm). For larger impact parameters the mechanism showed a binary character with formation of two sources, quasi-projectile (QP) and quasi-target (QT). In this paper we will study the decay of incomplete fusion and QP sources.
2 The Experiment
Collisions of ions at 30 MeV/nucleon with a thick target were studied at the GANIL facility using the INDRA multidetector. INDRA is constituted by 324 independent telescopes on 16 rings : the telescopes covering the polar angular range from to are comprised of an ionization chamber, a 300 m thick silicon detector and a CsI(Tl) scintillator. Those covering the range from to are comprised of two layers : an ionization chamber and a CsI(Tl) crystal [21]-[24].
The reaction was measured during a campaign of experiments for which INDRA was coupled to the CHIMERA ([25] - [27]) first ring, which covered the angular range from to , and some INDRA modules in the horizontal plane were replaced by silicon strip detectors. However, for the present reaction study, none of these additional detectors were used. INDRA detects charged particles and fragments with an efficiency close to of the whole solid angle and a high granularity in order to reduce double counting (down to ). The identification thresholds are low ( MeV/nucleon). INDRA can measure ion charge and energy in a wide range and it can resolve masses up to Z=4.
The energy calibration of the silicon detectors and ionization chambers for heavy fragments was obtained by elastic scattering of Ar, Ni and Xe beams on a gold target at incident energies from 7 to 9 MeV/nucleon. For the scintillators the energy calibration was accomplished with secondary beams of hydrogen and helium isotopes at different energies. The charge identification was realized by means of a seven parameter fit of the - matrices [28] which well reproduces the form of the lines for each atomic number, . Unit charge resolution was obtained for all nuclei produced in this reaction.
The data for the at 30 MeV/nucleon were recorded with an acquisition trigger requiring at least 5 fired telescopes. The calculated reaction cross section is barns [29]. The total measured cross-section, calculated from the target thickness, integrated beam current, and total number of recorded events, corrected for dead time, is barns. The lower experimental value is due to the lack of detection at forward angles () and, above all, to the acquisition trigger condition which eliminates the most peripheral collisions. For this reaction, the available center of mass energy is MeV and the projectile velocity is cm/ns. The grazing angle is .
3 Data Analysis
3.1 Event Selection
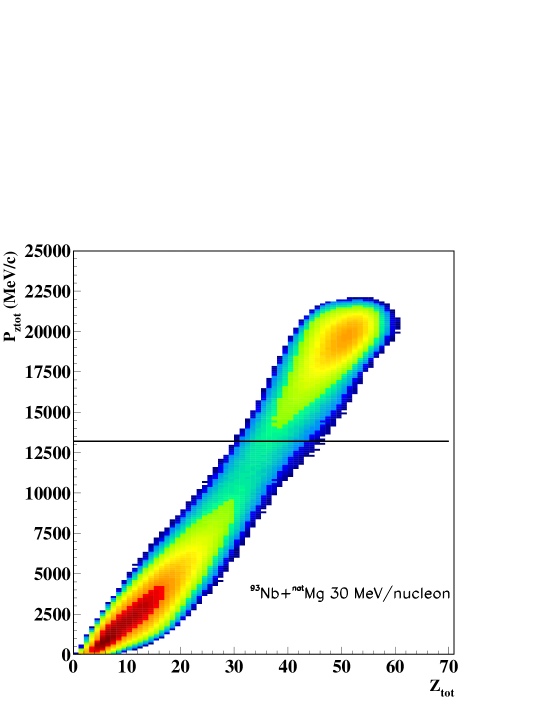
In order to select well-detected events, we used the correlations (see figure 1), the total parallel momentum versus the total charge on an event by event basis. For the analysis, only the events with a total parallel momentum greater than of the beam momentum were kept, MeV/c.

The events were sorted as a function of two observables correlated with the impact parameter [30]: , the total transverse energy, and , the total charged particle multiplicity. Three regions are defined according to cuts made perpendicular to the ridge line of this correlation, which we refer to as T1, T2 and T3 (see figure 2). The cuts were made in order to retain approximately the same number of events in each region. Events in the T1 region correspond to less dissipative (peripheral) collisions, while those in T3 correspond to more dissipative (central) collisions. Table 1 shows the corresponding average values of the total transverse energy, the total multiplicity, the residue (the biggest fragment) velocity and charge in the three regions.
| cm/ns | ||||
|---|---|---|---|---|
| T1 | ||||
| T2 | ||||
| T3 |
3.2 Source Reconstruction
The source (QP or incomplete fusion) is isolated by a selection in parallel velocity of different particles, as shown in figure 3. The value of the velocity cut was adjusted, for each region and for particles with values ranging from to , in order to symmetrize the forward-backward emission in the source reference frame. Figure 4 shows the result for the region T1 : the energy spectra of the particles emitted in the forward or backward hemisphere of the source frame are very similar in most cases. Similar features are observed for the regions T2 and T3.
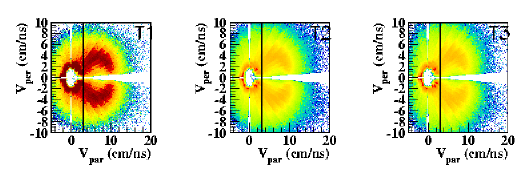
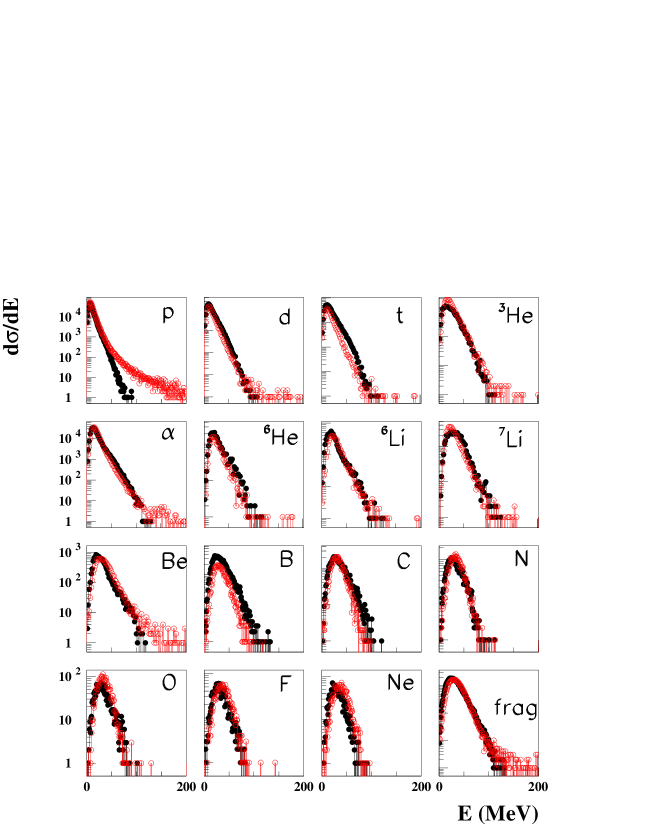
Table 2 shows the values of the velocity cuts for each particle for each region.
| Z | A | cm/ns | cm/ns | cm/ns |
| 1 | 1 | 3. | 3. | 3. |
| 1 | 2 | 3.2 | 3.2 | 3.2 |
| 1 | 3 | 3.4 | 3.4 | 3.4 |
| 2 | 3 | 3.8 | 3.8 | 4. |
| 2 | 4 | 4. | 4. | 4. |
| 2 | 6 | 4. | 4. | 4. |
| 3,4 | - | 4.3 | 4.3 | 4.5 |
| 5,6 | - | 4.4 | 4.5 | 4.5 |
| - | 5. | 5. | 5. |
The charge of the source is obtained as the sum of the charge of all particles having a parallel velocity greater than the cut velocity .
| (1) |
Each source velocity component is evaluated as an average weighted by the charge of each particle of the source :
| (2) |
Since INDRA does not allow a complete mass determination, we made the hypothesis that the source has the same isotopic ratio as the projectile :
| (3) |
The neutron multiplicity, , is estimated as the difference between the source mass and the sum of the masses of the different ejectiles :
| (4) |
where the are estimated with the help of two parameterizations : one from a cubic polynomial fit on the -valley stability :
| (5) |
and the other as in references [16] and [31] :
| (6) |
The excitation energy is obtained by calorimetric recontruction :
| (7) |
In the equation 7 is the kinetic energy of each particle in the source reference frame, ( for the source) is the mass defect and is the neutron kinetic energy proportional to the source temperature :
| (8) |
where takes into account the temperature decrease as the source emits neutrons [32].
In table 3 are reported the average characteristics of the reconstructed source for the three regions : the charge , the mass , the average multiplicities for protons , alphas , fragments (biggest one included); the neutron multiplicity and excitation energy obtained with mass parameterization; the neutron multiplicity and the excitation energy obtained with mass parameterization. As it can be seen from the table, the two sets of excitation energies differ by about 0.5 MeV/nucleon. This is mainly due to the difference in the deduced neutron multiplicity with the two possible choices for the residue mass. Although the average fragment multiplicity is low, the excitation energy for the regions T2 and T3 is about MeV/nucleon, value at which experimental results agree to set the multifragmentation threshold [4],[9].
4 GEMINI and SMM Backtracing Simulations
We now compare the data with the results of two statistical codes, GEMINI [16] and SMM [17]. One expects that experimental results are relative to an ensemble of various sources (defined by distributions of charge, mass and excitation energy). We therefore applied a backtracing procedure ([13] -[15]) to GEMINI and to SMM simulations in order to determine these distributions.

The procedure begins by first choosing the observables which will be used to constrain the source distributions. In our case we chose the multiplicity distributions of protons, alphas and fragments and the charge distribution of the residue and of all the products. This choice was made because these observables do not depend on the hypothesis taken for the mass of the source. In a second step, the procedure explores a 4-dimensional space constituted by the source variable parameters : charge , mass , excitation energy and angular momentum (for GEMINI) or rotational energy (for SMM). The source parameter distributions are extracted from this 4-dimensional space with the help of the Kolmogorov-Smirnov test applied to simulated and experimental observable distributions. The simulated events are filtered in each step using a software replica of the experimental apparatus and conditions. This iterative procedure converges to give the parameter distributions of the simulated sources, which can then be compared with those reconstructed experimentally in order to test the agreement of data with both models.
The region T1, representing the most peripheral events, could be affected by an experimental bias due to the trigger condition which suppresses low multiplicity events. Conversely, the region T3, representing more dissipative events, is supposed to be less altered. Therefore we focused our attention on T3, this latter being of major interest for the study of multifragmentation threshold. Figure 5 shows the comparison between experimental observables (full circles) and backtraced observables from GEMINI (open squares) for region T3. The charge distribution is poorly reproduced, with a lack of fragment production with together with a strong underestimation of the alpha particle multiplicity. In this case the average angular momentum from the GEMINI backtracing is about , sufficiently high to permit complex particle emission. This spin value is in agreement with other findings on rather similar systems [33].
The maximum of the source charge distribution, shown in Figure 6, is shifted to lower values as compared to the experimental data, although both distributions have the same mean value (see Table 4).


Figure 7 displays the excitation energy distributions for and parameterizations. It is possible to note a better agreement for the data treated with the mass parameterization since the mean values of the compared distributions are coincident. The comparison with the data according to the other mass parameterization shows a shift of about 0.5 MeV/nucleon.
Figures 8-10 present the same comparison as before for the SMM calculation. A much better agreement is observed : the residue charge and the total charge distributions are nicely reproduced and the disagreement on the alpha multiplicity (as well as in the fragment multiplicity) is less severe than with GEMINI.

It is worth noting that the best agreement with data was found for SMM calculations performed with a freeze out volume of , and a rotational energy corresponding to an angular momentum of for the QP source.


Figures 9 and 10 show the comparison for the source variables : they display a good agreement between the simulated and the experimental distributions. The data treated with the mass parameterization show the same shift in the mean value as observed with GEMINI.
| MeV/nucleon | MeV/nucleon | |||
|---|---|---|---|---|
| Data | ||||
| GEMINI | ||||
| SMM |
In table 4 are reported the mean values of the source variables for the data, for GEMINI and for SMM. Both models give a fair agreement with data. One should note that mean values are not sufficient to quantify the agreement between the experiment and the model. Indeed, the examination of figures 5 to 10 shows that overall SMM gives a better description of the data than GEMINI. Therefore we can conclude that for excitation energies above MeV/nucleon, the introduction of some degree of multifragmentation in the decay of hot nuclei is mandatory in order to reproduce experimental results.
5 Discussion and Conclusions
We also deduced the average source temperatures from both models in order to compare them to the current systematics provided by Natowitz et al. in reference [11].
In table 5 are shown the average temperature and mass values of the systems for each region.A close comparison of these values for the region T3 with those obtained for the limiting temperature of reference [11] shows a good agreement : the systems of this region may undergo multifragmentation. This is consistent with the conclusions drawn in the previous section, i.e. the presence of events to be described by a multifragmentation scenario.
| MeV | MeV | ||
|---|---|---|---|
| T1 | 3.55 | - | |
| T2 | 4.54 | 4.87 | |
| T3 | 5.19 | 5.56 |
In perspective one should understand why the alpha particle multiplicity is underestimated by GEMINI. This could be connected to the dependence of the level density parameter from the excitation energy ([34],[35]). In the present work, the Lestone parameterization was used , but there are different formulae describing this dependence of that could be used alternatively in the backtracing.
In order to better enhance the differences between the two models, an attempt could also be done using the backtracing of dynamical observables , more sensitive to the Coulomb effects [36]. One should however recall that some of the dynamical observables (like velocities for example) are mass dependent. This addresses the problem of the choice of the mass parameterization previously evoked. On this subject, we may hope to gain some useful insight by upgrading in the mass identification of existing devices like CHIMERAPS or by new generation projects like FAZIA (Four 4 A Z Ion Array) [37].
Acknowledgements
This work was supported by the LPC (Laboratoire de Physique Corpusculaires) Caen and by the AFFDU (Association Française des Femmes Diplômées des Universités).
References
- [1] H.Fuchs and K.Mhring, Rep. Prog. Phys. 57 (1994) 231.
- [2] S.Shlomo and J.B.Natowitz, Phys. Rev. C 44 (1991) 2878.
- [3] European Physical Journal A30 (2006), Special Issue : Dynamics and Thermodynamics With Nuclear Degrees of Freedom.
- [4] J. Pochodzalla et al., Phys. Rev. Lett. 75 (1995) 1040.
- [5] M.D’Agostino et al., Phys. Lett. B 473 (2000) 219.
- [6] J.Richert and P.Wagner, Phys. Rep. 350 (2001) 1.
- [7] H.A.Bethe, Phys. Rev. 50 (1936) 332.
- [8] A.Bohr and B.Mottelson, Nuclear Structure, Vol.1, Benjamin Ed., New York, (1969).
- [9] G. Bizard et al.,Phys. Lett B 302 (1993) 162.
-
[10]
G.F Bertsch, P.J. Siemens, Phys. Lett. 126 B (1983) 9;
J.E. Finn et al., Phys. Rev. Lett 49 (1982) 1321. - [11] J.B.Natowitz et al., Phys. Rev. C 65 (2002) 34618.
-
[12]
L.Manduci, PhD Thesis(2004), Université de Caen (France),
http://tel.archives-ouvertes.fr/tel-00011469/fr/ - [13] P. Désesquelles et al., Nucl. Phys. A604 (1996) 183.
- [14] P. Désesquelles et al., Nucl. Phys. A633 (1998) 547.
- [15] O. Lopez, LPC Caen; Procedings of the XLVIth International Winter Meeting on Nuclear Physics (2008), Bormio (Italy).
- [16] R.J.Charity et al., Nucl. Phys. A476 (1988) 516 and references therein.
- [17] J.P.Bondorf et al., Phys. Rep. 257 (1995) 133.
- [18] A. Bonasera, F. Gulminelli and J. Molitoris, Phys. Rep. 243 (1994) 1.
- [19] A.Guarnera,M.Colonna,Ph.Chomaz, Phys.Lett. B 373 (1996) 267.
- [20] Courtesy Dr. E. Galichet.
- [21] J.Pouthas et al. Nucl. Instr. and Meth. A357 (1995) 418.
- [22] J.Pouthas et al. Nucl. Instr. and Meth. A369 (1996) 222.
- [23] M. Pârlog et al. Nucl. Instr. and Meth. A482 (2002) 674.
- [24] M. Pârlog et al. Nucl. Instr. and Meth. A482 (2002) 693.
- [25] S. Aiello et al. Nucl. Phys. A 583 (1995) 461.
- [26] A. Pagano et al. Nucl. Phys. A 681 (2001) 331.
- [27] A. Pagano et al. Nucl. Phys. A 734 (2004) 504.
- [28] L. Tassan-Got, Nucl. Instr. and Meth. B194 (2002) 503.
- [29] S. Kox et al., Nucl. Phys. A420 (1984) 162.
- [30] L. Phair et al., Nucl. Phys. A548 (1992) 489.
- [31] G.D. Westfall et al. Phys. Rev. Lett. 37 (1976).
- [32] J.C. Steckmeyer et al., Nucl. Phys. A 686 (2001) 537-567.
- [33] J.C.Steckmeyer et al., ArXiv:nucl-ex/0504025v1
- [34] J.P.Lestone, Phys. Rev. C 52 (1995) 1118.
- [35] R.J.Charity et al., Phys. Rev. C 67 (2003) 044611.
- [36] P.Napolitani et al.,Phys. Rev. C 70 (2004) 054607.
- [37] FAZIA website : http://fazia.in2p3.fr