Experimental studies of the transient fluctuation theorem using liquid crystals
Abstract
In a thermodynamical process, the dissipation or production of entropy can only be positive or zero according to the second law of thermodynamics. However the laws of thermodynamics are applicable to large systems in the thermodynamic limit. Recently a fluctuation theorem known as the Transient Fluctuation Theorem (TFT) which generalizes the second law of thermodynamics even for small systems has been proposed. This theorem has been tested in small systems such as a colloidal particle in an optical trap. We report for the first time an analogous experimental study of TFT in a spatially extended system using liquid crystals.
pacs:
05.70.Ln, 61.30.GdThe laws of thermodynamics describe the physical behaviour of macroscopic systems. The second law of thermodynamics states that when such a system is taken from one equilibrium state to another in a process, the change in entropy can only be positive or zero depending on wheather the process is irreversible or reversible respectively. Though the laws of thermodynamics are applicable under very general conditions, these laws are strictly valid only for large systems in the so-called thermodynamic limit. For these large systems, the effects of thermal noise on the average macroscopic physical quantities are not manifested except under special physical conditions such as near phase transitions. However, when the system size is small or more precisely the change in the relevant energy of the system in a process is of the order of the thermal energy , being the Boltzmann constant and being the absolute temperature of the system, the thermal noise is expected to play an important role on it’s behaviour. In particular, the validity of the second law of thermodynamics for small systems is of considerable debate since the time of Boltzmann. Recently a nonequilibrium fluctuation theorem (FT) known as the Transient Fluctuation Theorem (TFT) has been proposed to generalize the second law of thermodynamics for these small systemsevans93 . In its most general form, TFT not only predicts transient violation of second law of thermodynamics when the dissipation is comparable to the thermal energy but also it provides an expression for the probability that a dissipative flux flows in a direction opposite to that required by the second law of thermodynamics. More precisely for a thermostated system at temperature , this theorem states that in a time interval , the probability of a dissipation being positive and the probability of same dissipation being negative in an irreversible process satisfies the following condition
| (1) |
The dissipation being an extensive quantity, the total dissipation increases as either the system size or the observation time is increased. Then the above theorem implies that the production of entropy or positive dissipation will be overwhelmingly more likely than the consumption of entropy or negative dissipation in an irreversible process for large systems or for large observation time in accordance with the second law of thermodynamics. In this way the TFT generalizes the second law of thermodynamics even for small systems. Another FT for these small systems has also been proposed which relates the work done along nonequilibrium trajectories, in taking a system from one equilibrium state to another, to the thermodynamic free energy difference between the initial and final equilibrium states of the systemjarzynski97 . The physics of such small systems has recently gained wide interest in the scientific communityretort03 . Examples of such system include nano-materials, biological molecular machines, quantum dots etc. In particular, the physics of such small systems when driven out of equilibrium is of paramount importance in many technological applications of these systems.
Though considerable theoretical and simulation studiesgallavotti95 ; kurchan98 ; narayan04 ; crooks00 ; williams04 ; seifert05 on these FTs have been reported in the literature, only a few experimental studies on the validity of these theorem have been performed. The main difficulty in the experimental studies of these theorems is in arranging the change in the relevant energy of the system under study to few required for the system to show deviation from macroscopic laws of thermodynamics. Nevertheless, the validity of these fluctuation theorems have been probed experimentally in small systems such as colloidal particle in an optical trapwang02 ; carberry04 , in two-level systemschuler05 , torsion pendulum immersed in a viscous fluidciliberto06 and deformation dynamics of single RNA molecule when stretchedliphardt02 . In fact these theorems have been used to measure the folding free energy of a single RNA molecule when stretchedcollin05 by an external applied force. However, all these experiments are performed on relatively small systems. The validity of these laws in the case of spatially extended systems where the physical properties are described by an effective order parameter which varies in space has not yet been probed experimentally. In this letter, we report on the experimental studies of the TFT for such spatially extended systems using nematic liquid crystals.
Liquid crystals (LC) usually made of rod like organic molecules lack the three-dimensional periodicity of crystals, but have anisotropic physical propertiesdegennes . The simplest LC viz. Nematic LCs, which are used in practically all commercial LC displays (LCD) have a long range orientational order of the long axes of the molecules. The orientational order described by the director can be easily deformed using external perturbations such as electric and magnetic fields. The distortions free energy of the director field can be described in terms of three elastic constants corresponding to the splay, bend and twist types of distortions of the director fielddegennes . In our experiments, a nematic liquid crystal is sandwiched between two appropriately treated tin oxide coated glass plates. The transparent tin oxide coating acts as electrode for the application of an electric field without obstructing the optical measurements. The glass plates are coated with polyimide and rubbed along a certain direction. These treatments of the glass plates align the long axes of the rod-like molecules parallel to the rubbing direction giving rise to the so called homogeneous alignment of the liquid crystals between the plates. When such homogeneously aligned nematic liquid crystals having positive dielectric anisotropy are subjected to an applied electric field perpendicular to glass plates, they exhibit a second order transition to a distorted structure (fig. 1a) above a threshold electric field. This is known as the Frederickz transitiondegennes .

Above the Frederickz threshold, the equilibrium structure of the nematic liquid crystal depends on the applied electric field.
As liquid crystals have anisotropic physical properties, the refractive index for light polarized parallel to the director (extraordinary ray) is different from that of corresponding to light polarized perpendicular to (ordinary ray). This anisotropy in the refractive index of liquid crystals in this geometry gives rise to a phase difference () between the extraordinary and ordinary ray of the light beam passing through the sample and incident normal to the glass plates. The phase difference depends on the orientations of the director between the plates. In the absence of the applied electric field, the director is parallel to the x-axis and for light propagating along the z-axis, where is the birefringence of the LC sample and , are the thickness of the LC sample and the wavelength of the light respectively. When the applied electric field is increased beyond the Frederickz threshold, the director progressively becomes parallel to the electric field and decreases with increasing electric field. Thus the change in the director configuration can be monitored by measuring the change in using an interferometric technique under crossed polarizers. We have experimentally studied the dissipative relaxation dynamics of when the liquid crystal is driven from one equilibrium state to another by a step change in the applied electric field. The change in the applied electric field is made sufficiently small such that the free energy difference between the initial and final state of the system is comparable to the thermal energy and consequently study the validity of the TFT in this system.
The schematic experimental setup is shown in fig. 1b. The homogeneously aligned liquid crystal cell is placed between crossed polarizers with the director making an angle 45 deg with respect to the polarizer. The intensity of a stabilized He-Ne laser () beam passing through the sample is monitored using a high gain low noise photodiode. The output of the photodiode is digitized using a 16-bit data acquisition board at the rate of 1 kHz. We use a bipolar square wave electric field of frequency 1 kHz to drive the sample from one equilibrium state to another by changing the amplitude of the electric field. Use of AC electric field minimizes the effects of the charge impurities invariably present in the liquid crystals without affecting the director dynamics. The sample is thermostated in a heater with temperature stability of .
The experiments are performed on nematic liquid crystal (5CB) for sample thickness . The experiments are carried out at which is about below the transition temperature () from the isotropic to the nematic phase. For a given temperature, we hold the sample with the amplitude of the applied square wave voltage at a certain value () for 2 seconds, then the amplitude of the applied voltage is changed in a step to a slightly lower value () and held at that value for subsequent 2 seconds. The normalized phase difference , where is the equilibrium value of at the initial voltage , is monitored as it relaxes from it’s initial equilibrium value of zero to the final equilibrium value at voltage . This cycle is repeated for 3000 times to find the probability distributions of the dissipation over an ensemble of experiments. Fig. 2 shows the average relaxation dynamics of averaged over 3000 experiments and the fluctuating dynamics of for one of the experiments when the amplitude of the applied voltage is changed from to .

The average dynamics of is described by a single exponential decay from the initial value to the final value with a characteristic relaxation time . Thus the dynamical evolution of is analogous to the relaxation dynamics of a particle in a harmonic potential in the overdamped regime in the presence of thermal noise described by Langevin equation. The effective strength () of the harmonic potential associated with for a given applied voltage can be determined by measuring the thermal fluctuation of and by the application of the equipartition theorem where is the variance of . For this purpose, we sample in the initial and final equilibrium states of the system for 40 seconds and determine from the measured values of the variance in these states. As is small in our experiments, the measured values of and hence that of in the initial and final state of the system are found to be equal within the experimental error. The measured value of the variance for at .
The evolution of after the step-like change in the applied voltage in this system is analogous to the overdamped Langevin type dynamics of a particle from the initial equilibrium position zero to final equilibrium position , when the harmonic potential felt by the particle is shifted from position zero to , keeping the strength of the potential same. Using the above analogy, the dissipation in time can be written ascarberry04 ; reid04
| (2) |
where and are the values of at time zero and respectively. As expected, the expression for the dissipation is same as the work done in time by a constant force on a particle which is in a harmonic potential of strength kurchan98 ; narayan04 . We calculate the dissipation from Eq. (2) for the 3000 repetitions of the experiment to get the desired histogram of . The histograms of for , and are shown in fig. 3.
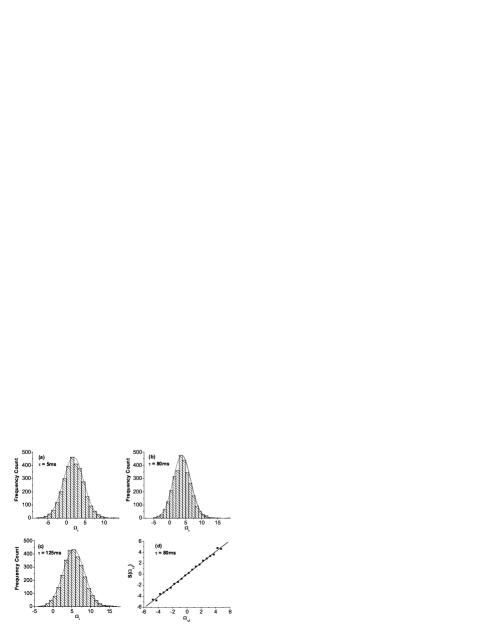
For small, the average dissipation is small. Therefore the probability distribution of is peaked near zero with considerable probability of observing negative dissipation as can be seen from fig. 3a. As increases, the average dissipation increases and the peak of the probability distribution of shifts toward positive values of (fig. 3b, fig. 3c) and the probability of observing negative dissipation decreases. For very large , the dissipation is much larger than and the probability of observing negative dissipation becomes negligible as required by second law of thermodynamics.
To test the validity of the TFT in this system, we evaluate the function from the experimentally measured probability distribution function of . Then according to the TFT, should be a linear function of i.e. with slope for all . We find from the experimentally measured histogram of the probability count () for dissipation between and corresponding to the i-th histogram bin , being the bin size. Then the experimental analog of the function . We find that the experimentally determined can be fitted well by a linear function of for all . In fig. 3d, we show the plot of verses the dissipation for . The straight line in fig. 3d shows the corresponding linear fit to the data with slope agreeing very well with the prediction of TFT. Though the experimental results agree very well with the prediction of TFT for close to , we find that in this system the value of the slope is not equal to one for all but it increases linearly with . Fig. 4 shows the variation of the slope with which can be fitted with a linear equation .
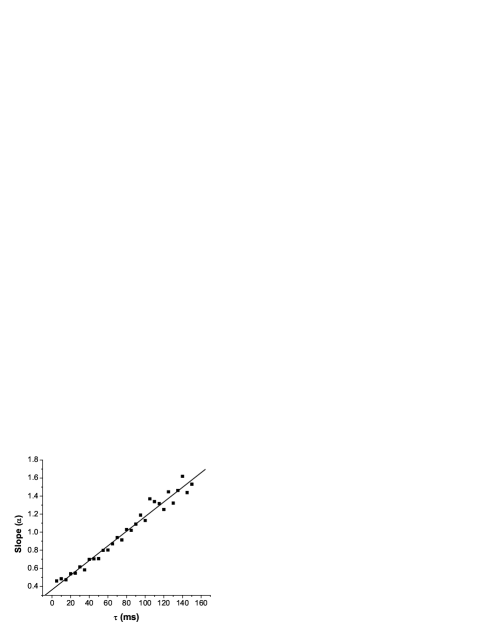
We have repeated the experiments at different temperatures and for different applied voltages and we have observed similar variation of with . The details of these experimental results will be published elsewhere.
In conclusion we have experimentally studied the validity of the TFT in the spatially extended system using liquid crystals. The TFT is studied for the dissipative dynamics of a macroscopic order parameter viz. the orientational order of the liquid crystals when driven from one equilibrium state to another. We construct the appropriate dissipation function for this system and experimentally determine the histograms of the dissipation over an ensemble of experiments. The experimental results are compared with the predictions of the TFT. We find agreement between the experimental observations and the predictions of TFT only for particular values of the observation time . Simulation studies of spatially extended systems may shed further insight on to the validity of TFT in these systems. We thank Dr. Abhishek Dhar for some helpful discussions and comments on the subject.
References
- (1) D. J. Evans, E. G. D. Cohen and G. P. Morriss, Phys. Rev. Lett., 71, 2401 (1993). D. J. Evans and D. J. Searles, Phys. Rev. E, 50, 1645 (1994).
- (2) C. Jarzynski, Phys. Rev. Lett., 78, 2690 (1997).
- (3) F. Retort, Seminaire Poincare, 2, 193 (2003). also available at arXiV:cond-mat/0401311.
- (4) G. Gallavotti and E. G. D. Cohen Phys. Rev. Lett., 74, 2694 (1995).
- (5) J. Kurchan, J. Phys. A, 31, 3719 (1998).
- (6) O. Narayan and A. Dhar J. Phys. A, 37, 63 (2004).
- (7) G. E. Crooks, Phys. Rev. E, 61, 2361 (2000).
- (8) S. R. Williams, D. J. Searles and D. J. Evans, Phys. Rev. E, 70, 066113 (2004).
- (9) U. Seifert, Phys. Rev. Lett., 95, 040602 (2005).
- (10) G. M. Wang, E. M. Sevick, E. Mittag, D. J. Searles, and D. J. Evans, Phys. Rev. Lett., 89, 050601 (2002).
- (11) D. M. Carberry, J. C. Reid, G. M. Wang, E. M. Sevick, D. J. Searles, and D. J. Evans, Phys. Rev. Lett., 92, 140601 (2004).
- (12) S. Schuler, T. Speck, C. Tietz, J. Wrachtrup and U. Seifert, Phys. Rev. Lett., 94, 180602 (2005).
- (13) F. Douarche, S. Joubaud, N. B. Garnier, A. Petrosyan and S. Ciliberto, Phys. Rev. Lett., 97, 140603 (2006).
- (14) J. Liphardt, S. Dumont, S. B. Smith, I. Tinoco Jr, and C. Bustamante, Science, 296, 1832 (2002).
- (15) D. Collin, F. Retort, C. Jarzynski, S. B. smith, I. Tinoco Jr, and C. Bustamante, Nature, 437, 231 (2005).
- (16) P. G. de Gennes and J. Prost, The Physics of Liquid Crystals, 2nd edn. (Clarendon Press, Oxford, 1993).
- (17) J. C. Reid, D. M. Carberry, G. M. Wang, E. M. Sevick, D. J. Evans and D. J. Searles, Phys. Rev. E., 70, 016111 (2004).