Space densities of radio AGN: The CoNFIG sample
Abstract:
The Combined NVSS-FIRST Galaxy (CoNFIG) survey was defined by selecting all sources with 1.3Jy from the NRAO VLA Sky Survey (NVSS) in the north field of the Faint Images of the Radio Sky at Twenty-cm (FIRST) survey. We carried out FRI/FRII morphology classification from NVSS and FIRST survey data; to complete this process, new 8GHz VLA observations for 31 sources were obtained at 0.24 arcsec resolution. Optical identifications and redshift information were compiled for about 80% of the 270 radio sources in the sample, the mean redshift being 0.6.
A major goal of this sample is a better definition of the individual luminosity distributions and source counts for FRI and FRII sources, in order to determine accurately the evolution of the luminosity function for both types. Amongst the aims are the issues of whether the two populations are really distinct, whether physical evolution schemes permit one type to evolve into the other, whether the dual-population unified scheme for radio AGN remains viable, and the role radio AGN - star-formation feedback mechanisms.
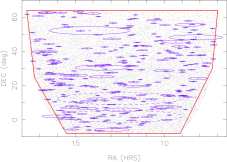
The CoNFIG sample is defined as all sources with
1.3Jy from the NVSS catalogue within the north region of the FIRST
survey (2.95 sr defined roughly by and ; Fig. 1). This selection includes resolved sources in
FIRST and NVSS with components having 1.3Jy but with a total
flux density greater than 1.3Jy.
The FRI/FRII morphology [1] of each source in
the sample was determined by looking
at the FIRST and NVSS radio contour plot. If the contour plot showed
distinct hot spots at the edge of the lobes, and the lobes are
aligned, the source was classified as FRII. Sources with collimated
jets showing hot spots or jets close to the core were classified as
FRI. Most irregular looking sources were also classified as
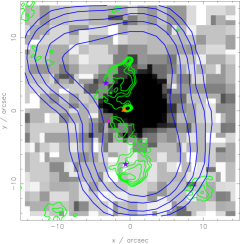
FRI. Complementary VLA radio observation at 8GHz were carried out for
31 extended sources with uncertain morphology; an example is shown in Fig. 2.
In this manner over 60 per cent of sources in
the CoNFIG sample were classified either as FRI or FRII.
Redshift information was retrieved for 220 sources (80% of the
sample). Redshifts range from z=0.0034 to3.522 with a median
redshift of z=0.6. Both FRI and
FRII redshift distributions peak at low redshifts (z 0.5),
although the FRII redshift distribution covers a wider range, up to z=2.
Flux densities at different frequencies (178MHz, 365MHz, 408MHz, 2.7GHz and
5.0GHz) for each source were compiled to compute the
K-correction. The luminosities were then calculated.
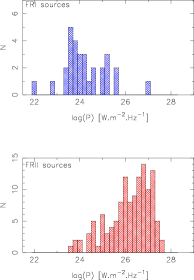
Fig. 3 shows that the luminosity distribution of FRI
sources peaks at lower luminosities than FRIIs. This is no surprise as
FRIs are in general less powerful than FRIIs [1,2]. Compact sources on the
other hand are generally quasars of high luminosity.
In order to compute FRI and FRII source counts, several samples at
different flux limits (7.2 mJy, 50 mJy, 0.2 Jy, 0.8 Jy and 1.3 Jy)
were used. The morphology of the sources in each sample was determined
either by using the FIRST and NVSS contour plots, or, in the case of
the 7.2 mJy sample (the CENSORS sample [3]), by
using the Ledlow-Owen relation [2].
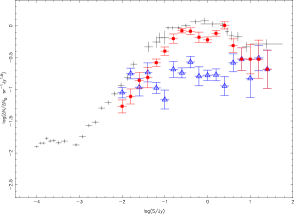
The relative differential source counts for the
total number of FRI and FRII sources
were then computed from the combined samples of 240 FRI and 340 FRII sources.
As seen in Fig. 4, the FRII source count rises and
falls more rapidly than the FRI count, generally following the ‘evolution bulge’. In
contrast the FRI sources show a relatively flat count,
exceeding the numbers of FRII sources only below log-1.
Sadler et al. [4] showed that low-luminosity radio AGNs undergo mild evolution.
This first ever morphological source count agrees: it shows that the FRI sources clearly undergo
evolution, but much milder in form than that of the FRII sources.
References
- [1] Fanaroff, B. & Riley, J., 1974, MNRAS, 167:31
- [2] Ledlow, M. J. & Owen, F. N., 1996, ApJ, 112:9
- [3] Best, P. N. et al., 2003, MNRAS, 346:627
- [4] Sadler et al., 2007, MNRAS, 381:211