Realization of a strongly interacting Bose-Fermi mixture from a two-component Fermi gas
Abstract
We show the emergence of a strongly interacting Bose-Fermi mixture from a two-component Fermi mixture with population imbalance. By analyzing in situ density profiles of 6Li atoms in the BCS-BEC crossover regime we identify a critical interaction strength, beyond which all minority atoms pair up with majority atoms, and form a Bose condensate. This is the regime where the system can be effectively described as a boson-fermion mixture. We determine the dimer-fermion and dimer-dimer scattering lengths and beyond-mean-field contributions. Our study realizes a Gedanken experiment of bosons immersed in a Fermi sea of one of their constituents, revealing the composite nature of the bosons.
pacs:
03.75.Ss, 03.75.Hh, 67.60.FpFermions are the fundamental building blocks of matter, whereas bosons emerge as composite particles. The simplest physical system to study the emergence of bosonic behavior is a two-component fermion mixture, where the composite boson is a dimer of the two different fermions. A dramatic manifestation of bosonic behavior is Bose-Einstein condensation, representing the low-temperature phase of a gas of bosons. One way to reveal the composite nature of the bosons is to immerse such a Bose-Einstein condensate (BEC) into a Fermi sea of one of its constituents. The degeneracy pressure due to the Pauli exclusion principle affects the structure of the composite boson, resulting in a zero-temperature quantum phase transition to a normal state where Bose-Einstein condensation is quenched.
In this paper we observe this transition experimentally. We identify the regimes where a two-component Fermi gas can be described as binary mixture of bosons and fermions, and where the composite nature of the boson becomes essential. The validity of a Bose-Fermi (BF) description requires that all minority fermions become bound as bosons and form a BEC. We determine the critical value of for the onset of superfluid behavior in the limit of large population imbalance. Here is the fermion-fermion scattering length and is the Fermi wave number characterizing the depth of the majority Fermi sea. Of course, for an equal mixture, the zero-temperature ground state is always a superfluid in the BEC-BCS crossover. It has been shown previously that a crossover superfluid can be quenched by population imbalance, also called the Chandrasekhar-Clogston (CC) limit of superfluidity Zwierlein et al. (2006a); Shin et al. (2008). In this work we determine the critical point where superfluidity can no longer be quenched by population imbalance, i.e. the CC limit becomes 100%.
In the limit of a BF mixture Pieri and Strinati (2006), we observe repulsive interactions between the fermion dimers and unpaired fermions. They are parameterized by an effective dimer-fermion scattering length of . This value is consistent with the exact value which has been predicted over 50 years ago for the three fermion problem Skorniakov and Ter-Martirosian (1957), but has never been experimentally confirmed. The boson-boson interactions were found to be stronger than the mean-field prediction in agreement with the Lee-Huang-Yang prediction Lee et al. (1957).
The system for this study is a variable spin mixture of the two lowest hyperfine states and of 6Li atoms (corresponding to the and states at low magnetic field) in an optical dipole trap as described in Refs. Zwierlein et al. (2006a); Shin et al. (2008). A broad Feshbach resonance, located at 834 G Bartenstein et al. (2005), strongly enhances the interactions between the two spin states. The final evaporative cooling was performed at 780 G by lowering the trap depth. Subsequently, the magnetic-bias field is adjusted to a target value with a ramp speed of G/ms, changing the interaction strength adiabatically. At the end of the preparation, our sample was confined in an effective three-dimensional harmonic trap with cylindrical symmetry. The axial (radial) trap frequency was Hz ( Hz).
The phase diagram for the fermion mixture was obtained from the analysis of in situ density profiles of the majority (spin ) and minority (spin ) components. The profiles were recorded using a phase-contrast imaging technique Shin et al. (2008). Under the local density approximation (LDA), low-noise column-density profiles were obtained by averaging the optical signal along equipotenital lines (refer to Ref. Shin et al. (2008) for a full description of the image processing). For typical conditions, the temperature of a sample was , determined from the outer region of the cloud Shin et al. (2008), where K is the Fermi temperature of the majority component measured as ( is the Boltzmann’s constant, is the atom mass, and is the axial radius of the majority cloud).
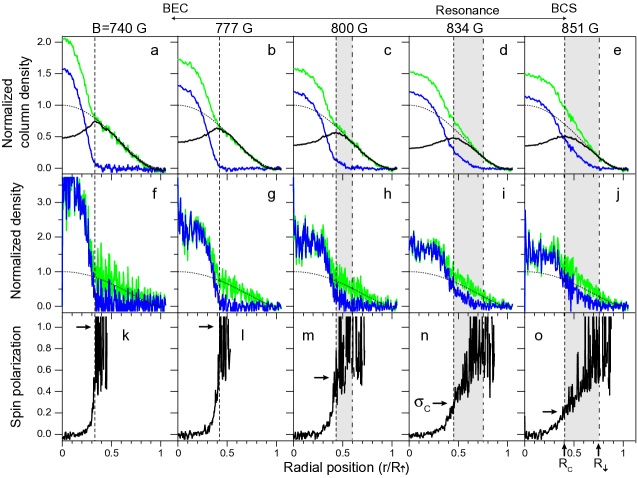
Figure 1 displays density profiles of imbalanced Fermi mixtures for various magnetic fields, showing how the spatial structure of a trapped sample evolves in the crossover regime. Near resonance, as reported in Ref. Shin et al. (2008), three distinctive spatial regions are identified: (I) a superfluid core, (II) an intermediate region of a paritially-polarized normal () phase, and (III) a fully-polarized, outer wing. The core radius was determined as the peak position in the column density difference profile and the majority (minority) radius was determined from the fit of the outer region, of the majority (minority) column density profile to a zero-temperature Thomas-Fermi distribution. The local spin polarization is defined as , where and are the local majority and minority density, respectively.
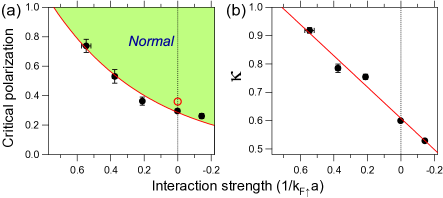
Further on the BEC side, the sample has a more compressed superfluid core, a narrower intermediate normal region (gray region in Fig. 1) and a higher critical spin polarization at the phase boundary . Eventually, when G, there is no noticeable intermediate region, implying that every minority atom pairs up with a majority atom in the superfluid core. In Fig. 2 we determine the critical point for the disappearance of the partially polarized normal phase in two different ways. Fig. 2(a) shows the phase diagram for the phase in the plane of interaction strength and spin polarization . An extrapolation of the critical line to yields . Another implication of the absence of an phase is that the size of the minority cloud approaches the radius of the superfluid core. This extrapolation is conveniently done using the dimensionless parameter note1 , resulting in a value of . These values are in good agreement with recent quantum Monte-Carlo (QMC) calculations Pilati and Giorgini (2008).
The critical point marks the onset of the emergence of a BF mixture from the two-component Fermi system. One may suspect that near the critical point the equation of state of the BF mixture is complex, but we show now that a very simple equation of state is sufficient to quantitatively account for the observed profiles. Due to the external trap potential, the local chemical potential varies form zero at the edge of a cloud to a maximum value in the center. Therefore, knowledge of the three-dimensional density profiles of a single cloud is sufficient to obtain the equation of state Mlmer (1998); Pieri and Strinati (2006); Shin et al. (2008); Shin (2008); Chevy (2006).
For a zero temperature mixture of bosonic dimers with density and mass and unpaired fermions with density and mass , the energy density can be decomposed as , where and are the boson-boson and boson-fermion interaction energies, respectively, and is the kinetic energy of fermions [ and is the Planck’s constant]. Here we assume that the effective mass of a fermion in a dilute mixture is same as its bare mass Bardeen et al. (1967). Under the LDA, the densities and in the harmonic trap should satisfy
| (1) | |||||
| (2) |
where and are the global chemical potentials of fermions and bosons, respectively, referenced to the trap bottom.
For the determination of the boson-fermion scattering length , we use a mean-field expression for the boson-fermion interaction energy with =(2/3). Since , Eq. (1) gives the relation, . We obtained a value for by averaging over a mixed region ( with ). Here, is the reference density defined as . In this analysis, the non-interacting outer wing provides absolute density calibration Shin (2008).
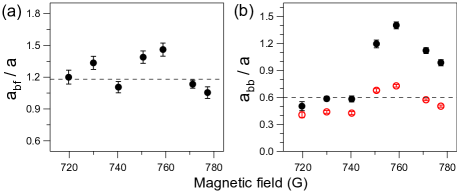
The scattering length ratio turns out to be almost constant over the whole range, 700 G780 G where we could study BF mixtures [Fig. 3(a)]. For even lower magnetic fields, severe heating occured, probably due to molecular relaxation processes. By averaging a total of 89 measurements, we obtain , close to the exact value calculated for the three-fermion problem Skorniakov and Ter-Martirosian (1957). Our finding excludes the mean-field prediction . The detailed behavior above 750 G requires further investigation.
We now turn to the determination of the boson-boson scattering length which parameterizes the boson-boson mean-field energy . For a given , the effective potential for bosons in the presence of fermions is . Then, Eq. (2) gives . By fitting the data in the core region ( and ) to this equation with and as two free parameters, we obtained a value for . We used the value determined from the corresponding profiles.
The effective mean-field values for show a strong increase by a factor of about 2, as the system approaches the critical point [Fig. 3(b)]. We attribute this behavior to strong boson-boson interactions causing non-negligible quantum depletion in the BEC. In this regime, the equation of state has to include beyond-mean-field corrections, with the leading term given by Lee, Huang, and Yang (LHY) Lee et al. (1957) as
| (3) |
Inclusion of the LHY correction leads to smaller fitted values for , which are now almost constant over the whole range of magnetic fields with an average value of . The exact value for weakly bound dimers is Petrov et al. (2004). For , the LHY correction is , i.e. a 30 % correction to the mean field approximation. Here, . Recently, the LHY corrections have been observed via the upshift of collective oscillation frequencies for a strongly interacting BEC Altmeyer et al. (2007).
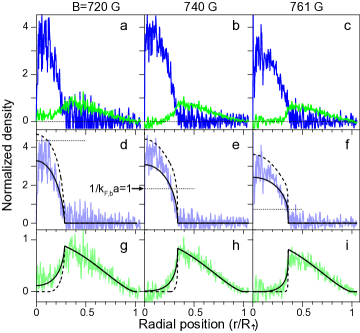
Our results show that a two-component Fermi mixture beyond the critical point can be effectively described as a strongly interacting BF mixture. In Fig. 4, we compare our experimental data with numerically obtained density profiles note2 without any adjustable parameter, showing excellent agreement. After including the LHY correction, small discrepancies are visible only at the highest boson densities exceeding , where one would expect unitarity corrections. It is surprising that we didn’t need any beyond-mean-field corrections for the boson-fermion interaction. Such corrections have been calculated for a system of point bosons and fermions Saam (1969). However, including them into our fit function degraded the quality of the fit. Recent QMC simulations have shown that the equation of state of a polarized Fermi gas on the BEC side is remarkably close to with and down to Pilati and Giorgini (2008); Prokof’ev and Svistunov (2008) in agreement with our findings. It appears that the beyond-mean-field term is offset by other corrections, possibly due to the composite nature of the bosons. Further studies of this rich system could address beyond-mean-field terms, characterize the break-down of the BF description close to the critical point, and look for finite temperature effects.
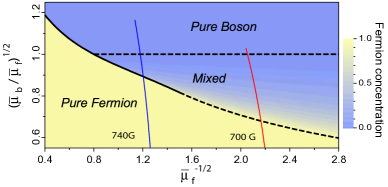
One motivation for the realization of BF mixtures is to extend studies of 3He-4He mixtures. With tunable interactions near Feshbach resonances, cold atom systems can access a wider regime of the phase diagram. Predicted phenomena include phase separation and miscibility Mlmer (1998); Viverit et al. (2000), boson-mediated, effective fermion-fermion coupling Bardeen et al. (1967); Bijlsma et al. (2000) and novel collective excitations Yip (2001); Santamore et al. (2004). The density profiles in Fig. 4 show a sharper boundary for higher magnetic fields. This is consistent with Fig. 5 which predicts that in the same magnetic field range, the transition from full miscibility to phase separation has taken place.
An interacting BF system has been also realized in 87Rb-40K mixtures Ospelkaus et al. (2006); Zaccanti et al. (2006). The 6Li system studied here has the advantages of using a single atomic species and much longer lifetimes of several seconds, but cannot access attractive boson-fermion interactions.
In conclusion, a two-component Fermi gas with population imbalance is a realization of a long-lived strongly interacting BF mixture. This is a new BF system with tunable interactions. Furthermore, it offers intriguing possibilities to study the emergence of bosonic behavior from a mixture of fermions.
We thank A. Keshet for a critical reading of the manuscript. This work was supported by NSF, ONR, MURI and ARO Award W911NF-07-1-0493 (DARPA OLE Program).
References
- Zwierlein et al. (2006a) M. W. Zwierlein et al., Science 311, 492 (2006a);. M. W. Zwierlein et al., Nature 442, 54 (2006b); Y. Shin et al., Phys. Rev. Lett. 97, 030401 (2006).
- Shin et al. (2008) Y. Shin et al., Nature 451, 689 (2008).
- Pieri and Strinati (2006) P. Pieri and G. C. Strinati, Phys. Rev. Lett. 96, 150404 (2006); E. Taylor, A. Griffin, and Y. Ohashi, Phys. Rev. A 76, 023614 (2007); M. Iskin and C. A. R. Sá de Melo, ibid. 77, 013625 (2008).
- Skorniakov and Ter-Martirosian (1957) G. V. Skorniakov and K. A. Ter-Martirosian, Sov. Phys. JETP 4, 648 (1957).
- Lee et al. (1957) T. D. Lee, K. Huang, and C. N. Yang, Phys. Rev. 106, 1135 (1957).
- Bartenstein et al. (2005) M. Bartenstein et al., Phys. Rev. Lett. 94, 103201 (2005).
- (7) is almost independent of the total population imbalance near the resonance Chevy (2006); Shin (2008).
- Pilati and Giorgini (2008) S. Pilati and S. Giorgini, Phys. Rev. Lett. 100, 030401 (2008).
- Mlmer (1998) K. Mlmer, Phys. Rev. Lett. 80, 1804 (1998).
- Chevy (2006) F. Chevy, Phys. Rev. A 74, 063628 (2006).
- Shin (2008) Y. Shin, Phys. Rev. A 77, 041603(R) (2008).
- Bardeen et al. (1967) J. Bardeen, G. Baym, and D. Pines, Phys. Rev. 156, 207 (1967).
- Petrov et al. (2004) D. S. Petrov, C. Salomon, and G. V. Shlyapnikov, Phys. Rev. Lett. 93, 090404 (2004).
- Altmeyer et al. (2007) A. Altmeyer et al., Phys. Rev. Lett. 98, 040401 (2007).
- (15) For a given , the density profiles were numerically obtained to be self-consistent with Eqs. (1) and (2).
- Saam (1969) W. F. Saam, Ann. Phys. 53, 239 (1969); A. P. Albus et al., Phys. Rev. A 65, 053607 (2002); L. Viverit and S. Giorgini, ibid. 66, 063604 (2002).
- Prokof’ev and Svistunov (2008) N. Prokof’ev and B. Svistunov, Phys. Rev. B 77, 020408(R) (2008).
- Viverit et al. (2000) L. Viverit, C. J. Pethick, and H. Smith, Phys. Rev. A 61, 053605 (2000).
- Bijlsma et al. (2000) M. J. Bijlsma, B. A. Heringa, and H. T. C. Stoof, Phys. Rev. A 61, 053601 (2000).
- Yip (2001) S. K. Yip, Phys. Rev. A 64, 023609 (2001).
- Santamore et al. (2004) D. H. Santamore, S. Gaudio, and E. Timmermans, Phys. Rev. Lett. 93, 250402 (2004).
- Ospelkaus et al. (2006) S. Ospelkaus et al., Phys. Rev. Lett. 97, 120403 (2006).
- Zaccanti et al. (2006) M. Zaccanti et al., Phys. Rev. A 74, 041605(R) (2006).