Controlled vaporization of the superconducting condensate in cuprate superconductors sheds light on the pairing boson.
Abstract
We use ultrashort intense laser pulses to study superconducting state vaporization dynamics in La2-xSrxCuO4 ( and 0.15) on the femtosecond timescale. We find that the energy density required to vaporize the superconducting state is K/Cu and K/Cu for and 0.15 respectively. This is significantly greater than the condensation energy density, indicating that the quasiparticles share a large amount of energy with the boson glue bath on this timescale. Considering in detail both spin and lattice energy relaxation pathways which take place on the relevant timescale of s, we rule out purely spin-mediated pair-breaking in favor of phonon-mediated mechanisms, effectively ruling out spin-mediated pairing in cuprates as a consequence.
The study of nonequilibrium phenomena in superconductors has been an important topic of condensed matter physics since the 1960’s and the fact that intense laser pulses can non-thermally destroy the superconducting state has been known for a long time Testardi . After the discovery of high-temperature superconductivity in cuprates and the simultaneous rapid development of ultrashort pulsed lasers, real-time studies of quasiparticle (QP) dynamics became possible using pump-probe experiments Han ; Chwalek ; Albrecht ; Stevens . Recent developments in phenomenological modeling and new systematic experimental studies of the non-equilibrium optical response RT ; MgB2 ; nasiRT ; NasiPRB1999 have enormously improved our understanding of the dynamics of photoexcited QPs on short timescales, and the response of the superconducting state to weak pulsed laser excitation in cuprates can now be unambiguosly identified on the femtosecond timescale MgB2 ; nasiRT ; NasiPRB1999 ; nasLSCO ; Gedik ; CaYBCO ; YBCO124 ; kaindl ; Schneider ; Bianchi . Rothwarf and Taylor originally proposed their phenomenological model for QP recombination in the framework of phonon-mediated pairingRT ; nasiRT , but spin-fluctuation mediated recombination (which is relevant for the cuprates) is not excluded by their model. Both high-energy phonons and spin excitations could in principle mediate QP recombination, and the non-equilibrium studies so far did not directly reveal the pairing boson.
In this work we specifically address the question of the mediating boson by carefully measuring and analyzing the energy and time needed to destroy (vaporize) the superconducting condensate in La2-xSrxCuO4 with and 0.15. We compare the measured vaporization energy with the thermodynamically measured condensation energy, and find that a substantial amount of energy is temporarily stored by the glue boson bath during the vaporization process. Since spin and lattice subsystems have vastly different heat capacities, this places significant constraints on the type of bosonic bath which can mediate pairing. By carefully considering the energy relaxation pathways associated with pair-breaking dynamics we are able to conclude which bosonic excitations are involved in the destruction of the condensate, shedding light on the pairing boson responsible for superconductivity in these materials.
Outlining the sequence of events in our experiments microscopically, the laser pump pulses first excite electrons from occupied to unoccupied states within 1.5 eV of the Fermi level. Immediately afterwards, in an avalanche QP multiplication process which is well-studied in metals, as well as cuprates, the photoexcited carriers relax to states near the Fermi energy via band electron-electron scattering, occuring on a typical timescale fs Perfetti , and scattering with phonons - preferentially interacting with those phonons which are most strongly coupled to the QPs Allen - resulting in significant non-equilibrium QP and phonon populations within 100 fs of photoexcitation. The next relaxation step, QP recombination across a superconducting energy gap (or pseudogap) with the emission of a boson with energy , takes significantly longer, and is typically described very well by the Rothwarf and Taylor model RT ; nasiRT ; NasiPRB1999 . The model does not directly identify the pairing boson, but two crucial parameters in the model do depend on the electron-boson interaction, namely the characteristic bare pair-breaking rate and recombination rate which define the pair-breaking and QP recombination timescales respectively. RT ; MgB2 ; nasiRT Importantly, and can be determined from the vaporization time .MgB2
The important feature of pump-probe experiments is that the transient density of the photoexcited (PE) QPs accumulated at the gap edge is probed in real time by a time-delayed excited state absorption processYBCO124 . The transient change in reflectivity of the probe pulse (which for small is linearly proportional to the transient photoinduced absorption comment ) is thus directly proportional to . This makes it possible to detect when the superconducting condensate is destroyed. NasiPRB1999 ; YBCO124
In the experiments described here, we perturbed the superconducting condensate in La2-xSrxCuO4 with 50 femtosecond laser pulses. The experiments were performed on freshly cleaved surfaces of high quality La2-xSrxCuO4 ( and ) single crystals with K and K respectively Sugai . The laser pulses were linearly polarized and incident along the axis of the crystal with a wavelength of nm (1.5 eV). We used a Ti:Sapphire oscillator and a 250 kHz amplifier to cover the range of excitation fluences from J/cm2 to J/cm2. The pump and probe beam diameters were measured accurately with a pinhole and the absorbed energy density was accurately determinedSupp . The low laser repetition rate of our laser ensured that there was no heat buildup between pulses even with the highest fluences used, and the temperature increase due to the laser was found to be less than 2 K (which can also be seen from a comparison of the measured optically with the from susceptibility measurements).
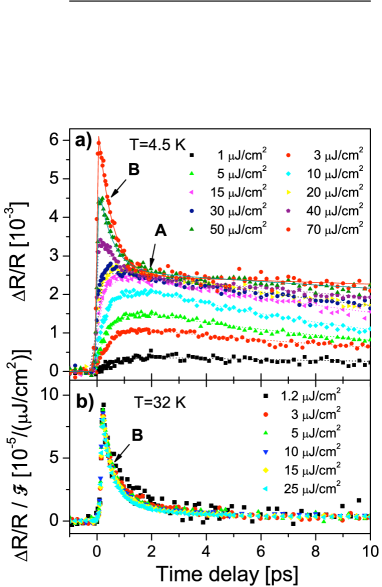
The photoinduced reflectivity change as a function of time delay for different is shown below ( K) in Fig. 1a) and above ( K) in Fig. 1b) for (the data for is qualitatively the same). Below (Fig. 1a)) we identify two relaxation processes with very different dynamics, which we label as A and B. Signal B is present from low to well above (Fig. 1b), and disappears gradually above the so called pseudogap temperature . In agreement with many previous low- experiments NasiPRB1999 ; nasLSCO ; CaYBCO ; YBCO124 , it is assigned to the carriers recombining across the pseudogap. Signal A is visible strictly only below and is - in accordance with previous works nasLSCO ; Bianchi - assigned to QP recombination across the superconducting gap , and has a relaxation time typically 10ps at 4.5K nasLSCO . The rise-time ps of the superconducting signal is the time required for the QP population to build up MgB2 ; nasiRT by pair-breaking from the condensate.
Examining Figure 1 in more detail, we see that at low and signal A is dominant. As fluence is increased, the amplitude of signal A first increases with and then starts to saturate for above J/cm2. As signal A starts to saturate, signal B starts to become more visible, and above the saturation threshold of signal A, a linear increase of the amplitude of signal B with increasing becomes clearly apparent.
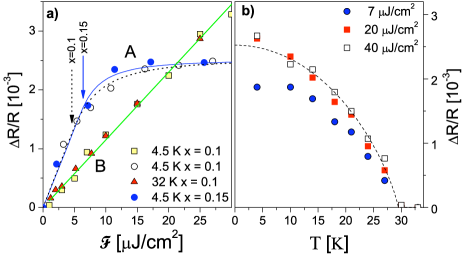
The maximum amplitudes of and are shown in Fig. 2a) for and 0.15 as a function of . We see that is linear at low fluence for J/cm2. Above J/cm2, the signal amplitude departs from linearity, indicating an onset of saturation associated with vaporization of the condensate. soon saturates and becomes constant for J/cm2 (up to the highest fluences measured). In contrast, is linear with both below and above .
To accurately determine the vaporization threshold, we carefully take into account the optical penetration depth for the pump and the probe beams and their spatial profile Supp . From fits of the measured dependence of on to the function provided by a straightforward model calculation (shown in Fig. 2a)), Supp we obtain values for the threshold vaporization fluence at 4.5 K: for and for .
In Fig. 2b) we plot the - dependence of for several excitation levels for the sample. As expected, for , the -dependence of does not depend on , since full vaporization is achieved at all . Near the threshold, for J/cm2, only partial vaporization is evident and the amplitude merges with the high fluence data only as . We can understand the T-dependence of the by considering the difference in reflectivity between the superconducting state and the normal state. The induced change in reflectivity for fluences the vaporization threshold is proportional to , where and are real parts of the complex conductivity in the normal and superconducting states, respectively. Using the Mattis-Bardeen formulae MattisBardeen it follows that Supp :
| (1) |
where is the photon energy and the -dependent gap. Using ( is gap at 0 K), which was previously found to describe in cuprate superconductors Bozovic , a very good agreement between Eq.(20) and the data for is obtained (see Figure 2 b).
Let us now examine the energy relaxation pathways on the pair-breaking timescale of ps. Phonons released during this time need at least ps to escape from the excited volume, being the velocity of sound. The characteristic QP diffusion time from the excitation volume is also of the order of 100 ps, calculated using the measured QP diffusion constant for very clean samples of YBa2Cu3O6.5 at 4 K Orenstein . Therefore we can conclude that the absorbed optical pulse energy cannot diffuse or escape, and remains in the excitation volume on the timescale of 1 picosecond.
Next, let us analyze the microscopic energy relaxation processes within the excitation volume in more detail. The energy densities in the excitation volume at vaporization threshold for and shown in Fig.2 a) are K/Cu and K/Cu respectively (using nm at 810 nm OpticalProp )). Both are significantly higher than the thermodynamically measured condensation energies extracted from specific heat data, which are K/Cu for , and K/Cu for Matsuzaki . The ratio of the two energies are thus and respectively. This means that a significant amount of energy is not directly used in the vaporization process, but is stored elsewhere on the timescale of .
There are excitations of the system, such as phonons of different symmetry, but also potentially spin fluctuations, etc., that make up the difference between the condensation energy and the measured optical vaporization energy. Let us consider spin excitations first. The energy required to heat the entire spin bath from 4.5 K to for is given by , where is the magnetic specific heat. Using the published valueCM of for undoped La2CuO4 ( in doped La1.9Sr0.1CuO4 can only be smaller), we obtain mJ/mol (0.01 K/Cu). Clearly, the magnetic system alone is not capable of absorbing ( K/Cu, its heat capacity being too small by a factor of . Making the same estimate for the lattice excitations, we obtain J/mol (9 K/Cu) for ( K) and 240 J/mol (28 K/Cu) for ( K), where is the experimentally measured specific heatMatsuzaki . The phonon subsystem can thus easily absorb the excess supplied energy, with for (and 11.6 for ).
This observed discrepancy between measured and thermodynamically measured condensation energy, as well as the - and -dependence of the superconducting state depletion process can be naturally explained within the Rothwarf-Taylor (RT) model in the bottleneck regime, where the pairing bosons are reaching quasi-equilibrium with the QPs nasiRT on the 1 ps timescale and share some of the energy supplied by the optical pulses.
In the RT model, the pair-breaking time (which corresponds to the condensate vaporization time when ) is given by where the initial QP and boson densities are and respectively nasiRT ; MgB2 . For weak photoexcitation, when both , , where the threshold density is defined as , is independent of , and . For intense photoexcitation, when either , , depends on . A strong -dependence of is observed in our data, which implies that LSCO is in the ”weak” perturbation regime over our range of , and so . To estimate , we take cm measured by Gedik et al. in YBCO Gedik and obtain a threshold density cm/Cu. We can make an alternative microscopic estimate of using the formula for the bare recombination rate from ref. Hg (with phonons as the mediating bosons) , where is the density of states at the Fermi level, is the superconducting gap, is the characteristic phonon frequency and the electron-phonon coupling constant (which is the same as appears in the McMillan formula for Hg ). Taking typical values for LSCO , , and the measured chekalin , we obtain cm3s-1 which gives a very similar threshold density as the phenomenological estimate /Cu. Note that both are just slightly lower than the estimated photoexcited QP density at threshold fluence which is /Cu. We can conclude that the RT model involving phonons in the pair-breaking process gives a self-consistent quantitative description of the vaporization dynamics.
Let us now see whether the relaxation processes on the sub- 1 ps timescale might somehow involve spin excitations. In this scenario, energy might be initally transferred from PE carriers to the spin subsystem on a timescale much shorter than 1 ps and QPs would then be excited from the condensate by absorbing energy from the hot bath of spin excitations. For energy relaxation only real (not virtual Sugai ) processes are relevant and the relevant interaction between QPs and spin excitations is spin-orbit coupling. Such a scenario is consistent with our data, provided that the spin-orbit relaxation time is equal to, or shorter than the observed vaporization time of ps. To estimate the vaporization time for this case, we use the fact that spin-lattice relaxation is a process in which electron-phonon relaxation follows spin-orbit relaxation, and . So, for spin excitations to be involved in the pair breaking and QP relaxation process, needs to be of the order of 1 ps or less. Electron-paramagnetic resonance (EPR) measurements of Cu spin relaxation in La1.9Sr0.1CuO4, give EPR linewidths ranging from kilogauss at 30 K to kilogauss at 8 K. This corresponds to a lower limit of the relaxation time ps Kochelaev2 , which is much longer than observed. Assuming that the measured is correct, the pair-breaking thus cannot proceed via the spin excitations, because the relaxation process at 4.5 K would take over ps, instead of ps. Thus spin excitations cannot be responsible for the destruction of the superconducting condensate by any currently known spin-orbit relaxation mechanism. This conclusion has important implications for the pairing mechanism in these compounds. The pair-breaking process discussed above is related to QP recombination (pairing) by time-reversal symmetry, and therefore both processes must involve the same mediating boson, i.e. phonons. We conclude that only phonon-mediated vaporization is consistent with the observed dynamics, effectively ruling out spin-mediated QP recombination and pairing in these materials.
We wish to acknowledge valuable discussions and important comments from K. Alex Muller, N. Ashcroft, P. B. Allen, A. S. Alexandrov, D. Van der Marel, E. Maksimov, I. Bozovic and D. Newns.
I Supplementary material
I.1 Calculation of the behavior of the photoinduced reflectance as a function of fluence for a superconductor in the high density regime
To accurately identify the point where the superconducting condensate is vaporized, we need to account for geometrical aspects due to the finite absorbtion length of pump and probe light as well as the transverse beam profiles.
In the probe beam, the sample penetration depth has to be accounted for twice (upon entering and exiting the sample). The relative photoinduced change in reflectivity is then given by:
| (2) |
where is optical penetration depth, and is probe beam diameter on the sample. We take the change of reflectivity to be linear with the density of photoexcited quasiparticles , and to be approximately linear with excitation density up to the threshold excitation fluence where the superconducting condensate is evaporated. For all quasiparticles are excited and saturates at
| (3) |
The light fluence penetrating into the sample is where represents the laser fluence on the surface of the sample. The laser fluence within sample is:
| (4) |
Assuming that in the normal state does not depend on due to other processes, we calculate the integral in two parts: for and separately over the volume where . With pump beam radius and the complete integral is:
| (5) |
where is Heaviside step function. The behavior of this integral depends on the ratio . To get a dimensionless result we normalize the result with its saturated value:
| (6) |
For the dependence is linear in :
| (7) |
while for :
| (8) |
with and . As can be seen from eq. 7 one can determine the saturated value of excitation fluence simply by reading the value at which reaches of the maximum (saturation) value of .
To determine in our measurements we used a pinhole of diameter and measured the power of the beam in front of the pinhole () and after the pinhole (). With known repetition rate of the pulses () we can calculate and diameter of the beam :
| (9) |
and
| (10) |
To obtain the we accounted for the light reflected from the cryostat window (8%) and the part reflected from the sample ().
The excitation energy density calculated from the absorbed energy fluence is:
| (11) |
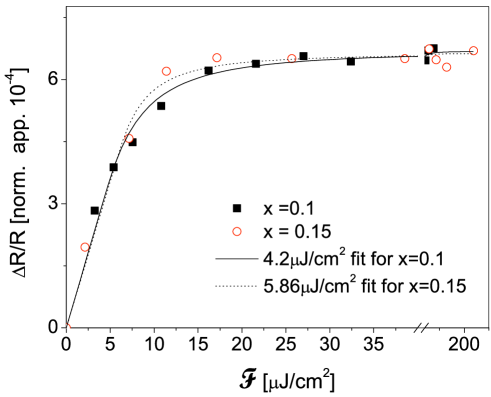
In our experiment we used the following parameters. The pump/probe beams radii were (42/28 ()m) and (71/18 () m) for the samples and 0.15 respectively. was determined with the relative accuracy of 0.3. Penetration depths were calculated from the optical conductivity and the dielectric function data OpticalProp and were found to be 147 nm for and 156 nm for . The reflectivity is 0.135 for and 0.130 for OpticalProp .
The saturated fluences obtained by fitting the eqs. 6 and 7 to the data (see Fig. 3) are 4.2Jcm-2 and Jcm-2 for underdoped (x=0.1) and optimally doped (x=0.15) samples respectively. This is equivalent to the absorbed energy of 1.950.78K per Cu atom for x=0.1 and 2.561.0K for x=0.15.
I.2 The temperature dependence of the photoinduced change in reflectivity in the limit of condensate vaporization.
In the following we describe the derivation of the expected temperature dependence of the photoinduced change in reflectivity at optical frequencies in the limit of excitation intensities higher than the condensate vaporization treshold.
Figure 2a) of the main text shows the time-variation of the photoinduced reflectivity trace recorded at 4.5 K on La1.9Sr0.1CuO4 (=30K) as a function of the photoexcitation fluence ranging from 1 to 200 Jcm2. Component A, which describes the dynamics of the superconducting state pair-breaking and recovery, exhibits clear saturation at high excitation intensities. Analysis of the -dependence of the signal amplitude at ps with the model described in the previous section gives the treshold fluence 4.2Jcm2 for x=0.1 and 5.9Jcm2 for x=0.15. It follows from these data that at the superconducting state is vaporized on the timescale of ps after excitation with 50 fs optical pulses.
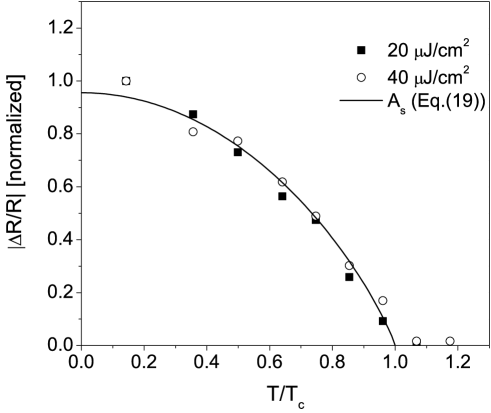
The temperature dependence of the induced change in reflectivity at is markedly different than the temperature dependence obtained in the low excitation regime, which is not surprising. Indeed, the amplitude of the induced change in reflectivity in the regime of condensate vaporization, As, is given by
| (12) |
where and are the reflectivities in the normal and in the superconducting states, respectivey, and . At optical frequencies, the induced change in reflectivity is proportional to the induced change in the imaginary component of the refraction index and therefore proportional to the induced change in the real part of the optical conductivity giving
| (13) |
To determine the temperature dependence of we evaluate where is given by the Mattis-Bardeen relationMattisBardeen
| (14) |
Here is the Fermi-Dirac distribution function, is the photon energy, is the superconducting gap, and is
| (15) |
In the limit of Eq.(14) can be rewritten as
| (16) |
The first term on the right hand side of Eq.(16) can be evaluated exactly and is given byMattisBardeen
| (17) |
where and are the complete elliptic integrals. In the limit of photon energies being much higher than the gap, , it then follows that
| (18) |
The second term on the right hand side of Eq.(16) can also be calculated exactly in the limit of and is found to be
| (19) |
Clearly, presents only a small correction which becomes noticable only in the close vicinity to Tc. Therefore, is in the limit when given by
| (20) |
Due to the fact that the data on the temperature dependence of the gap are fairly scarce, has been commonly assumed to follow the mean-field (BCS-like) temperature dependence. Comparison of , where a BCS T-dependence of is assumed, to the experimentally measured shows, however, that has a substantially weaker T-dependence than BCS functional form. In fact, from the available data on the temperature dependence of in cuprate superconductors, which is obtained from the temperature dependence of the SIS tunneling junction caracteristicsBozovic , as well as from the intrinsic tunneling dataKrasnov it follows that the gap follows temperature dependence over a wide temperature range. Indeed, using this functional form with eV, and , a nearly perfect agreement between and the experimentally measured is found (Figure 2).We should note however, that unlike in the low excitation regime, where by fitting the temperature dependence of the amplitude of the photoinduced change in reflectivity the magnitude of the superconducting gap can be extracted, this is not the case in the high excitation regime.
References
- (1) L.R. Testardi, Phys. Rev. B 4, 2189 (1971).
- (2) S.G. Han, Z.V. Vardeny, K.S. Wong, O.G. Symko, and G. Koren, Phys. Rev. Lett. 65, 2708 (1990).
- (3) J.M. Chwalek, C. Uher, J.F. Whitaker, G.A. Mourou, and J.A. Agostinelli, Appl. Phys. Lett., 58, 980 (1991).
- (4) W. Albrecht, Th. Kruse, and H. Kurz, Phys. Rev. Lett. 69, 1451 (1992).
- (5) C.J. Stevens, et al., Phys. Rev. Lett. 78, 2212 (1997).
- (6) A. Rothwarf and B.N. Taylor, Phys. Rev. Lett. 19, 27 (1967).
- (7) J. Demsar, et al., Phys. Rev. Lett. 91, 267002 (2003); J. Demsar, et al., Int. J. Mod. Phys. B 17, 3675 (2003).
- (8) V.V. Kabanov, J. Demsar, D. Mihailovic, Phys. Rev. Lett. 95, 147002 (2005).
- (9) V.V. Kabanov, J. Demsar, B. Podobnik, D. Mihailovic, Phys. Rev. B 59, 1497 (1999).
- (10) N. Gedik, et al., Phys. Rev. B 70, 014504 (2004), G. P. Segre, et al., Phys. Rev. Lett. 88, 137001 (2002). R.A. Kaindl, et al., Phys. Rev. B 72, 060510 (2005).
- (11) P. Kusar, J. Demsar, D. Mihailovic, S. Sugai, Phys. Rev. B 72, 014544 (2005).
- (12) J. Demsar, B. Podobnik, V.V. Kabanov, Th. Wolf, D. Mihailovic, Phys. Rev. Lett. 82, 4918 (1999).
- (13) D. Dvorsek, et al., Phys. Rev. B, 66, 020510 (2002).
- (14) R.A. Kaindl, et al., Science 287, 470 (2000).
- (15) M.L. Schneider, et al. Eurphys. Lett. 60, 460 (2002), ibid. Phys.Rev. B 70, 012504 (2004).
- (16) G. Bianchi, C. Chen, M. Nohara, H. Takagi, J.F. Ryan, Phys. Rev. B 72, 094516 (2005).
- (17) L. Perfetti, et al., Phys. Rev. Lett., 99, 197001 (2007).
- (18) P.B. Allen, Phys. Rev. Lett. 59 1460 (1987).
- (19) For larger fluences, we can expect deviations from linearity due to photoinduced changes of the electronic band structure.
- (20) S. Sugai, H. Suzuki, Y. Takayanagi, T. Hosokawa, N. Hayamizu, Phys. Rev. B 68, 184504 (2003).
- (21) See Supplementary material.
- (22) D.C. Mattis, J. Bardeen, Phys. Rev.111, 412 (1958).
- (23) I. Bozovic, J.N. Eckstein, Appl. Surf. Sci. 113/114, 189 (1997), V.M. Krasnov, A. Yurgens, D. Winkler, P. Delsing, T. Claeson, Phys. Rev. Lett. 84, 5860 (2000).
- (24) N. Gedik, J. Orenstein, R. Liang, D.A. Bonn, W.N. Hardy, Science 300, 1410 (2003).
- (25) T. Matsuzaki, N. Momono, M. Oda, M. Ido, J. Phys. Soc. Jpn., 73, 2232 (2004).
- (26) M.R. Singh, S.B. Barrie, Phys. stat. sol. (b) 205, 611 (1998).
- (27) Yu.N. Ovchinnikov and V..Z.Kresin, Phys.Rev.B 58 12416 (1998), or J. Demsar, et al., Phys.Rev.B 63, 054519 (2001).
- (28) S.V.Chekalin, et al., Phys.Rev. Lett. 67 3860 (1991).
- (29) B.I. Kochelaev, J. Sichelschmidt, B. Elschner, W. Lemor, A. Loidl, Phys. Rev. Lett. 79, 4274 (1997); B.I. Kochelaev, G.B. Tetelbaum, Superconductivity in Complex Systems, Ed. K.A.Muller and A.Bussmann-Holder, Structure and Bonding 114, Springer (2005), p230., A. Shengelaya, H. Keller, K.A. Muller, B.I. Kochelaev, K. Conder, Phys.Rev. B 63, 144513 (2001).
- (30) Uchida S, Ido T, Takagi H, Arima T, Tokura Y & Tajima S, Phys. Rev. B 43, 7942(1991).
- (31) D.C. Mattis and J. Bardeen, Phys. Rev. 111, 412 (1958).
- (32) I. Bozovic and J.N. Eckstein, Appl. Surf. Sci. 113/114, 189 (1997).
- (33) V.M. Krasnov et al., Phys. Rev. Lett. 84, 5860 (2000).