Abstract
Context. IGR J164794514 is a fast X-ray transient known to display flares lasting typically a few hours. Recently, its counterpart has been identified with a supergiant star, therefore the source can be classified as member of the newly discovered class of Supergiant Fast X-ray Transients (SFXTs), specifically it is the one with the highest duty cycle.
Aims. To characterize the quiescent X-ray behaviour of the source and to compare its broad band spectrum to that during fast X-ray flares.
Methods. We performed an analysis of IBIS and JEM-X data with OSA 5.1 as well as an analysis of archival Swift/XRT data.
Results. We present results from a long term monitoring of IGR J16479–4514 with detailed spectral and timing informations on 19 bright fast X-ray flares, 10 of which newly discovered. We also report for the first time results on the quiescent X-ray emission; the typical luminosity value (1034 erg s-1) is about 2 orders of magnitude greater than that typical of SFXTs while its broad band X-ray spectrum has a shape very similar to that during fast X-ray transient activity, i.e. a rather steep power law with 2.6.
Conclusions. IGR J164794514 is characterized by a quiescent X-ray luminosity higher than that typical of other known SFXTs but lower than persistent emission from classical SGXBs. We suggest that such source is a kind of transition object between these two systems, supporting the idea that there is a continuum of behaviours between the class of SFXTs and that of classical persistent SGXBs.
Key Words.:
1 Introduction
Since its launch in 2002, the INTEGRAL satellite (Winkler et al. 2003) has played a key role in discovering many new High Mass X-ray Binaries (HMXBs) thanks to its large field of view (FOV), continous monitoring of the galactic plane and good sensitivity. The majority of these systems turned out to be persistent Supergiant High Mass X-ray Binaries (SGXBs) which escaped previous detection because of their very obscured nature (e.g. Walter et al. 2006). The remaining ones, named Supergiant Fast X-ray Transients (SFXTs, Negueruela et al. 2006, Sguera et al. 2005, 2006), were missed before because of their very low level of quiescent X-ray luminosities (1032–1033 erg s-1) occasionally interrupted by fast X-ray flares lasting typically less than a day and reaching peak luminosities of 1036 erg s-1. This peculiar transient behaviour was never seen before from classical persistent SGXBs which are characterized by X-ray luminosities in the range 1036–1038 erg s-1 with few of them rarely displaying flaring activity on few hours timescale, i.e. Vela X-1 (Staubert et al. 2004, Laurent et al. 1995). As for the physical reason behind fast X-rays flares from SFXTs, they should reflect inhomogeneities in the donor star stellar wind which could be characterized by a clumpy nature (Negueruela et al. 2008, Walter & Zurita 2007, Leyder et al. 2007).
IGR J164794514 is one of the few SFXTs discovered so far by INTEGRAL. It was firstly detected during observations performed between August 8–10 2003 (Molkov et al. 2003); subsequently Sguera et al. (2005, 2006) unveiled its fast X-ray transient nature reporting several fast flares strongly resembling those of confirmed SFXTs. Recently, Chaty et al. (2008) and Rahoui et al. (2008) reported on optical and near/mid infrared observations of the source which lead to the identification of its counterpart with a supergiant star (O8.5I) at a distance of 4.9 kpc, hence its classification as a SFXT; specifically it is the one with the highest duty cycle so far observed (Sguera et al. 2005, 2006, Walter & Zurita 2007).
| N. | date | duration | peak flux | peak luminosity | KTBR | ref | |
|---|---|---|---|---|---|---|---|
| (UTC) | (hours) | (20–60 keV, mCrab) | (1036 erg s-1) | (keV) | |||
| 1 | 5 Mar 2003, 14:00 | 0.5 | 560 | 19 | 21 (0.56,14) | 2.90.2 (0.87,14) | 1 |
| 2 | 28 Mar 2003, 8:30 | 1.5 | 40 | 1.3 | 1 | ||
| 3 | 21 Apr 2003, 9:00 | 0.5 | 100 | 3.4 | 21 (0.6,14) | 3 (0.54,14) | 1 |
| 4 | 10 Aug 2003, 12:00 | 60 | 70 | 2.4 | 4 | ||
| 5 | 14 Aug 2003, 1:00 | 2 | 40 | 1.3 | 1 | ||
| 6 | 11 Aug 2004, 7:00 | 8 | 80 | 2.7 | 30 (0.74,14) | 2.50.4 (0.72,14) | 3 |
| 7 | 15 Aug 2004, 17:00 | 2 | 55 | 1.8 | 40 (1.1,14) | 2.30.9(1.06,14) | 3 |
| 8 | 7 Sep 2004, 2:00 | 2 | 80 | 2.7 | 44 (0.65,14) | 2.20.3 (0.65,14) | 2 |
| 9 | 16 Sep 2004, 17:00 | 2.5 | 120 | 4 | 2.60.2 (1.06,14) | 2 | |
| 10 | 27 Feb 2005, 14:30 | 3 | 75 | 2.5 | 46 (0.93,20) | 2.20.45 (1.01,20) | 3 |
| 11 | 27 Mar 2005, 19:00 | 1 | 40 | 1.3 | 3 | ||
| 12 | 3 Apr 2005, 00:00 | 2 | 45 | 1.5 | 3 | ||
| 13 | 4 Apr 2005, 03:00 | 9 | 45 | 1.5 | 29 (1.02,14) | 2.60.4 (1.01,14) | 2 |
| 14 | 9 Apr 2005, 12:00 | 50 | 60 | 2 | 3 | ||
| 15 | 12 Aug 2005, 19:00 | 9 | 55 | 1.8 | 26 (0.6,8) | 2.50.5 (0.6,8) | 3 |
| 16 | 17 Aug 2005, 21:30 | 8 | 40 | 1.3 | 3 | ||
| 17 | 26 Aug 2005, 05:00 | 6 | 40 | 1.3 | 3 | ||
| 18 | 30 Aug 2005, 04:00 | 0.5 | 180 | 6 | 38 (0.65,19) | 2.30.35 (0.8,19) | 5 |
| 19 | 3 Mar 2006, 09:30 | 3 | 60 | 2 | 3 |
= lower limit on the duration, = assuming a distance of 4.9 kpc (Chaty et al. 2008).
(1) Sguera et al. 2005; (2) Sguera et al. 2006; (3) this paper; (4) Molkov et al. 2003; (5) Kennea et al. 2005.
| No. | exposure | OBS date | average flux | average luminosity | ||
|---|---|---|---|---|---|---|
| ks | (UTC) | (1–9 keV, erg cm-2 s-1) | (erg s-1) | 1022 (cm-2) | ||
| OBS1 (decay flare N. 18) | 0.5 | 30 Aug 2005 | 1.110-10 | 3.21035 | =1.10.8 (0.99,20) | 8.5 |
| OBS1 (quiescence) | 8 | 30 Aug 2005 | 610-12 | 1.71034 | =0.750.6 (0.45,19) | 4.5 |
| OBS2 | 6.4 | 10 Sep 2005 | 2.610-11 | 7.41034 | =1.350.4 (0.9,54) | 9.5 |
| OBS3 | 4.1 | 14 Sep 2005 | 210-12 | 5.71033 | 0.6 (0.6,17) | 5 |
| OBS4 | 5.4 | 18 Oct 2005 | 7.510-12 | 2.11034 | =1.80.9 (0.55,17) | 8.4 |
= assuming a distance of 4.9 kpc (Chaty et al. 2008, Rahoui et al. 2008).
Here we report on the characteristics of 10 newly discovered fast flares detected by IBIS and provide for the first time 20–60 keV spectral information for the set of 19 flares detected so far; for one such flare we also report and discuss the broad band X-ray spectrum obtained combining simultaneous Swift/XRT, JEM-X and ISGRI data. Moreover we present, for the first time, broad band spectral data on the likely quiescent X-ray emission of IGR J164794514 which is a very rare information on SFXTs on account of their very recent discovery as class of sources.
2 Data analysis
For this study, we use data collected with IBIS/ISGRI (Ubertini et al. 2003, Lebrun et al. 2003) and JEM-X (Lund et al. 2003), the gamma-ray imager and X-ray monitor onboard the INTEGRAL satellite. In particular, the IBIS data set consists of 2250 pointings or Science Windows (ScWs, 2000 seconds duration) where IGR J164794514 was within 12∘ from the centre of the instrument FOV. All observations were performed from approximately the end of February 2003 to the beginning of April 2006. ISGRI images for each pointing were generated in the 20–60 keV band using the ISDC offline scientific analysis software OSA version 5.1; count rates at the position of the source were extracted from individual images in order to provide the source light curve from which a total of 19 flares were identified using the criterium described in section 3. Then an ISGRI spectrum (20–60 keV) of each flare was extracted and analysed; in one case (flare N. 18 in Table 1) the source was inside the JEM-X FOV, so that low energy spectral data could also be obtained over the 4–20 keV band. In order to further study the soft X-ray properties of the source, we also used X-ray data collected with XRT (X-ray Telescope) on board the Swift satellite (Gehrels et al. 2004) whenever available. From the Swift archive, we found that IGR J164794514 was observed four times during the period August-October 2005; Table 2 reports for each observation the corresponding exposure, date, X-ray flux and luminosity (1–9 keV) as estimated using an absorbed power law fit to the XRT data. XRT data reduction was performed according to the processes described in Landi et al. (2007). All spectral analysis reported in the paper was performed using Xspec version 11.3; uncertainties are given at the 90% confidence level for one single parameter of interest.
3 Timing analysis
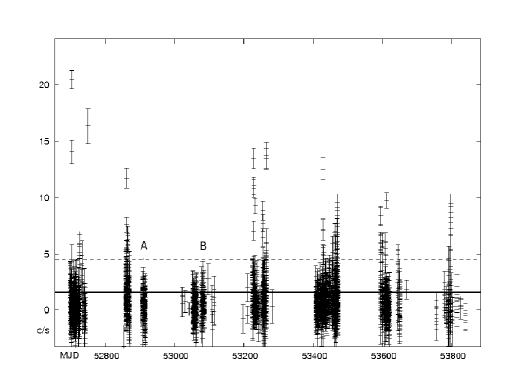
The ISGRI long term light curve (20–60 keV) of IGR J164794514 on ScW timescale is shown in Fig. 1, where the black line represents the 2 upper limit at the ScW level (10 mCrab or 1.2 10-10 erg cm-2 s-1). Most of the time the source is not significantly detected at ScW level and it is below the instrumental sensitivity of ISGRI; sporadically it undergoes fast X-ray flares. In particular we considered those outbursts having a peak flux greater than 30 mCrab or 3.610-10 erg cm-2 s-1 (20–60 keV); this peak flux value is represented in Fig. 1 by the broken line and corresponds to a source significance detection equal to or greater than 6 in the single ScW containing the peak of the flare. By applying this criterium, a total of 19 fast X-ray flares have been detected and they are listed in Table 1 together with the date of the peak emission, approximative duration of the entire flaring activity, flux and luminosity at the peak (20–60 keV). In particular, ten new flares are reported here for the first time (N. 6,7,10,11,12,14,15,16,17,19 in Table 1). We note that Walter & Zurita (2007) have reported a total of 38 flares (27 short and 11 long) from this source although no detailed analysis of individual flares is presented; the difference in the number of flares is likely due to a different total observing time and flare definition. In particular, we adopt a conservative peak flux threshold for flare recognition in order to pick up flare bright enough to extract a meaningful ISGRI spectrum.
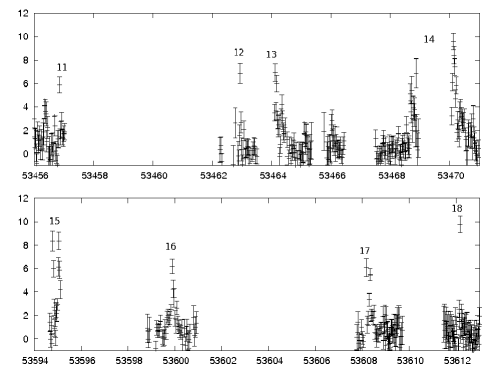
On the basis of Table 1, although the typical flare duration is only a few hours, we note that the source occasionally displays activity over a period of a few days. Following the classification between short and long flares by Walter & Zurita (2007), we report 12 flares of the first type and 7 of the second, i.e a similar ratio as they reported. The typical peak flux is in a narrow range 40–80 mCrab (20–60 keV) but occasionally much brighter flares occur. A detailed analysis of Fig. 1 indicates that the typical flare recurrence time is 1-2 days: 19 flares were detected over a total exposure of 23 days while occasionally more flares (4) were seen over a 9 days period (see examples in Fig. 2). This agrees quite well with the average recurrence time reported by Walter & Zurita (2007). To search for real evidence of periodicity, we further used the Lomb-Scargle method with the fast implementation of Press & Rybicki (1989) and Scargle (1982) but no indication of periodicity was found in the range 1–300 days. We also searched a 1 second bin time ISGRI light curve of all brightest outbursts in Table 1 (N. 1,6,9,10,18) for pulsations but none were found.
A deeper inspection of Fig. 1 also shows that the source occasionally enters long periods of very low flux level (for example, blocks A and B in Fig. 1) and we tentatively associate them to the source quiescence which must be below 10 mCrab (20–60 keV).
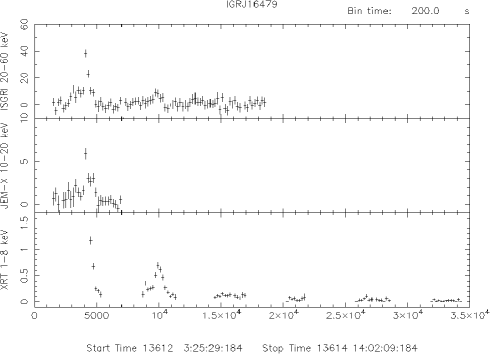
Flare N. 18 in Table 1 is particularly interesting because it was discovered by Swift/BAT (15–50 keV) which promptly triggered the Swift/XRT observation (1–8 keV) that caught the flare only during its decay phase (Kennea et al. 2005). Here we report for the first time on the simultaneous JEM-X and ISGRI detection of such flare which provides a light curve (200 seconds bin time) in two different energy bands: 10–20 keV (JEM-X) and 20–60 keV (ISGRI) as reported in Fig. 3.
During the four Swift/XRT observations (see Table 2), IGR J164794514 showed flaring activity only at the beginning of OBS1 (see bottom Fig. 3) where two X-ray flares are evident. Apart from the first flare previously cited, a second one started 4,000 seconds later with a duration of 1,000 seconds. It was outside the JEM-X FOV while it may be present in the ISGRI light curve (see top Fig. 3) however without sufficient statistical significance for a secure claim because it was too faint (average flux 210-11 erg cm-2 s-1, 1–9 keV). No more flaring activity was detected in the remaining part of OBS1 nor in the following Swift/XRT pointings (OBS2/3/4) and the source appeared to have reached its likely quiescent state with a typical 1–9 keV luminosity of 1034 erg s-1 (see Table 2).
4 X-ray spectral analysis
4.1 Flares
To date ISGRI spectral information on flares from SFXTs is sparse, however in the case of IGR J164794514 the large number of bright flares allows a proper study to be performed. For the majority of flares reported in Table 1 we were able to extract an ISGRI spectrum and perform a fit with two different spectral models: power law and bremsstrahlung. Spectral parameters, and corresponding degree of freedom (d.o.f) are all listed in Table 1. A discrimination between these two models on a statistical basis is not possible because all fits give acceptable and comparable ; the bremsstrahlung temperatures and power law indices fall in a narrow range of kT=21–46 keV and =2.2–3 and this suggests constancy in shape (but not flux) of the source spectra from flare to flare. Bearing this in mind and in order to improve the statistics, ISGRI spectra from all flares were fit together using the two models previously adopted; the bremsstrahlung model provided a kT=27 keV (=0.9, 109 d.o.f.) while the power law gave a =2.660.13 (=0.95, 109 d.o.f.).
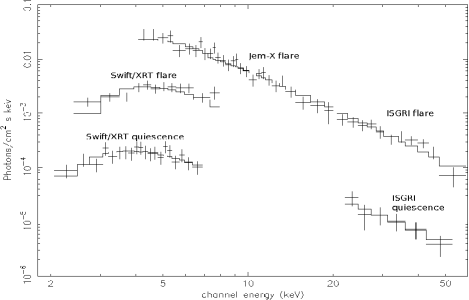
Next we analysed in detail flare N. 18 using all avaliable data. An absorbed power law fit to the Swift/XRT data alone (relative to only the first flare in bottom Fig. 3) provided a flat photon index and absorption NH (see Table 2) in excess to the galactic value, which along the line of sight is 2.11022 cm-2 (Dickey & Lockman 1990). JEM-X data alone are also well fit by a power law with photon index =2.20.2, a value very similar to that found by ISGRI. A change in shape is clearly evident going from Swift/XRT to JEM-X/ISGRI, possibly due to extra absorption or to a high energy cutoff. We subsequently performed the broad band spectral analysis over the 2–60 keV energy range; a simple power law model poorly fit the data since the residuals clearly show the presence of absorption at soft X-rays. In fact, an absorbed power law provides a meaningful fit to the data (=0.9, 154 d.o.f.) with =2.50.2 and NH=1631022 cm-2, Fig. 4 (top) displays such unfolded broad band spectrum. No cut-off is statistically required in the data fit. We introduced a costant to take into account possible miscalibrations between the instruments employed as well as to compensate for the incomplete coverage of Swift/XRT. The XRT/JEM-X and JEM-X/ISGRI constants were found to be 0.13 and 1, respectively; the former is low because Swift/XRT detected the flare only during its decay phase while JEM-X/ISGRI detected it throughout the entire duration of the event. The total NH inferred from the absorbed power law broad band fit is much higher than that obtained from individual Swift/XRT spectral fits; such high NH could explain why the Swift/XRT spectrum have a rather hard photon index compared to the steeper JEM-X/ISGRI spectra. Moreover, an absorbed bremsstrahlung model fits equally well the data (=1.05, 154 d.o.f., kT=19, NH=91022 cm-2) and the values of the two constants are very similar to those previously found.
4.2 Quiescence
From the long term light curve of IGR J164794514, we individuated a total of 530 pointings during which the source is not significantly detected in any individual ScW (see blocks A and B in Fig. 1); however a mosaic of all these ScWs provided a clear detection of the source at 9 level in the 20–60 keV band. The fluxes for spectral analysis were extracted from the location of IGR J164794514 in fine band mosaics of all 530 ScWs and a spectrum was produced according to the processes described in Bird et al. (2007). This spectrum is equally well fit using a power law (=2.51, =0.2, 4 d.o.f.) and a bremsstrahlung (kT=30 keV, =0.2, 4 d.o.f.). The average 20–60 keV flux and luminosity are 1.710-11 erg cm-2 s-1 and 51034 erg s-1; Walter & Zurita (2007) reported a similar ISGRI quiescent flux of 1.5410-11 erg cm-2 s-1 confirming that such value is the lowest hard X-ray emission level detected from the source to date.
The soft X-ray properties of the quiescence as detected by Swift/XRT can be safely associated to OBS2/3/4 and to the final part of OBS1. All spectra pertaining to these observations are best fit by an absorbed power law model (see Table 2); the values of the photon index are compatible within the uncertainties indicating that the source may be characterized by the same rather hard spectral shape during quiescence and also during the decay phase of flare N. 18. We checked for variability in the spectral indices between OBS4 and OBS1/quiescence by fixing the value of the first observation to that of the second; by doing so, no variability has been found since the photon index assumes an almost identical value of =.
We combined the Swift/XRT spectrum of OBS4 with that of ISGRI in quiescence to obtain broad band energy information over the 2–60 keV band. The underlyng assumption is that the spectral shape of the source did not change during the time interval between the Swift/XRT and the IBIS observations, which is reasonable given the constancy in shape seen both by IBIS and Swift/XRT. The best fit is provided by an absorbed power law model (=0.5, 22 d.o.f.) with =2.20.75 and a total NH=91022 cm-2; the cross calibration constant between the two instruments is 0.5. Fig. 4 (bottom) displays the unfolded broad band spectrum. Also in this case, the bremsstrahlung provided a comparably good fit (=0.4, 22 d.o.f.), however the temperature was not well constrained (kT 20 keV). We point out that the broad band X-ray spectral shapes of the source in quiescence and during flaring activity are very similar, as it can be clearly noted in Fig. 4.
5 Discussion and conclusions
In this paper, we present results from a long term monitoring of IGR J164794514 with detailed informations on 19 bright flares, 10 of which were newly discovered. The flares are detected typically every 1-2 days, this makes IGR J164794514 the SFXT with the highest duty cycle so far seen. However, occasionally the source is in a quiescent state; the longest period of inactivity sampled by our monitoring is 12 days. The typical flare duration is only a few hours but occasionally longer flaring activity has been detected. Our detailed X-ray spectral analysis shows that the shape of the source in quiescence and during flares is identical (i.e a rather steep power law with 2.6), despite large excursions in flux. Moreover, the source is always detected when observed by an X-ray instrument having sufficient sensitivity, such as Swift/XRT, with a 1–9 keV flux (luminosity) of 10-12 erg cm-2 s-1 ( 1034 erg s-1). Since the typical peak flux of flares is 10-9 erg cm-2 s-1, IGR J164794514 must accrete over a dynamic range of 3,500. More importantly, its quiescence is higher than that typical of other SFXTs by about two orders of magnitude (Negueruela et al. 2006) and this raises the possibility that during the quiescence of IGR J164794514, the compact object is still close to the supergiant donor star and so it is still accreting a significant amount of material from its wind but not in the form of clumps as during fast X-ray flares. This would explain the same spectral shape seen in quiescence and during flares since the emission mechanism should be the same, i.e. accretion onto the compact object. Consecutively, the system should be characterized by a small orbital radius and weak eccentricity, otherwise it would be in quiescence for longer intervals ( 12 days) and with lower X-ray luminosity than those effectively observed.
Considering that the quiescent X-ray luminosity of IGR J164794514 is intermediate between that of other SFXTs and classical persistent SGXBs, we suggest that this system is a transition object between the two classes; this supports the idea that there is a continuum of behaviours between SFXTs and classical SGXBs (Negueruela et al. 2007). What differentiates such systems is most likely the different wind properties and/or orbital parameters, i.e. orbital radius, orbital period and eccentricity (Negueruela et al. 2008, Chaty et al. 2008). It is important to point out that in the literature there are at least three other unidentified X-ray sources which could be similar to IGR J164794514, i.e. IGR J161954945 ( Sguera et al. 2006, Walter & Zurita 2007, Tomsick et al. 2006), IGR J164184532 (Sguera et al. 2006, Walter et al. 2006) and XTE J1743363 (Sguera et al. 2006, Walter & Zurita 2007).
The accumulation of exposure time and longer temporal coverage of the source by IBIS is very likely to further increase the possibility of discovering the orbital period of IGR J164794514 which could provide a key information to study and understand the physical reasons behind its very unusual X-ray behaviour.
Acknowledgements.
The authors acknowledge the ASI financial support via grant ASI-INAF I/088/06/0, ASI-IANF I/023/05/0References
- (1) Bird, A. J., Malizia, A., Bazzano, A. et al. 2007, ApJS, 170, 175
- (2) Chaty, S., Rahoui, F., Foellmi, C., et al. 2008, arXiv:0802.1774
- (3) Dickey, J. M. & Lockman F. J., 1990, ARA&A, 28, 215
- (4) Gehrels, N., Chincarini, G., Giommi, P., et al. 2004, ApJ, 611, 1005
- (5) Kennea, J.A., Pagani, C., Markwardt C., et al. 2005, ATEL 599
- (6) Landi, R., Masetti, N., Morelli, L. et al. 2007, ApJ, 669, 109L
- (7) Laurent, P., Paul, J., Denis, M., et al. 1995, A&A, 300, 399L
- (8) Lebrun, F., Leray, J. P., Lavocat, P., et al. 2003, A&A, 411, 141L
- (9) Leyder, J.C., Walter, R., Lazos, M., et al. 2007, A&A, 465, 35L
- (10) Lund,N.,Jorgentsen,C.,Westergaard,N.J.,et al., 2003,A&A,411, L231
- (11) Markwardt, C. B., Swank, J. H., Marshall, F. E., 1999, IAUC 7120
- (12) Molkov, S., Mowlavi, N., Goldwurm A., et al. 2003, ATEL 176
- (13) Negueruela, I., Torrejon, J., Reig, P., et al. 2008, arXiv:0801.3863
- (14) Negueruela, I., Smith, D., Torrejon, J., et al. 2007, arXiv:0704.3224
- (15) Negueruela, I., Smith,D., Reig, P., et al. 2006, ESA SP-604, 165
- (16) Press & Rybicki, 1989, ApJ, 338, 277
- (17) Scargle, J. D., 1982, ApJ, 263, 835
- (18) Rahou,i F., Chaty, S., Lagage, P., et al. 2008, arXiv:0802.1770
- (19) Sguera, V., Bazzano, A., Bird, A.J., et al., 2006, ApJ, 646, 452
- (20) Sguera, V., Barlow, E. J., Bird, A. J., et al., 2005, A&A, 444, 221
- (21) Staubert, R.,K reykenbohm, I., et al. 2004, ESA SP-552, 259
- (22) Tomsick, J. A., Chaty, S., Rodriguez, J., et al. 2007, ApJ, 647, 1309
- (23) Ubertini, P., Lebrun, F., Di Cocco, G., et al. 2003, A&A, 411, L131
- (24) Walter, R., Zurita Heras, J., Bassani, L., et al. 2006, A&A, 453, 133
- (25) Walter, R., Zurita Heras, J., 2007, A&A, 476, 335
- (26) Winkler, C., Courvoisier, T., Di Cocco, G., et al. 2003, A&A, 411, L1