A search for OH 6 GHz maser emission towards supernova remnants
Abstract
OH masers at 1720 MHz have proven to be excellent indicators of interactions between supernova remnants and molecular clouds. OH excitation calculations suggest that the 6049 MHz OH maser line is excited for higher column densities than for the 1720 MHz line. Previous observations and modelling of 1612, 1665 and 1667 MHz OH absorption and 1720 MHz OH masers indicated that the column densities in some supernova remnants, , may be high enough for 6049 MHz OH masers to exist. It is therefore a potentially valuable indicator of remnant–cloud interaction.
We present excitation calculations predicting the formation of 6049 MHz OH masers and results of a survey using the Parkes Methanol Multibeam receiver for 6049, 6035 and 6030 MHz OH masers towards 35 supernova remnants, a star-forming region and 4 fields in the Large and Small Magellanic Clouds.
Two new sites of 6035 and 6030 MHz OH maser emission associated with star-forming regions have been discovered, but no 6049 MHz masers were detected to a brightness temperature limit of 0.3 – 0.6 K, even though modelling of the OH excitation suggests that maser emission should have been detected. Our upper-limits indicate that the OH column density for a typical remnant , which conflicts with observed and modelled column densities. One possible explanation is that 6049 MHz OH masers may be more sensitive to velocity coherence than 1720 MHz OH masers under some conditions.
keywords:
supernova remnants, masers, stars: formation, radio lines: ISM.1 Introduction
Interactions between supernova remnants and molecular clouds are likely, as the short lifetime of massive stars mean that they do not move far from the molecular cloud in which they form. Once the star goes supernova the expanding remnant shocks the molecular cloud, heating and compressing it and changing the chemical composition of the gas. These shock waves contribute to the disruption of the cloud and may also trigger star formation.
Signatures such as kinematics and disturbed morphology have been used as the primary evidence of such interactions (e.g. Wootten, 1981; Routledge et al., 1991), but the interpretation was inconclusive due to confusion of the projection along the line of sight. The mixed-morphology class of supernova remnants is also believed to be an indicator of interaction with a molecular cloud. Mixed-morphology remnants appear center-filled in X-rays and shell-like at radio wavelengths (Rho & Petre, 1998). The supernova shock propagating into dense and possibly clumpy interstellar gas is believed to be responsible for the interstellar gas in the interior of the remnant, either through the evaporation of clumps overrun by the supernova shock (White & Long, 1991) or heat conduction reducing the internal temperature and density gradients (Cui & Cox, 1992; Chevalier, 1999; Cox et al., 1999; Shelton et al., 1999).
The discovery of 1720 MHz OH masers in supernova remnants, created in the shocked region, hence provided a solid diagnostic of the interaction. Produced by a transition within the ground rotational state of OH, 1720 MHz OH line emission towards supernova remnants was first detected in W28 and W44 by Goss & Robinson (1968). Frail, Goss & Slysh (1994) presented high-resolution images of W28 that showed a more extensive distribution of 1720 MHz emission than was expected and were the first to suggest that the 1720 MHz OH maser line may be a powerful diagnostic of the interaction of supernova remnants with molecular clouds. Elitzur (1976) showed that collisions of OH molecules with H2 molecules with kinetic temperatures below 200 K strongly inverted the 1720 MHz line. Densities between 103 and 105 cm-3 and temperatures between 50 and 125 K are needed for the inversion to function efficiently. The OH column density needed is 1016–1017 (e.g. Lockett, Gauthier, & Elitzur, 1999). At lower column densities the opacity is too small and at higher column densities radiative trapping thermalises the transition.
Surveys of 200 galactic supernova remnants (SNRs), have found that 1 in 10 have 1720 MHz emission (e.g. Green et al., 1997; Koralesky et al., 1998). The masers allow the kinetic distance to the SNR to be estimated as their velocities are close to the line-of-sight velocity of the unshocked cloud complex and are consistent with other measures of the systemic velocity of the remnant. Zeeman observations allow the line-of-sight magnetic field of the maser to be measured, from which the internal pressure of the supernova remnant can be calculated (e.g. Claussen et al., 1997). However, not all supernova remnants interacting with molecular clouds will have 1720 MHz masers, as the conditions may not be correct to produce 1720 MHz masers or the masers could be beamed away from the line of sight (Green et al., 1997). So another definitive signature of the interaction would be useful.
Masers resulting from a second maser transition would allow constraints to be placed on physical conditions, such as density and temperature in the masing region, particularly if the maser was spatially coincident with an observed 1720 MHz maser. It would also confirm the Zeeman interpretation of the splitting seen between the left- and right-hand circular polarisations (LHCP, RHCP) at 1720 MHz, as circular polarisation can be produced by non-Zeeman mechanisms (Elitzur 1996, 1998).
The 6049 MHz line in the first excited rotational level of OH is an analogue of the 1720 MHz satellite line. OH excitation calculations (Pavlakis & Kylafis, 2000; Wardle, 2007; Pihlström et al., 2008) suggest that the 6049 MHz satellite line may be present at higher OH column densities where the 1720 MHz line is weak or absent, and therefore might be a complementary signature of the interaction of supernova remnants and molecular clouds. The 4765 MHz OH line in the second excited rotational state peaks at an even higher column density of . This column density is higher than that expected in the interaction of supernova remnants and molecular clouds.
This motivated us to conduct searches for 6049 MHz OH maser emission using Parkes, ATCA, and exploratory time on the EVLA (ATCA and EVLA to be reported in another paper). Here we report on the search using the Parkes Radio Telescope and the Methanol Multibeam receiver. The preliminary results of this survey were presented in McDonnell, Vaughan, & Wardle (2007). No 6049 MHz maser emission was detected, however several 6030 and 6035 MHz OH masers associated with star-forming regions were found. It is not surprising that some star-forming regions were unintentionally included in the observed fields as star-formation can be triggered by supernovae. Fish, Sjouwerman, & Pihlström (2007) also observed pointings towards 14 supernova remnants at 6049 MHz but did not detect any OH emission.
2 Inversion of satellite lines of OH
Here we present excitation calculations (previously discussed in Wardle 2007) showing that when the OH column density exceeds at similar densities and temperatures for 1720 MHz OH maser emission, the inversion of the 1720 MHz line switches off, while the 6049 MHz transition in the first excited rotational state of OH becomes inverted. The calculations use a molecular excitation code developed by Wardle and tested against results from Lockett et al. (1999). Similar results were found by Pavlakis & Kylafis (2000) and Pihlström et al. (2008).
Our OH excitation calculations include the 32 lowest energy levels, with transition wavelengths and A values from Destombes et al. (1977) and Brown et al. (1982), and rates for collisional de-excitation by H2 kindly provided by Alison Offer (private communication). Following Lockett & Elitzur (1989) and Lockett et al. (1999), a uniform slab model was adopted for the masing medium. Radiative transfer is approximated using escape probabilities based on the mean optical depth, including the effects of line overlap. The slab is parametrised by density , temperature , column , velocity width, and a radiation field contributed by the Cosmic Microwave Background (CMB) and warm dust.
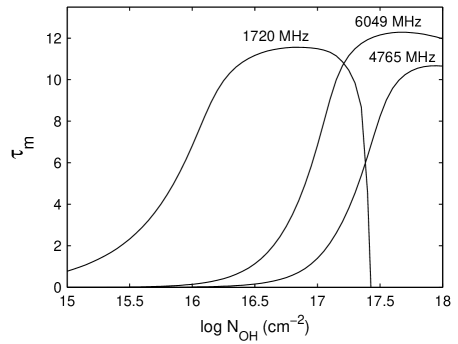
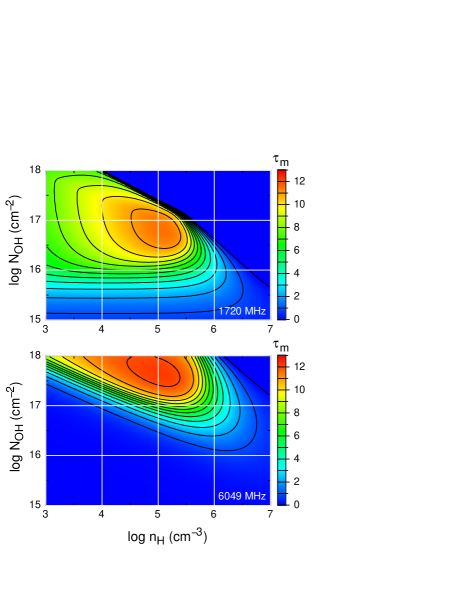
Figs. 1 and 2 show results for K, assuming small velocity gradients within the slab, and no far-infrared radiation from dust. These conditions are broadly consistent with warm gas that is cooling off behind a shock wave driven into a molecular cloud by an adjacent supernova remnant. Fig. 1 shows the maser optical depth through the slab for the 1720 MHz satellite line in the ground rotational state and its analogues in the first (6049 MHz) and second (4765 MHz) excited rotational states. At low OH column densities the 1720 MHz line is inverted, peaking in the range –, as expected. At about the optical depth of the slab to the 1720 MHz line suppresses the inversion. Meanwhile the inversion in the 6049 MHz line grows, peaking at . The 4765 MHz line peaks at . The effect of varying and is explored in Fig. 2. As expected, masing in the 1720 MHz line is strongest for and . The inversion of the 6049 MHz line requires column densities in excess of , while inversion at 4765 MHz (not shown) requires an OH column a few times higher still.
3 Observations and data reduction
The observations were made 2006 September 6–7 with the Parkes 64-m radio telescope and the Methanol Multibeam receiver. The seven-beam receiver covers a frequency range of 6.0–6.7 GHz, producing two 300 MHz IF bands in dual circular polarisation. The beamsize is 3.2 arcmin at 6.7 GHz and 3.4 arcmin at 6.0 GHz. At the frequencies observed, 6049, 6035 and 6030 MHz, this was assumed to be 3.4 arcmin. The beams are hexagonally configured with a beam separation on the sky of 6.462 arcmin. The feed was rotated 19.1 degrees with respect to the scan direction, such that the beams trace a comb of equally spaced paths, each 0.55 arcmin apart. The chosen correlator configuration allowed an 8 MHz bandwidth with 2048 channels for each IF, giving a channel width of 0.195 km s-1 at the observed frequencies. The pointing accuracy of the Parkes Telescope is better than 20 arcsecs.
The 6030 and 6035 MHz lines were observed in one IF with 6049 MHz being observed in the other. The 6030 and 6035 MHz fields were recentred such that the velocity centre was midway between the two frequencies and adjusted for the velocity of the remnant and the observatory in the Local Standard of Rest (LSR). If the velocity of the remnant was unknown, the frequency centre was estimated from supernova remnants nearby in RA and Dec. As the bandwidth of the second IF should be wide enough to include 6049 MHz emission at galactic velocities, only the extragalactic fields were recentered to account for their velocity at 6049 MHz.
Scans in right ascension and declination were conducted over the supernova remnants at a scan rate of 0.1 deg/min, with a total observing time in one scanning direction of 100 minutes per square degree, which corresponds to 10 scans. Based on the sizes of the remnants, scans were conducted over either 0.25, 0.5, 0.75 or 1.0 degree areas to completely cover the area of the remnant. The average rms noise ranges from 0.1 to 0.2 Jy/beam for an object scanned in both RA and Dec and is higher if scanned in only one direction.
The primary flux calibrator observed was 1934638. It has a positional accuracy of 0.02 arcsec. Each beam was scanned in RA then Dec through 1934638 and the power of a noise calibrator was compared with the known flux density of 1934638, which is 4.4 Jy at 6035 MHz. The calibrator was observed twice, but it was raining heavily during one of the observations so only one of the calibrator scans was used. The weather was cloudy or raining during all the observations and this adds to the uncertainty in the flux calibration.
Thirty-five supernova remnants, a star-forming region and four fields in the Large and Small Magellanic Clouds were observed (Table 1). The remnants were chosen such that the majority were known or thought to be interacting with molecular clouds. The star-forming region has a known 6035 MHz OH maser and was observed to confirm that the system was working. Eighteen of the galactic supernova remnants chosen have detected 1720 MHz OH masers (Frail et al. 1994; Yusef-Zadeh, Uchida, & Roberts 1995; Frail et al. 1996; Yusef-Zadeh et al. 1996; Claussen et al. 1997; Green et al. 1997; Koralesky et al. 1998; Yusef-Zadeh et al. 1999). The star-forming region 30 Doradus in the Large Magellanic Cloud (LMC) has a detected 1720 MHz maser and the supernova remnant N49, also in the LMC, is thought to have a 1720 MHz maser (Brogan et al. 2004; Roberts & Yusef-Zadeh 2005). However, as it is predicted that 1720 MHz OH masers are unlikely to be produced when the column density is high enough to produce 6049 MHz OH masers, half of the supernova remnants that were observed have no 1720 MHz masers, but other signatures indicating an interaction with a molecular cloud. Eleven of the remnants surveyed are a part of the mixed-morphology class of supernova remnants with an additional nine possibly being members of this class (Rho & Petre, 1998; Yusef-Zadeh et al., 2003). Other signatures suggestive of an interaction with a molecular cloud such as TeV -ray emission (Fukui et al., 2003), infrared emission suggesting molecular shocks (e.g. Reach et al. 2006), or the presence of shocked CO or nearby CO clouds (e.g. Dubner et al. 1999), were used to identify prospective galactic supernova remnants.
Two fields in the Small Magellanic Cloud (SMC) were observed when no galactic supernova remnants were above the telescope horizon. The fields were chosen to contain as many supernova remnants as possible - nine in the first field and eight in the second (Filipović et al., 2008).
The data were flux-calibrated, continuum subtracted and gridded using the programs Livedata and Gridzilla (Barnes et al., 2001). Livedata is a program specifically designed for data taken with the Parkes Multibeam receiver. It removes the bandpass, calibrates the spectra, applies doppler tracking, and smoothes and removes the baselines of the spectrum. The bandpass calibration uses robust statistical estimators, such as median estimators, which can reject radio frequency interference without human intervention and is tailored to identify compact emission regions. Gridzilla converts the individual spectra produced by Livedata into position-position-velocity cubes by placing the spectra on a regular grid. The gridding process determines which spectra will contribute to an individual pixel, rejects those spectra which appear to contain corrupt data and ascribes a statistical weight to each remaining spectrum. The value of the pixel is then calculated based on the input data and weights. As with Livedata, the gridding process is optimised for point sources and uses the median statistic to produce more robust results. A scale of 1 arcmin per pixel was used.
The data cubes were first searched for any obvious maser emission by eye and then searched using the program Duchamp111http://www.atnf.csiro.au/people/Matthew.Whiting/Duchamp/. Duchamp is designed to search for small, isolated objects within spectral-line data cubes. The program searches for connected voxels that are above some flux threshold, with user-defined limits on size and no assumption made as to the shape of the detections.
The cube can be reconstructed using the à trous wavelet procedure, which effectively reduces much of the noise in the image, thereby allowing the cube to be searched to fainter levels while reducing the number of spurious detections. The reconstruction is conducted by discretely convolving the input array with a B3-spline filter function, determining wavelet coefficients by calculating the difference between the convolved array and the input array and if these coefficients are above the requested threshold at a given point, they are added to the reconstructed array. The separation between the filter coefficients is then doubled and the first step is performed again with the convolved array as the input array. This process is continued until the maximum number of scales required is reached and then the final smoothed array is added to the reconstructed array to provide the ‘DC offset’.
The 2-dimensional raster-scanning algorithm of Lutz (1980) is used to search the cube for detections, one channel map at a time. The middle of the noise distribution and the width of the distribution is used in calculating the threshold. The threshold is determined using the False Discovery Rate technique (Miller et al., 2001; Hopkins et al., 2002). This is given by the number of false detections divided by the total number of detections and is set by the user. In practice, the final list of detected objects that are false positives will be much smaller than that requested by the user as, due to merging and rejection of the individual pixels, there is not a direct connection between this value and the fraction of detections that will be false positives.
The repeated detections in the list produced are then combined in an algorithm that matches objects judged to be ‘close’. The threshold distances apart for two objects to be merged spatially and in the velocity axis are set by the user. The spatial requirement can be set such that there must be a pair of pixels that are adjacent. Once the detections are merged, they can be grown to some secondary threshold and then are sent through the merging algorithm again. To be accepted as detections, the objects must span both a minimum number of velocity channels and a minimum number of spatial pixels.
The à trous reconstruction was used with a false discovery rate of 10 percent. The detections were restricted to being adjacent in space and velocity and a minimum of two velocity channels wide and 12 spatial pixels in size.
| Source | RA | Dec | Centre | Size | Area | No. of | RMS noise | Notes | |
|---|---|---|---|---|---|---|---|---|---|
| (J2000) | (J2000) | VLSR | (arcmin) | (deg) | scans | (Jy/beam) | |||
| (h m s) | (° ′ ″) | (km s-1) | (RA/Dec) | 6035 | 6049 | ||||
| N49 | 05 26 01 | 66 05 00 | +278 | 0.25 | 2/2 | 0.11 | 0.13 | m1 | |
| 30 Doradus | 05 38 42 | 69 06 00 | +242 | 0.25 | 2/2 | 0.11 | 0.13 | S2, m3 | |
| G240.315+0.071 | 07 44 52 | 24 08 00 | +63.6 | 0.25 | 1/1 | 0.15 | 0.17 | S4 | |
| G272.23.2 | 09 06 50 | 52 07 00 | 77 | 15 | 0.50 | 1/1 | 0.11 | 0.13 | MM5 |
| G284.31.8 | 10 18 15 | 59 00 00 | 10 | 24 | 0.50 | 1/1 | 0.11 | 0.13 | I6 |
| IC 443 (G189.1+3.0) | 06 17 00 | +22 34 00 | 4 | 45 | 0.75 | 1/1 | 0.11 | 0.12 | m7, MM8, F, H |
| G286.51.2 | 10 35 50 | 59 42 00 | 40 | 0.50 | 1/1 | 0.11 | 0.13 | ||
| G289.70.3 | 11 01 15 | 60 18 00 | 35 | 0.50 | 1/1 | 0.11 | 0.13 | ||
| G290.10.8 (MSH1161A) | 11 03 05 | 60 56 00 | +15 | 0.50 | 1/1 | 0.12 | 0.13 | MM8 | |
| G292.0+1.8 (MSH 1154) | 11 24 36 | 59 16 00 | 36 | 0.50 | 1/1 | 0.11 | 0.13 | ||
| Kes17 (G304.6+0.1) | 13 05 59 | 62 42 00 | 38 | 8 | 0.25 | 1/1 | 0.16 | 0.19 | I?9 |
| G327.11.1 | 15 54 25 | 55 09 00 | 38 | 18 | 0.50 | 1/1 | 0.12 | 0.14 | |
| Kes 27 (G327.4+0.4) | 15 48 20 | 53 49 00 | 38 | 21 | 0.50 | P/1 | 0.12 | 0.14 | MM8 |
| RCW 103 (G332.40.4) | 16 17 33 | 51 02 00 | 48 | 10 | 0.25 | 1/1 | 0.13 | 0.18 | I10 |
| CTB 33 (G337.00.1) | 16 35 57 | 47 36 00 | 69 | 1.5 | 0.25 | 1/1 | 0.16 | 0.18 | m11 |
| Kes 41 (G337.80.1) | 16 39 01 | 46 59 00 | 45 | 0.25 | 1/1 | 0.16 | 0.19 | m12, MM?13 | |
| G346.60.2 | 17 10 19 | 40 11 00 | 76 | 8 | 0.25 | 1/1 | 0.16 | 0.18 | m12, MM?13 |
| G347.30.5 | 17 13 50 | 39 45 00 | 6 | 1.00 | 0/1 | 0.14 | 0.16 | I14 | |
| CTB37A (G348.5+0.1) | 17 14 06 | 38 32 00 | 42 | 15 | 0.50 | 1/1 | 0.12 | 0.14 | m11, H |
| G349.7+0.2 | 17 17 15 | 38 04 00 | +15 | 0.25 | 1/1 | 0.17 | 0.19 | m11, MM?13, H | |
| G357.7+0.3 | 17 38 35 | 30 44 00 | 35 | 24 | 0.50 | 0/1 | 0.20 | 0.21 | m15, MM?13, H |
| G357.70.1 (MSH 1739) | 17 40 29 | 30 58 00 | 12 | 0.25 | 1/1 | 0.17 | 0.20 | m11, MM?13, H | |
| G359.10.5 | 17 45 30 | 29 57 00 | 5 | 24 | 0.50 | 1/1 | 0.15 | 0.17 | m16, MM13, H |
| Sgr A East (G0.0+0.0) | 17 45 44 | 29 00 00 | +58 | 0.25 | 1/1 | 0.19 | 0.21 | m17, MM13, F | |
| Sgr D (G1.10.1) | 17 48 30 | 28 09 00 | 1 | 8 | 0.25 | 1/1 | 0.16 | 0.19 | m15, MM?13, F |
| G1.40.1 | 17 49 39 | 27 46 00 | 2 | 10 | 0.25 | 1/1 | 0.16 | 0.18 | m15, F |
| W 28 (G6.40.1) | 18 00 30 | 23 26 00 | +9 | 48 | 1.00 | 1/1 | 0.11 | 0.12 | m18, MM8, F, H |
| G11.20.3 | 18 11 27 | 19 25 00 | +65 | 4 | 0.25 | 1/1 | 0.16 | 0.18 | |
| G16.7+0.1 | 18 20 56 | 14 20 00 | +20 | 4 | 0.25 | 0/1 | 0.22 | 0.25 | m19, MM?13, F, H |
| Kes 67 (G18.8+0.3) | 18 23 58 | 12 23 00 | +18 | 0.50 | 1/1 | 0.12 | 0.14 | I20 | |
| Kes 69 (G21.80.6) | 18 32 45 | 10 08 00 | +69 | 20 | 0.50 | 1/1 | 0.12 | 0.13 | m19, MM?13, F, H |
| G22.70.2 | 18 33 15 | 09 13 00 | +81 | 26 | 0.50 | P/1 | 0.15 | 0.17 | I9 |
| 3C 391 (G31.9+0.0) | 18 49 25 | 00 55 00 | +110 | 0.25 | P/1 | 0.16 | 0.18 | m11, MM8, F, H | |
| Kes 79 (G33.6+0.1) | 18 52 48 | 00 41 00 | +110 | 10 | 0.25 | 1/1 | 0.16 | 0.18 | I21, MM?8 |
| W 44 (G34.70.4) | 18 56 00 | +01 22 00 | +45 | 0.75 | 0/1 | 0.17 | 0.17 | m7, MM8, F, H | |
| 3C 397 (G41.10.3) | 19 07 34 | +07 08 00 | +40 | 0.25 | 1/1 | 0.15 | 0.17 | I?22 | |
| W 49B (G43.30.2) | 19 11 08 | +09 06 00 | +48 | 0.25 | 1/1 | 0.16 | 0.18 | I?23 | |
| W 51C (G49.100.1) | 19 23 19 | +14 09 00 | +70 | 0.50 | 0/1 | 0.15 | 0.17 | m19, MM8, F, H | |
| 3C 400.2 (G53.62.2) | 19 38 50 | +17 14 00 | +29 | 0.75 | 0/1 | 0.14 | 0.16 | MM8 | |
| SMC field 1 | 01 01 50 | 71 58 00 | +150 | 1.00 | 1/1 | 0.10 | 0.11 | 9 SNRs24 | |
| SMC field 2 | 00 51 00 | 73 00 00 | +150 | 1.00 | 1/1 | 0.11 | 0.12 | 8 SNRs24 | |
P: Partial scan of area in this direction, MM: mixed-morphology, S: star forming region, I: other signatures indicating interaction with molecular cloud, m: source with 1720 MHz masers, F: SNRs with pointings observed at 6049 MHz by Fish et al. (2007), H: SNRs with pointings observed at 1612, 1665, 1667 and 1720 MHz by Hewitt et al. (2006)
References – (1) Brogan et al. 2004 (2) Walborn & Blades 1987 (3) Roberts & Yusef-Zadeh 2005 (4) Bronfman, Nyman, & May 1996 (5) Greiner, Egger, & Aschenbach 1994 (6) Ruiz & May 1986 (7) Claussen et al. 1997 (8) Rho & Petre 1998 (9) Reach et al. 2006 (10) Oliva, Moorwood, & Danziger 1989 (11) Frail et al. 1996 (12) Koralesky et al. 1998 (13) Yusef-Zadeh et al. 2003 (14) Fukui et al. 2003 (15) Yusef-Zadeh et al. 1999 (16) Yusef-Zadeh et al. 1995 (17) Yusef-Zadeh et al. 1996 (18) Frail et al. 1994 (19) Green et al. 1997 (20) Dubner et al. 1999 (21) Green & Dewdney 1992 (22) Safi-Harb et al. 2005 (23) Keohane et al. 2007 (24) Filipović et al. 2008
4 Results
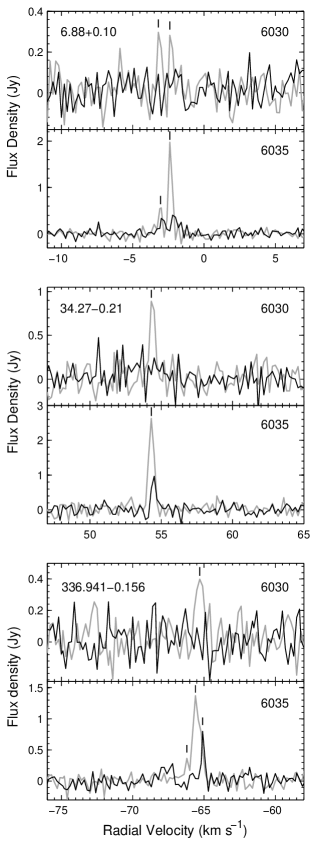
No 6049 MHz OH maser emission was detected to a 3- level of 0.3 to 0.6 Jy/beam, with the noise limits for each SNR listed in Table 1. These limits are for the average of the two circular polarisations. However, eleven masers at 6035 and three at 6030 MHz not associated with the supernova remnants were detected. These masers are likely to be associated with star-forming regions. Fig. 3 shows the spectra of the six sources with only 6035 MHz emission detected. The 6035 MHz source 43.149+0.013 contained in this figure is a confused source with spectral features from three masers: 43.149+0.013, 43.165+0.013 and 43.1650.028. Spectra of the three detected 6030 MHz sources aligned in velocity with their associated 6035 MHz sources are shown in Fig. 4, two of which are new detections.
| 6035 MHz | 6035 MHz | 6030 MHz | Magnetic | Notes | |||||||
|---|---|---|---|---|---|---|---|---|---|---|---|
| OH maser | RA (2000) | Dec (2000) | Velocity Peak | Peak Flux | Peak Flux | Field | |||||
| Field | (l b) | (km s-1) | (Jy) | (Jy) | (mG) | ||||||
| ( ) | (h m s) | ( ) | L | R | L | R | L | R | |||
| G240.315+0.071 | 240.316+0.071 | 07 44 51.97 | 24 07 42.3 | +63.6 | +63.6 | 1.22 | 0.37 | - | - | - | |
| CTB 33 | 336.822+0.028 | 16 43 38.29 | 47 36 32.9 | 77.3 | 77.5 | 0.78 | 0.70 | - | - | 3.6 | E |
| CTB 33 | 336.9410.156 | 16 35 55.20 | 47 38 45.4 | 65.6 | 65.1 | 1.37 | 0.80 | 0.40 | - | +10.4 | |
| Kes 41 | 337.6130.060 | 16 38 09.54 | 47 04 59.9 | 42.2 | 42.4 | 0.41 | 1.35 | - | - | 3.6 | |
| Kes 41 | 337.7050.053 | 16 38 29.67 | 47 00 35.8 | 53.6 | 50.7 | 0.58 | 0.94 | - | - | - | |
| W28 | 6.88+0.10 | 18 00 49 | 22 57 26 | 2.4 | 2.2 | 1.98 | 0.40 | 0.30 | - | +3.6 | N |
| W44 | 34.270.21 | 18 54 37 | +01 05 29 | +54.3 | +54.5 | 2.63 | 0.97 | 0.89 | 0.48 | +3.6 | N |
| W49B | 43.149+0.013 | 19 10 11.05 | +09 05 22.1 | +11.2 | +10.8 | 0.76 | 0.46 | - | - | text | E,C |
| W51C | 49.010.30 | 19 22 29 | +14 07 24 | +67.5 | +67.7 | 0.87 | 1.97 | - | - | +3.6 | |
N: newly detected maser, E: maser on spatial edge of field, C: confused source.
Table 2 contains the list of identified masers. The field in which the maser was located is listed in column 1 and the galactic longitude and latitude is used as a source name, following the usual practice, and is shown in column 2. The coordinates for each source are given in columns 3, 4 (equinox J2000) and refer to the position of the strongest feature (taken from higher resolution observations for the previously known masers). The positional uncertainty for the positions derived from the current observations is 15 arcsec. The velocity of the strongest left- and right-hand circular polarisation components (LHCP and RHCP) at 6035 MHz are given in columns 5 and 6 and the peak flux at 6035 MHz is given in columns 7 and 8. The peak flux at 6030 MHz for both polarisations are listed in columns 9 and 10 and the estimated magnetic field is given in column 11, where a field directed away from us is positive and is indicated by the RHCP feature at a more positive velocity than the LHCP feature. Column 12 gives notes about the maser detection. As per convention, spectra are scaled such that the total intensity is the sum, not the average, of the two circular polarisations. The continuum levels in the spectra varied from 0.01–0.05 Jy. The spectra have had this continuum offset removed and the fluxes were measured with respect to the continuum level.
As left- and right-hand circular polarisations were observed, Zeeman pairs can be identified. A 1 mG line-of-sight magnetic field component produces splittings equivalent to 0.079 km s-1 and 0.056 km s-1 in the 6030 and 6035 MHz transitions respectively (Davies, 1974). Thus a difference of one channel width between the left and right polarisations at 6035 MHz corresponds to a line-of-sight magnetic field of 3.6 mG. The observed splittings were one to three channels so the magnetic fields are rough estimates, with an estimated uncertainty of approximately 2 mG (see Table 2).
Individual maser sources are discussed below.
240.316+0.071. (Field: G240.315+0.071, spectrum in Fig. 3) This source was first observed by Caswell & Vaile (1995) and has remained stable with the intensity of the strongest feature at approximately 2 Jy in LHCP through previous observations (Caswell, 2003). Our new observations show that the strongest features of both the LHCP and the RHCP have halved in intensity and a secondary peak at approximately +62 km s-1 is no longer visible in the spectrum for either polarisations. In agreement with previous observations, no Zeeman splitting was detected.
336.822+0.028. (Field: CTB 33, spectrum in Fig. 3) This source was on the spatial edge of the field in which it was located. The spectrum has not changed much from Caswell & Vaile (1995), the only real difference is a slight increase in intensity of the single LHCP and RHCP feature. Assuming that the features are a Zeeman pair, with the LHCP feature at a larger velocity than the RHCP by 0.2 km s-1, a magnetic field of mG is determined. Within the spectral resolution of our observations, this is in agreement with the value of mG determined by Caswell & Vaile (1995).
336.9410.156. (Field: CTB 33, spectrum in Fig. 4) The 6035 MHz emission was discovered by Caswell (2001) and the 6030 MHz by Caswell (2003). There are significant differences between the previous spectra and the new observations. There was minimal RHCP 6035 MHz emission detected in 2001, in comparison to a strong feature detected in the current observations. As the RHCP feature is at a larger velocity than the LHCP by 0.6 km s-1, a magnetic field of +10.4 mG is calculated. With the lower spatial resolution of the current observations, it is not possible to determine whether the 6030 MHz LHCP maser emission contains the two features present in the 2001 observations. The RHCP 6030 MHz emission was not strong enough to be detected.
336.9830.183. (Field: CTB 33) This weak source discovered by Caswell (2001) was below our detection limit.
337.6130.060. (Field: Kes 41, spectrum in Fig. 3) The 2001 observations showed marked changes from the 1994 observations, with the strongest feature at km s-1 halving in intensity and a new LHCP feature at km s-1 of 1 Jy becoming the strongest feature (Caswell, 2003). Our 2006 observations also show change, with the RHCP feature at km s-1 now being the strongest feature and no obvious feature at km s-1. The magnetic field is approximately mG, which is in agreement with that derived from the 1994 observations and from an associated 1665 MHz maser (Caswell & Vaile, 1995).
337.7050.053. (Field: Kes 41, spectrum in Fig. 3) The new observations are similar to the spectrum from Caswell & Vaile (1995), the major difference being that the RHCP polarisation between and km s-1 is much lower. The RHCP is consistently at a more positive velocity than the LHCP, indicating a Zeeman pattern and in agreement with the previous observations, but as the features are blended together and the spectral resolution is not very high, no magnetic field could be estimated.
6.88+0.10. (Field: W28, spectrum in Fig. 4) This 6030 and strong 6035 MHz source is a new maser with RHCP possibly at a larger velocity than LHCP at 6035 MHz by 0.2 km s-1, corresponding to a magnetic field of +3.6 mG, assuming that the features form a Zeeman pair.
22.4350.169. (Field: G22.7-0.2) This source discovered by Caswell & Vaile (1995) was below our detection limit.
34.270.21. (Field: W44, spectrum in Fig. 4) This new 6030 and strong 6035 MHz maser may be what was characterised a ‘possible’ 6035 MHz detection at coordinates 34.30.15 and velocity 56.0 km s-1 by Guilloteau et al. (1984). The 6035 MHz maser is characterised by a single feature in both polarisations and the RHCP is at a larger velocity than the LHCP by 0.2 km s-1, giving a magnetic field of +3.6 mG. The LHCP 6030 MHz emission is comparable to the intensity of the RHCP 6035 MHz emission.
43.149+0.013, 43.165+0.013 and 43.1650.028. (Field: W49B, spectrum in Fig. 3) These three masers are located within W49 North and South. 43.149+0.013 and 43.165+0.013 lie in the northern complex and are separated by nearly 60 arcsec (Caswell, 2001) while 43.1650.028 is nearly 3 arcmin away from the other two in the southern complex. Emission from these three masers was confused in the current observations as the beam size was 3.4 arcmin. The emission was also on the edge of the field. The maser emission is weaker than detected by Caswell & Vaile (1995) and the features at +17 km s-1 are barely visible, but this may be because the emission is on the very edge of the field. A magnetic field is not calculated due to the above confusion, but the larger velocity of the LHCP with respect to the RHCP for the features at +10 km s-1 to +12 km s-1 agrees with previous observations.
49.010.30. (Field: W51C, spectrum in Fig. 3) This 6035 and 6030 MHz maser was detected by Baudry et al. (1997) at the position 48.990.30. 6030 MHz was not detected in our current observations and may be below the detection limit. The 6035 MHz spectrum is similar to the previous observation, with the major difference being a large reduction in the brightness of the feature at +69 km s-1. The RHCP at 6035 MHz is at a larger velocity than the LHCP by 0.2 km s-1, giving a possible magnetic field of +3.6 mG.
The 6035 MHz maser at 49.010.30 is coincident with a compact H II region G49.00.30 and an IRAS source which is believed to be an ultracompact H II region (Koo, 1999). The radio recombination line velocity of G49.00.30 is between +64–66 km s-1 (Pankonin, Payne, & Terzian, 1979), which is consistent with the velocity of the maser.
While not all of the masers discussed above have known associated H II regions or ultracompact H II regions, it is expected that they are all associated with star-forming regions. The variability seen in the masers is expected. Caswell & Vaile (1995), for example, discussed the variability of 6035 MHz OH masers in star-forming regions. They found that while there seemed to be no perceptible changes over an interval of a few days (although shorter time-scale variations had been reported previously, e.g. the transient appearance and disappearance of a feature in 351.420+0.64 in less than 12 hours by Zuckerman et al. 1972), some changes could be seen on a 6-month interval, and many changes could be seen over a 20-year period, including more than 50 percent changes in intensity in some features. Our observations show that some of the masers have changed in intensity from the 2001 to the 2006 observations, with some strong features halving and some features disappearing completely.

5 Discussion
Fish et al. (2007) observed pointings at 6016, 6030, 6035 and 6049 MHz towards 14 supernova remnants using the Effelsberg 100-m telescope, 10 of which were covered in our observations (see Table 1 column 10), during 2007 July. The sensitivity of their observations was an order of magnitude better, with a 5- rms of 30 mJy. No masers were detected towards any of the supernova remnants observed down to this level, in agreement with our observations.
Eleven 6035 MHz OH masers and three OH 6030 MHz masers were detected in our study. These masers are generally associated with star-forming regions rather than supernova remnants. 1665 MHz OH masers are usually the strongest OH transition in star-forming regions, but weaker masers at other OH transitions, such as 6030 and 6035 MHz are also often detected. Models of masers in star-forming regions predict these transitions. For example, Gray, Doel, & Field (1991) and Gray, Field, & Doel (1992) found that bright 6035 MHz masers are formed in warm dense regions where collisions play an important role in creating the inversion. The multiple maser spots at each site arise in the dusty molecular envelope around a massive star in its early stages of formation. The maser spots are valuable probes that can reveal the physical parameters of the environment where the massive star is forming, at a stage before it has been disrupted by the embedded star, and before the visible light can emerge through the dust. The maser phase occurs at the same time as the development of an ultracompact H II region around the star, but fade rapidly when the H II region has expanded to a size greater than AU (Forster & Caswell, 2000).
Green et al. (2008) have conducted a survey for 6035 MHz OH and 6668 MHz methanol masers in the Magellanic Clouds. With a 3- limit of 0.39 Jy, they did not detect any 6035 MHz masers in the SMC, which is in agreement with our lack of detections for the two fields in the SMC.
No OH 6049 MHz maser emission was detected in the current work above our 3- levels, which range from 0.3 to 0.6 Jy/beam. Therefore, a constraint can be placed upon the line-of-sight column density of the OH in supernova remnants. Assuming a spatially uniform background continuum filling the beam plus a compact foreground OH masing column, filling a fraction of the beam, the observed intensity of a particular line can be written as
| (1) |
where is the background continuum intensity, is the Planck function, is the optical depth, is the filling factor, and is the excitation temperature for the line. Assuming that K and the Rayleigh-Jeans approximation holds, equation (1) can be rewritten as
| (2) |
is the brightness temperature of the maser line detected by the telescope. Fixing the H2 density at 105 cm-3, a typical value determined for 1720 MHz OH maser-emitting regions (Lockett et al., 1999), and using the model described in section 2, , and can be computed for a particular . For , K, which is much less than the continuum brightness temperatures typically found in supernova remnants (20 K, e.g. G349.7+0.2, Lazendic et al. 2004).
Therefore, assuming that is small, equation (2) can be approximated by
| (3) |
As no 6049 MHz masers were detected, is the observed 3- brightness temperature limit for the fields, which varies from to 0.6 K ( K). Therefore it can be seen that the limits on the optical depth depend on the values for the filling factor and the background continuum.
Hewitt, Yusef-Zadeh, & Wardle (2008) found that a typical filling factor for the 1720 MHz OH masers observed with the Green Bank Telescope (GBT) was 0.005. As our beamsize is 3.4 arcmin compared to the 7.2 arcmin of the GBT, the typical filling factor is multiplied by four to give an appropriate value of 0.02. Assuming the stated continuum brightness temperature above of 20 K, it can be seen that
| (4) |
and therefore . From Fig. 1, this indicates a maximum OH column density of at 6049 MHz.
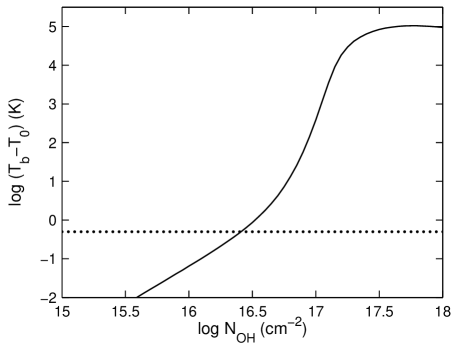
By way of example, consider the supernova remnant G349.7+0.2. For this remnant, no 6049 MHz masers were detected to a 3- level of 0.5 K. Assuming the filling factor of 0.02 and background continuum brightness temperature of 20 K from above, the predicted brightness temperature for a 6049 MHz maser versus the column density is given in Fig. 5. The minimum observed brightness temperature of 0.5 K is also plotted, and the intersection of this line with the predicted brightness temperature provides a limit on the column density of the OH, consistent with the estimate from above. It can be seen that changing the filling factor and the continuum brightness temperature does not make much difference to the limit on , and hence on the OH column density.
If the column density in the supernova remnant was above 1016.4 cm-2, 6049 MHz maser emission should have been detected. One possible interpretation of this limit, therefore, is that the column density must be below 1016.4 cm-2 for this remnant. However, this conflicts with results obtained by Hewitt et al. (2008) who reported a column density of 1017 for areas in this remnant.
Assuming all other parameters are static, if the filling factor is an order of magnitude smaller than in the above calculations, the limit on the column density is and if it is an order of magnitude larger, the limit is . The 3- rms brightness temperature varies from 0.27 K to 0.59 K over the fields observed, which gives column densities ranging between and . Changes in this parameter are therefore not significant for the fields observed. Changing the temperature of the gas does not appear to significantly alter the results, as an increase to 75 K, as estimated by the modelling of Hewitt et al. (2008), lowers the column density limit only slightly to .
We now consider the range of filling factors inferred from the 1720 MHz observations by Hewitt et al. (2008). The minimum filling factor, , was obtained for clumps E, F in W28, with for a kinetic temperature of 75 K. The corresponding factor for the Parkes beam is , and for K, our column density limit was . Increasing reduces the limit, whereas, even at K, the limit on is still below the column density predicted by Hewitt et al. (2008). At the other extreme, the maximum filling factor, , is for clumps D,E,F in W44, giving a predicted for a kinetic temperature of 50 K. For our beam, , and for K, our column density limit was . As above, increasing reduces the limit. If K, the column density limit is still below the column density predicted by Hewitt et al. (2008), but if it is reduced further to K, the column density limit is above the predicted column density value. Therefore, for almost all cases, the sensitivity of the observations was sufficient to detect 6049 MHz OH maser emission that theoretically should have been produced.
This indicates that, assuming that the column densities estimated by Hewitt et al. (2008) are correct, 6049 MHz OH maser emission should have been observable in at least several of the remnants. Several explanations may account for this conflict: the filling factor may be much smaller than estimated because the background continuum temperature is much higher, the continuum level could vary significantly over the beam, or there may be some other mechanism that is disrupting the formation of the masers, such as a too high velocity gradient in the OH column. However, as 1720 MHz OH masers are produced in some of these remnants and the excitation modelling does correctly predict the column density ranges expected for the amplification of 1720 MHz OH masers, any mechanism that stops the formation of the 6049 MHz OH masers cannot affect the production of 1720 MHz OH masers. Previous modelling by Lockett et al. (1999) and Wardle (2007) only includes the thermal FWHM of the 1720 MHz and 6049 MHz OH lines,
| (5) |
where is Boltzmann’s constant, is the kinetic temperature and is the mass of a hydrogen atom. For K, this is 0.37 km s-1. If we allow non-thermal broadening, as expected in clouds, for and K at an OH column density of , the 6049 MHz inversion disappears at a FWHM linewidth of 0.54 km s-1, whereas 1720 MHz is no longer produced at 0.70 km s-1. Therefore an increased sensitivity to velocity coherence may provide a partial explanation as to why 6049 MHz OH masers were not seen and yet 1720 MHz OH masers were seen in some remnants. However, the observed line widths of 1720 MHz OH masers are generally wider than predicted by any of the current models.
Note, however, that the OH column density expected in SNR–cloud interactions is uncertain. Existing models of OH production rely on UV or X-ray dissociation of the water produced in molecular shocks, and yield column densities (Lockett et al., 1999; Wardle, 1999). As the dissociation rate of OH is approximately half that of H2O, these models predict OH/H, and typically much less. This conflicts with recent absorption measurements in IC 443, which find that (Snell et al., 2005) and (Hewitt et al., 2006).
6 Conclusions
OH excitation calculations show that for column densities in excess of 1017 , maser emission at 6049 MHz may take over the role of 1720 MHz masers in indicating a SNR – molecular cloud interaction. The OH column density typically produced in these interactions is uncertain, with densities of 1017 calculated from absorption measures in supernova remnants such as IC 443 (Hewitt et al., 2006). A survey of 35 supernova remnants, a star-forming region and four fields in the Large and Small Magellanic Clouds at 6049, 6030 and 6035 MHz was conducted using the Parkes Methanol Multibeam receiver on the Parkes radio telescope.
Eleven 6035 and three 6030 MHz OH masers associated with star-forming regions were detected. Two new 6035 MHz masers, one with associated 6030 MHz maser emission, were found. Where possible, magnetic fields were derived from the Zeeman splitting of the polarisations.
No 6049 MHz maser emission was detected in any of the fields to a 3- level of 0.3 – 0.6 Jy/beam. This places a limit on the column density of the OH in the supernova remnants.
For a typical supernova remnant such as G349.7+0.2, this limit is , indicating that if the column density of OH was above this value, 6049 MHz maser emission would have been observed. However, this conflicts with results obtained by Hewitt et al. (2008) that indicate that the column density is in sections of the remnant where 1720 MHz OH masers are found. Several explanations could account for this discrepancy, such as the filling factor accounting for the size of the maser spot compared to the beam being too high or the continuum temperature being more variable over the beam than anticipated, but are not likely. Another possibility is that the velocity coherence is too low under some conditions for the 6049 MHz OH masers to be produced, while still high enough for 1720 MHz OH masers to be produced.
Acknowledgments
We would like to thank Catherine Braiding for helping with the observing, Stacy Mader for observing assistance and help with data reduction, and James Caswell for assistance with maser identification.
References
- Barnes et al. (2001) Barnes D. G., et al., 2001, MNRAS, 322, 486
- Baudry et al. (1997) Baudry A., Desmurs J. F., Wilson T. L., Cohen R. J., 1997, A&A, 325, 255
- Brogan et al. (2004) Brogan C. L., Goss W. M., Lazendic J. S., Green A. J., 2004, AJ, 128, 700
- Bronfman et al. (1996) Bronfman L., Nyman L.-A., May J., 1996, A&AS, 115, 81
- Brown et al. (1982) Brown J. M., Schubert J. E., Evenson K. M., Radford H. E., 1982, ApJ, 258, 899
- Caswell (2001) Caswell J. L., 2001, MNRAS, 326, 805
- Caswell (2003) Caswell J. L., 2003, MNRAS, 341, 551
- Caswell & Vaile (1995) Caswell J. L., Vaile R. A., 1995, MNRAS, 273, 328
- Chevalier (1999) Chevalier R. A., 1999, ApJ, 511, 798
- Claussen et al. (1997) Claussen M. J., Frail D. A., Goss W. M., Gaume R. A., 1997, ApJ, 489, 143
- Cox et al. (1999) Cox D. P., Shelton R. L., Maciejewski W., Smith R. K., Plewa T., Pawl A., Różyczka M., 1999, ApJ, 524, 179
- Cui & Cox (1992) Cui W., Cox D. P., 1992, ApJ, 401, 206
- Davies (1974) Davies R. D., 1974, IAUS, 60, 275
- Destombes et al. (1977) Destombes J. L., Marliere C., Baudry A., Brillet J., 1977, A&A, 60, 55
- Dubner et al. (1999) Dubner G., Giacani E., Reynoso E., Goss W. M., Roth M., Green A., 1999, AJ, 118, 930
- Elitzur (1976) Elitzur M., 1976, ApJ, 203, 124
- Elitzur (1996) Elitzur M., 1996, ApJ, 457, 415
- Elitzur (1998) Elitzur M., 1998, ApJ, 504, 390
- Filipović et al. (2008) Filipović M. D., et al., 2008, A&A, 485, 63
- Fish et al. (2007) Fish V. L., Sjouwerman L. O., Pihlström Y. M., 2007, ApJ, 670, L117
- Forster & Caswell (2000) Forster J. R., Caswell J. L., 2000, ApJ, 530, 371
- Frail et al. (1994) Frail D. A., Goss W. M., Slysh, V. I., 1994, ApJ, 424, L111
- Frail et al. (1996) Frail D. A., Goss W. M., Reynoso E. M., Giacani E. B., Green A. J., Otrupcek R., 1996, AJ, 111, 1651
- Fukui et al. (2003) Fukui Y., et al., 2003, PASJ, 55, L61
- Goss & Robinson (1968) Goss W. M., Robinson B. J., 1968, ApL, 2, 81
- Gray et al. (1991) Gray M. D., Doel R. C., Field D., 1991, MNRAS, 252, 30
- Gray et al. (1992) Gray M. D., Field D., Doel R. C., 1992, A&A, 262, 555
- Green et al. (1997) Green A. J., Frail D. A., Goss W. M., Otrupcek R., 1997, AJ, 114, 2058
- Green & Dewdney (1992) Green D. A., Dewdney P. E., 1992, MNRAS, 254, 686
- Green et al. (2008) Green J. A., et al., 2008, MNRAS, 385, 948
- Greiner et al. (1994) Greiner J., Egger R., Aschenbach B., 1994, A&A, 286, L35
- Guilloteau et al. (1984) Guilloteau S., Baudry A., Walmsley C. M., Wilson T. L., Winnberg A., 1984, A&A, 131, 45
- Hewitt et al. (2006) Hewitt J. W., Yusef-Zadeh F., Wardle M., Roberts D. A., Kassim N. E., 2006, ApJ, 652, 1288
- Hewitt et al. (2008) Hewitt J. W., Yusef-Zadeh F., Wardle M., 2008, pre-print (arXiv:0802.3878)
- Hopkins et al. (2002) Hopkins A. M., Miller C. J., Connolly A. J., Genovese C., Nichol R. C., Wasserman L., 2002, AJ, 123, 1086
- Keohane et al. (2007) Keohane J. W., Reach W. T., Rho J., Jarrett T. H., 2007, ApJ, 654, 938
- Koo (1999) Koo B.-C., 1999, ApJ, 518, 760
- Koralesky et al. (1998) Koralesky B., Frail D. A., Goss W. M., Claussen M. J., Green A. J., 1998, AJ, 116, 1323
- Lazendic et al. (2004) Lazendic J. S., Wardle M., Whiteoak J. B., Burton M. G., Green A. J., 2004, pre-print (astro-ph/0409302)
- Lockett & Elitzur (1989) Lockett P., Elitzur M., 1989, ApJ, 344, 525
- Lockett et al. (1999) Lockett P., Gauthier E., Elitzur M., 1999, ApJ, 511, 235
- Lutz (1980) Lutz R. K., 1980, CompJ, 23, 262
- McDonnell et al. (2007) McDonnell K. E., Vaughan A. E., Wardle M., 2007, IAUS, 242, 232
- Miller et al. (2001) Miller C. J., et al., 2001, AJ, 122, 3492
- Oliva et al. (1989) Oliva, E., Moorwood, A. F. M., & Danziger, I. J. 1989, A&A, 214, 307
- Pankonin et al. (1979) Pankonin V., Payne H. E., Terzian Y., 1979, A&A, 75, 365
- Pavlakis & Kylafis (2000) Pavlakis K. G., Kylafis N. D., 2000, ApJ, 534, 770
- Pihlström et al. (2008) Pihlström Y. M., Fish V. L., Sjouwerman L. O., Zschaechner L. K., Lockett P. B., Elitzur M., 2008, ApJ, 676, 371
- Reach et al. (2006) Reach W. T., et al., 2006, AJ, 131, 1479
- Rho & Petre (1998) Rho J., Petre R., 1998, ApJ, 503, L167
- Roberts & Yusef-Zadeh (2005) Roberts D. A., Yusef-Zadeh F., 2005, AJ, 129, 805
- Routledge et al. (1991) Routledge D., Dewdney P. E., Landecker T. L., Vaneldik J. F., 1991, A&A, 247, 529
- Ruiz & May (1986) Ruiz M. T., May J., 1986, ApJ, 309, 667
- Safi-Harb et al. (2005) Safi-Harb S., Dubner G., Petre R., Holt S. S., Durouchoux P., 2005, ApJ, 618, 321
- Shelton et al. (1999) Shelton R. L., Cox D. P., Maciejewski W., Smith R. K., Plewa T., Pawl A., Różyczka M., 1999, ApJ, 524, 192
- Snell et al. (2005) Snell R. L., Hollenbach D., Howe J. E., Neufeld D. A., Kaufman M. J., Melnick G. J., Bergin E. A., Wang Z., 2005, ApJ, 620, 758
- Walborn & Blades (1987) Walborn N. R., Blades J. C., 1987, ApJ, 323, L65
- Wardle (1999) Wardle M., 1999, ApJ, 525, L101
- Wardle (2007) Wardle M., 2007, IAUS, 242, 336
- White & Long (1991) White R. L., Long K. S., 1991, ApJ, 373, 543
- Wootten (1981) Wootten A., 1981, ApJ, 245, 105
- Yusef-Zadeh et al. (1995) Yusef-Zadeh F., Uchida K. I., Roberts D., 1995, Sci, 270, 1801
- Yusef-Zadeh et al. (1996) Yusef-Zadeh F., Roberts D. A., Goss W. M., Frail D. A., Green A. J., 1996, ApJ, 466, L25
- Yusef-Zadeh et al. (1999) Yusef-Zadeh F., Goss W. M., Roberts D. A., Robinson B., Frail D. A., 1999, ApJ, 527, 172
- Yusef-Zadeh et al. (2003) Yusef-Zadeh F., Wardle M., Rho J., Sakano M., 2003, ApJ, 585, 319
- Zuckerman et al. (1972) Zuckerman B., Yen J. L., Gottlieb C. A., Palmer P., 1972, ApJ, 177, 59