Millimeter Imaging of HH 24 MMS: A Misaligned Protobinary System
Abstract
The HH 24 MMS protostellar system was observed in the 6.9 mm continuum with a high angular resolution (0.5′′). HH 24 MMS was resolved into two sources. The separation between sources 1 and 2 is 0.9′′ or 360 AU. The spectral energy distribution suggests that the 6.9 mm flux is almost entirely from dust. The 6.9 mm image and the spectrum suggest that HH 24 MMS may be a protostellar binary system. Total mass including the accretion disks and the inner protostellar envelope is 1.4 . Disk masses of sources 1 and 2 are 0.6 and 0.3 , respectively. Both sources are highly elongated. The difference in the position angle of the two disks is 45°, which means that HH 24 MMS is a highly misaligned protobinary system. The misalignment suggests that turbulent fragmentation may be the formation mechanism relevant to the binary systems with a separation of a few hundreds of AU, such as the HH 24 MMS system.
Subject headings:
accretion disks — binaries: general — ISM: individual (HH 24 MMS) — ISM: structure — stars: formation1. INTRODUCTION
Young stellar objects are often classified using the spectral energy distribution (SED; Lada 1987; André et al. 1993). Class 0 sources have cold spectra that peak in the submillimeter/far-IR band. Class 0 sources are interpreted as highly embedded protostars still in their main accretion phase (André & Montmerle 1994). A protostar is thought to contain a star-disk system surrounded by a collapsing envelope (e.g., Shu et al. 1987). It is important to understand the structure of Class 0 objects since they represent the earliest phase of star formation. However, it is not easy to study such systems owing to the high extinction in the optical or IR wavelength shorter than 20 m. Observations in the millimeter band provide us images of protostellar envelopes and deeply embedded accretion disks. High-resolution millimeter images often show that many Class 0 sources are multiple protostellar systems (Looney et al. 2000).
Many stars form as members of binaries or multiple systems (e.g., Duquennoy & Mayor 1991). The multiplicity of young pre-main-sequence stars is higher than or comparable to that of main-sequence stars (Duchêne et al. 2007), implying that multiple systems form through fragmentation of cores in the early stage of star formation. Several kinds of fragmentation mechanisms have been suggested, including rotational fragmentation, turbulent fragmentation, and disk fragmentation (Goodwin et al. 2007). Fragmentation of cloud cores has been investigated through numerical simulations in various situations including many kinds of physical and chemical effects, and it was found that most cores tend to fragment into multiple objects (see Goodwin et al. 2007 and references therein). While collapsing cores fragment easily, the relative importance of rotation and turbulence in star forming regions remains unresolved. Observations of Class 0 sources in the millimeter band can provide clues to the fragmentation mechanism.
HH 24 MMS is a Class 0 source located 20′′ southwest of the Herbig-Haro object HH 24A in the L1630 cloud (Chini et al. 1993; Ward-Thompson et al. 1995; Bontemps et al. 1996). It was detected in the 3.6 cm and 2.0 cm continuum by Bontemps et al. (1996). Chandler et al. (1995) suggested that the dust emission of HH 24 MMS originates from two components: an unresolved disk and an extended envelope. Bontemps et al. (1995) suggested that the 3.6 cm emission at the position of the submillimeter peak originated from thermal free-free emission, but later they found that the unresolved component of the centimeter continuum source has an SED consistent with the dust disk (Bontemps et al. 1996). Reipurth et al. (2002) imaged the 3.6 cm source with an angular resolution of 1′′. High-density molecular gas was detected in molecular lines (Gibb & Heaton 1993). Non-detection of X-rays from HH 24 MMS suggests that either HH 24 MMS may be very deeply embedded or HH 24 MMS does not have (proto)stellar flares to produce X-ray emission (Ozawa et al. 1999; Simon et al. 2004).
Despite the name, most Herbig-Haro objects in the HH 24 complex are unrelated to HH 24 MMS but belong to outflows driven by SSV 63 and its companions (Mundt et al. 1991; Davis et al. 1997). Near-IR observations revealed that HH 24 MMS is driving its own outflow or an “H2 jet” oriented in the northeast-southwest direction (Bontemps et al. 1996; Davis et al. 1997). Eislöffel & Mundt (1997) suggested that HH 24A and HH 24L may belong to the HH 24 MMS jet. This jet was also detected in the radio continuum and high-velocity CO gas (Bontemps et al. 1996).
| Peak Position | Peak Intensity | Source SizeaaParameters of the best-fit two-component elliptical Gaussian profile. Deconvolved size is in arcseconds, and position angle is in degrees. At 400 pc, the deconvolved sizes of sources 1 and 2 correspond to 290 AU 110 AU and 540 AU 70 AU, respectively. | Total FluxaaParameters of the best-fit two-component elliptical Gaussian profile. Deconvolved size is in arcseconds, and position angle is in degrees. At 400 pc, the deconvolved sizes of sources 1 and 2 correspond to 290 AU 110 AU and 540 AU 70 AU, respectively. | Mass | |||
|---|---|---|---|---|---|---|---|
| Source | (mJy beam-1) | FWHM | P.A. | (mJy) | () | ||
| 1 | 05 46 08.37 | –00 10 43.7 | 2.54 0.07 | 0.72 0.04 0.28 0.03 | 66 3 | 4.9 0.4 | 0.6 |
| 2 | 05 46 08.42 | –00 10 43.1 | 0.87 0.07 | 1.35 0.23 0.18 0.05 | 69 2 | 3.0 0.6 | 0.3 |
| 3 | 05 46 08.56 | –00 10 42.9 | 0.45 0.07 | unresolved | |||
Note. — Units of right ascension are hours, minutes, and seconds, and units of declination are degrees, arcminutes, and arcseconds. Source parameters are from the C-array uniform-weight map (Fig. 1). Fluxes were corrected for the primary beam response.
In this paper, we present high resolution images of the Class 0 protostar HH 24 MMS observed in the 6.9 mm continuum using the Very Large Array (VLA). In § 2 we describe our observations. In § 3 we report the results of the 6.9 mm imaging. In § 4 we discuss the physical properties of the dust continuum sources in the HH 24 MMS region.
2. OBSERVATIONS
The HH 24 MMS region was observed using the VLA of the National Radio Astronomy Observatory666The NRAO is a facility of the National Science Foundation operated under cooperative agreement by Associated Universities, Inc. in the standard -band continuum mode (43.3 GHz or = 6.9 mm) in two observing tracks. The phase and amplitude were determined by observing the nearby quasar 0532+075 (PMN J0532+0732). The phase tracking center was = 05h46m08.38s and = 00°10′43.36′′. The first track was carried out in the D-array configuration with twenty-five antennas on 2003 March 30. The flux density of 0532+075 was bootstrapped from the quasar 0542+498 (3C 147) assuming that its flux density is 0.72 Jy, which is the flux density measured within a day of our observations (VLA Calibrator Flux Density Database777See http://aips2.nrao.edu/vla/calflux.html.). The bootstrapped flux density of 0532+075 is 1.05 Jy. The second track was in the C-array configuration with twenty-three antennas on 2004 March 2. The flux calibration was done by observing the quasar 0713+438 (QSO B0710+439). The flux density of 0713+438 was set to 0.20 Jy, which is the flux measured within 2 days of our observations according to the VLA Calibrator Flux Density Database, and the bootstrapped flux density of 0532+075 is 0.70 Jy. Maps were made using a CLEAN algorithm.
3. RESULTS
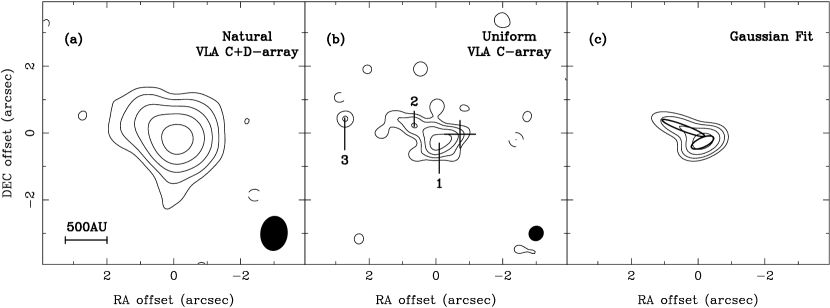
Figure 1 shows the map of the 6.9 mm continuum toward the HH 24 MMS region from the C- and the D-array data combined. The peak intensity is 5.66 mJy beam-1. HH 24 MMS was clearly detected and shows an extended structure.
Detailed structures of compact objects were revealed by imaging with the C-array data only (Fig. 1). HH 24 MMS was resolved into two objects, and another source was detected 3′′ east of HH 24 MMS. Their coordinates and peak intensities are listed in Table 1. Source 1, the brightest one, is near the 3.6 cm continuum source detected by Reipurth et al. (2002) and is elongated in the southeast-northwest direction. In contrast, source 2 is elongated in the northeast-southwest direction. The separation between sources 1 and 2 is 0.9′′ or 360 AU at a distance of 400 pc (Anthony-Twarog 1982).
Source 3 was detected over the detection limit of 0.4 mJy beam-1 (S/N = 6) in the C-array map (Fig. 1), and it can also be seen in the C and D-array map (Fig. 1) as a weak peak. Source 3 is unresolved. Since it was not detected in other wavelengths, the nature of source 3 is unclear.
3.1. Spectral Energy Distribution and Mass
In low-mass star forming regions, continuum emission in the centimeter-millimeter band is usually either free-free radiation from hot ionized gas or thermal radiation from cold dust, or a combination of both. The free-free emission usually has a small (1) spectral index, while the dust emission has a large (2) spectral index (Reynolds 1986; Anglada et al. 1998). The SED was examined to investigate the emission mechanism of HH 24 MMS. Since sources 1 and 2 are resolved in the 6.9 mm band only, SED of the whole HH 24 MMS system was constructed. The total flux of the HH 24 MMS system, measured in a 4′′ 4′′ box, is 12.0 0.5 mJy (from the map shown in Fig. 1), and the SED in the wavelength range of 3.6 cm to 3.4 mm is shown in Figure 2.
We first tried to fit the SED of HH 24 MMS as a sum of two power-law components, one from the free-free emission and the other from the dust emission, over the wavelength range of 3.4 mm to 3.6 cm (8.3–88 GHz). The best fit has spectral indices of 2.1 0.3 and 3.7 0.2 (Fig. 2 left panel). It was found that acceptable fits can only have large (2) spectral indices for both components, which clearly means that the emission is mostly from dust and that the free-free emission is negligible in the wavelength range considered.
Then, as the dust emission seems to be dominating even in the centimeter wavelengths, the SED was fitted again with a single-component power-law distribution. The fits were made using three data points, excluding the 3.6 cm data, to avoid any contribution from free-free emission. The best fit has a spectral index of = 2.8 0.2 in the millimeter range (Fig. 2 right panel).
Extrapolating the best-fit SED to longer wavelengths, a substantial fraction (90%) of the 3.6 cm flux seems to come from the dust emission. Therefore, the free-free emission, if any, must be very weak. If 10% of the 3.6 cm flux comes from optically thin free-free emission, its contribution to the 6.9 mm flux would be only 0.2% (or 0.02 mJy). That is, the 6.9 mm flux of HH 24 MMS is almost entirely from dust.
As the millimeter continuum flux is mostly from dust, the mass of the emission structure can be estimated from the SED. To derive the mass from the dust continuum flux, the mass opacity given by Beckwith & Sargent (1991) is assumed,
| (1) |
where is the frequency, = 1200 GHz, and is the opacity index. This opacity is for total mass of gas and dust. The opacity index of HH 24 MMS is . This small value of implies the presence of large dust grains probably caused by the grain growth in the high density environment (e.g., Miyake & Nakagawa 1993), which was pointed out by several authors previously (Chandler et al. 1995; Ward-Thompson et al. 1995).
The dust temperature, , used in previous works ranges from 12 K to 100 K (Phillips et al. 2001; Chandler et al. 1995). Here we adopt = 20 5 K from Ward-Thompson et al. (1995). In the 6.9 mm maps, the peak brightness temperature is about 8 K, and the mean brightness temperature in a 4′′ 4′′ box is less than 1 K. Since the brightness temperature is much lower than the dust temperature, the optical depth of the 6.9 mm continuum emission must be small. Assuming optically thin emission, the mass can be estimated by
| (2) |
where is the flux density, is the distance to the source, and is the Planck function. Assuming = 400 pc, the total mass is 1.4 , which is consistent with the mass estimate of Chandler et al. (1995). This mass includes both the accretion disk(s) and the inner protostellar envelope.

4. DISCUSSION
4.1. Decomposition of the HH 24 MMS System
At the first glance of the 6.9 mm maps, the HH 24 MMS system appears like a combination of a protostar (source 1) and an outflow (source 2). However, the SED shows that, for both sources 1 and 2, the 6.9 mm flux is mostly from dust. Especially, the 6.9 mm flux of source 2 must be entirely from dust because the 3.6 cm source is not associated with source 2 (Fig. 1). That is, it is very unlikely that source 2 is a thermal jet.
Since both sources are extended and partially overlapping, a simple two-component fitting to the image was done to decompose the system. The image was fitted with a sum of two elliptical Gaussian distributions. Only the pixels around source 1 and 2 with intensities above 0.3 mJy beam-1 were considered for the fit, and source 3 was ignored. Table 1 lists the parameters of the best-fit Gaussian profiles, and Figure 1 shows the best-fit intensity distribution, which agrees with the observed image within three times the rms noise. The total flux of the two-component Gaussian profile also agrees with that of the real image within 0.1 mJy.
There is a bipolar jet seen in H2 emission in the HH 24 MMS region with the axis in the northeast-southwest direction (Bontemps et al. 1996). The near-IR H2 map of Davis et al. (1997) shows that HH 24 MMS is almost certainly the driving source of this outflow. The position angle of these H2 knots (NE 1, NE 2, and SW 2) with respect to HH 24 MMS is 32° 6°, which is perpendicular to the elongation of source 1. Therefore, source 1 seems to be the driving source of the bipolar outflow.
The peak position of the 3.6 cm source (Reipurth et al. 2002) does not exactly coincide with the position of source 1 (Fig. 1). The position displacement is about 0.7′′. Since the 3.6 cm source is weak and extended (1′′), it is not clear that the displacement is significant. In this paper we assume that the 3.6 cm source is identical to or closely associated with source 1, but we cannot rule out the possibility that the 3.6 cm source indicates the existence of yet another young stellar object. This issue should be resolved by more sensitive observations of the centimeter continuum in the future.
For source 2, three kinds of interpretation are possible. (1) Source 2 is another protostar with a projected separation of 360 AU from source 1. (2) Source 2 is a clump of dust swept and heated by the outflow. (3) Source 2 has multiple clumps in the dense envelope as seen in other protostars such as NGC 1333 IRAS 4B (Looney et al. 2000). The first possibility seems to be the simplest explanation. The second possibility is rather unlikely because the position angle of the elongation of source 2 (69°) is different from the direction of the outflow by 40°. In addition, the mass of source 2 seems too large for a clump around outflow. The third possibility can only be tested by imaging with a higher resolution, but it is rather peculiar that only one side of the envelope has dense clumps. Therefore, we prefer the interpretation that HH 24 MMS may be a protostellar binary system, and we will adopt this interpretation in the following discussions.
The separation between sources 1 and 2 is within the range of the expected separation of young binaries. In a few examples of well-studied Class 0 protostars, observations and modeling suggest that the centrifugal radius ranges from 34 AU to 600 AU (see Myers et al. 2000 and references therein). Reipurth et al. (2004) carried out a radio-continuum survey of embedded objects with distances between 140 and 800 pc and found many binaries with separations ranging from 0.5′′ to 12′′. Many numerical simulations of core fragmentation produce multiple systems with separations of a few hundreds of AU (Goodwin et al. 2007).
Both components of HH 24 MMS are highly elongated, with axial ratios of 3 for source 1 and 8 for source 2, which suggests that each of them may be a disk-like flattened structure viewed nearly edge-on. The size of each component is somewhat larger than the expected size of an accretion disk supported by Keplerian rotation (100 AU), and each of the 6.9 mm continuum sources may consist of a compact accretion disk surrounded by a flattened inner envelope or a pseudodisk (a contracting disk-like structure that is not completely supported by rotation; Galli & Shu 1993; Tomisaka 2002; Allen et al. 2003). Assuming that the dust properties of each source are not very different from the overall dust properties of the HH 24 MMS system, the mass can be derived from the flux of each source (Table 1).
4.2. Misaligned Disks
The majority of stars belong to multiple-star systems (Duquennoy & Mayor 1991), and understanding of star formation cannot be complete without knowing the physical processes in multiple-protostar systems (Tohline 2002). Study of the protobinary in the earliest evolutionary stage is essential in understanding how the fragmentation occurs and what is the initial condition of the binary evolution. There are two main mechanisms for fragmentation: (1) rotational fragmentation and (2) turbulent fragmentation (Goodwin et al. 2007). The outcome of these two mechanisms can be quite different. The former occurs when the kinematics of the initial core is dominated by systematic rotation, and the resulting binary would be well-ordered, i.e., disks would be well-aligned. In contrast, the latter occurs when the core is dominated by random motions, and the resulting binary is likely to have misaligned disks. Therefore, the alignment of disks is one of the key observational measures that can provide strong constraints on the fragmentation mechanism.
In principle, multiple outflows can give some implications on the degree of binary disk alignment because outflows are ejected perpendicular to the circumstellar disks. There are some examples of misaligned systems inferred from jets emanating with different position angles (Gredel & Reipurth 1993; Reipurth et al. 1993). However, this method is problematic because two well-aligned outflows would be misidentified as a single outflow. The best way to test the disk alignment may be the direct imaging of both disks.
If HH 24 MMS is a binary system as discussed in the previous section, it is one of the rare examples of protobinary system imaged with an angular resolution high enough to investigate the degree of alignment. Each source may consist of a compact accretion disk surrounded by a pseudodisk, and the axis of the accretion disk is very likely to be parallel to the axis of the pseudodisk around it. Then the axis direction of the accretion disk can be inferred from the minor axis of the elliptical fit to the 6.9 mm source.
The major axes of the two components of the HH 24 MMS system are not aligned at all. The difference in the position angle between the binary components, from the Gaussian fit (Table 1), is 45° (or 135° if they are retrograde). HH 24 MMS makes a stark contrast to the other known example of resolved binary disks, L1551 IRS 5. In the L1551 IRS 5 system, the two disks are very well aligned (Rodríguez et al. 1998). The difference between the two systems is probably owing to the binary separation: 360 AU in HH 24 MMS and 45 AU in L1551 IRS 5. In the classification scheme of multiple young stellar objects suggested by Looney et al. (2000), HH 24 MMS belongs to the common-envelope type while L1551 IRS 5 belongs to the common-disk type. We speculate that the rotational fragmentation is important in close binaries and the turbulent fragmentation is important in wide binaries, though more examples are certainly needed to draw a statistically significant conclusion. Other examples may include IRAS 16293–2422 and NGC 1333 IRAS 4A (Looney et al. 2000), but their structures are complicated and their disk orientations are less obvious.
Though studies through direct imaging is difficult, indirect evidences show that misaligned systems are not necessarily unusual. High-resolution near-IR polarimetry revealed plenty of examples of misaligned binaries in the Class II phase (Monin et al. 2007). Disks in T Tauri binaries are not perfectly coplanar (Jensen et al. 2004), and the relative alignment of the disks may decrease after formation (Bate et al. 2000). Therefore, HH 24 MMS can be considered as a precursor of such misaligned T Tauri systems. As HH 24 MMS is a rare example of a wide binary that can be imaged well enough to study the disk alignment, this system gives us a chance to examine the initial conditions of binary evolution.
References
- (1) Allen, A., Li, Z.-Y., & Shu, F. H. 2003, ApJ, 599, 363
- (2) André, P., & Montmerle, T. 1994, ApJ, 420, 837
- (3) André, P., Ward-Thompson, D., & Barsony, M. 1993, ApJ, 406, 122
- (4) Anglada, G., Villuendas, E., Estalella, R., Beltrán, M. T., Rodríguez, L. F., Torrelles, J. M., & Curiel, S. 1998, AJ, 116, 2953
- (5) Anthony-Twarog, B. J. 1982, AJ, 87, 1213
- (6) Bate, M. R., Bonnell, I. A., Clarke, C. J., Lubow, S. H., Ogilvie, G. I., Pringle, J. E., & Tout, C. A. 2000, MNRAS, 317, 773
- (7) Beckwith, S. V. W., & Sargent, A. I. 1991, ApJ, 381, 250
- (8) Bontemps, S., André, P., & Ward-Thompson, D. 1995, A&A, 297, 98
- (9) Bontemps, S., Ward-Thompson, D., & André, P. 1996, A&A, 314, 477
- (10) Chandler, C. J., Koerner, D. W., Sargent, A. I., & Wood, D. O. S. 1995, ApJ, 449, L139
- (11) Chini, R., Krügel, E., Haslam, C. G. T., Kreysa, E., Lemke, R., Reipurth, B., Sievers, A., & Ward-Thompson, D. 1993, A&A, 272, L5
- (12) Davis, C. J., Ray, T. P., Eislöffel, J., & Corcoran, D. 1997, A&A, 324, 263
- (13) Duchêne, G., Delgado-Donate, E., Haisch, K. E., Jr., Loinard, L., & Rodríguez, L. F. 2007, in Protostars and Planets V, ed. B. Reipurth, D. Jewitt, & K. Keil (Tucson: Univ. Arizona Press), 379
- (14) Duquennoy, A., & Mayor, M. 1991, A&A, 248, 485
- (15) Eislöffel, J., & Mundt, R. 1997, AJ, 114, 280
- (16) Galli, D., & Shu, F. H. 1993, ApJ, 417, 220
- (17) Gibb, A. G., & Heaton, B. D. 1993, A&A, 276, 511
- (18) Goodwin, S. P., Kroupa, P., Goodman, A., & Burkert, A. 2007, in Protostars and Planets V, ed. B. Reipurth, D. Jewitt, & K. Keil (Tucson: Univ. Arizona Press), 133
- (19) Gredel, R., & Reipurth, B. 1993, ApJ, 407, 29
- (20) Jensen, E. L. N., Mathieu, R. D., Donar, A. X., & Dullighan, A. 2004, ApJ, 600, 789
- (21) Lada, C. J. 1987, in IAU Symp. 115, Star Forming Regions, ed. M. Peimbert & J. Jugaku (Dordrecht: Kluwer), 1
- (22) Looney, L. W., Mundy, L. G., & Welch, W. J. 2000, ApJ, 529, 477
- (23) Miyake, K., & Nakagawa, Y. 1993, Icarus, 106, 20
- (24) Monin, J.-L., Clarke, C. J., Prato, L., & McCabe, C. 2007, in Protostars and Planets V, ed. B. Reipurth, D. Jewitt, & K. Keil (Tucson: Univ. Arizona Press), 395
- (25) Mundt, R., Ray, T. P., & Raga, A. C. 1991, A&A, 252, 740
- (26) Myers, P. C., Evans, N. J., II, & Ohashi, N. 2000, in Protostars and Planets IV, ed. V. Mannings, A. P. Boss, & S. S. Russell (Tucson: Univ. Arizona Press), 217
- (27) Ozawa, H., Nagase, F., Ueda, Y., Dotani, T., & Ishida, M. 1999, ApJ, 523, L81
- (28) Phillips, R. R., Gibb, A. G., & Little, L. T. 2001, MNRAS, 326, 927
- (29) Reipurth, B., Heathcote, S., Roth, M., Noriega-Crespo, A., & Raga, A. C. 1993, ApJ, 408, 49
- (30) Reipurth, B., Rodríguez, L. F., Anglada, G., & Bally, J. 2002, AJ, 124, 1045
- (31) Reipurth, B., Rodríguez, L. F., Anglada, G., & Bally, J. 2004, AJ, 127, 1736
- (32) Reynolds, S. P. 1986, ApJ, 304, 713
- (33) Rodríguez, L. F., et al. 1998, Nature, 395, 355
- (34) Shu, F. H., Adams, F. C., & Lizano, S. 1987, ARA&A, 25, 23
- (35) Simon, T., Andrews, S. M., Rayner, J. T., & Drake, S. A. 2004, ApJ, 611, 940
- (36) Tohline, J. E. 2002, ARA&A, 40, 349
- (37) Tomisaka, K. 2002, ApJ, 575, 306
- (38) Ward-Thompson, D., Chini, R., Krügel, E., André, P., & Bontemps, S. 1995, MNRAS, 274, 1219