Intrinsic room temperature ferromagnetism in Co-implanted ZnO
Abstract
We report on the structural and magnetic properties of a cobalt-implanted ZnO film grown on a sapphire substrate. X-ray diffraction and transmission electron microscopy reveal the presence of a (101̄0)-oriented hexagonal Co phase in the Al2O3 sapphire substrate, but not in the ZnO film. Co clusters, with a diameter of is about 5-6 nm, form a Co rich layer in the substrate close to the ZnO/Al2O3 interface. Magnetization measurements indicate that there exist two different magnetic phases in the implanted region. One originates from the Co clusters in Al2O3, the other one belongs to a homogeneous ferromagnetic phase with a ferromagnetic Curie temperature far above room temperature and can be attributed to Co substitution on Zn sites in the ZnO layer. We have observed magnetic dichroism at the Co and O K edges at room temperature as well as the multiplet structure in x-ray absorption spectra around the Co edge, supporting the intrinsic nature of the observed ferromagnetism in Co-implanted ZnO film. The magnetic moment per substituted cobalt is found about 2.81 which is very close to the theoretical expected value of 3 for Co 2+ in its high spin state.
pacs:
85.75.-d, 75.50.Pp, 61.72.U-I Introduction
Spintronics, a short notation for spin-based electronics, is a new research area which tries to exploit the spin of electrons in addition to their charge in semiconductor devices. The basic idea is to combine the characteristics of existing magnetic devices with semiconductor devices in order to realize a new generation of devices that are smaller, energy efficient, and faster than presently available. Feynman (1986); Datta and Das (1990); Prinz (1998); Ohno et al. (1998); Oestreich (1999); Ohno et al. (1999); Wolf et al. (2001); Sarma (2001); Jonker et al. (2001) The key requirement in the development of such devices is an efficient injection, transfer and detection of spin-polarized currents. Due to the well known problem of resistance mismatch at metal/semiconductor interfaces, hindering an effective spin injection, Schmidt et al. (2000) much interest is now concentrating on the development of room-temperature ferromagnetic semiconductors.
Diluted magnetic semiconductors (DMS) refer to the fact that some fraction of atoms in a non-magnetic semiconductor is replaced by magnetic ions. DMS are promising candidates for spintronic applications at ambient temperatures, provided that their Curie temperature (TC) is far enough above room temperature. Therefore, a number of different semiconductor hosts have been investigated to test their magnetic properties. In the past most attention has been paid to (Ga, Mn)As Ohno et al. (1996); Ando et al. (1998); Beschoten et al. (1999); Grandidier et al. (2000); Sadowski et al. (2001); Potashnik et al. (2001); Schott et al. (2001) and (In, Mn)As Munekata et al. (1989, 1993); Soo et al. (1996); Koshihara et al. (1997); Akai (1998); Oiwa et al. (2001) DMS systems. However their reported highest Curie temperatures are only around 170 K for (Ga, Mn)As Ohno (1998, 2000) and 35 K for (In, Mn)As. Ohno (2000); Ohno et al. (2002) Therefore, there is a large incentive for developing new DMS materials with much higher Curie temperatures. In particular, the calculations of Dietl et al. Dietl et al. (2000) were the first to indicate that Mn-doped ZnO could exhibit ferromagnetism above room temperature. Later, Sato et al. have also investigated ZnO-based DMS by ab initio electronic structure calculations and reported ferromagnetic ordering of 3d transition metal ions in ZnO. Sato and Katayama-Yoshida (2000, 2001) These theoretical predictions initiated an outburst of experimental activities of TM-doped ZnO. Ueda et al. (2001); Pearton et al. (2003); Prellier et al. (2003); Tuan et al. (2004); Pearton et al. (2004a, b); Liu et al. (2005); Janisch et al. (2005); Liu et al. (2006); Pacuski et al. (2006); Zhang et al. (2007); Behan et al. (2008) Actually, some of these studies indeed claim ferromagnetic signals above room temperature. However, the origin of ferromagnetism in this system is still under debate. The main unresolved question is whether the observed ferromagnetism originates from uniformly distributed TM elements in the ZnO host matrix or whether it is due to the precipitation of metallic ferromagnetic clusters. Only a detailed analysis of the magnetic properties by using a combination of powerful material characterization techniques might help to unravel the origin of ferromagnetism in doped ZnO.
The main aim of the present article is to present a corresponding detailed study of the structural and magnetic properties of a Co-implanted ZnO film grown on a sapphire substrate. Rutherford backscattering spectroscopy (RBS), X-ray diffraction (XRD), and high resolution transmission electron microscopy (TEM) techniques were used to determine the depth distribution of the implanted cobalt ions and to detect the formation of possible secondary phases such as metallic cobalt clusters in the implanted region. To determine whether the implanted cobalt ions are in the Co2+ oxidation state or exhibit pure metallic behavior, x-ray absorption spectroscopy (XAS) experiments were also performed. The magnetic properties were characterized by using the magneto-optical Kerr effect (MOKE), a superconducting quantum interference device (SQUID) magnetometer, as well as x-ray resonant magnetic scattering (XRMS) techniques.
II Sample Preparation
About 350 Å thick ZnO film were grown on mm2 epi-polished single-crystalline Al2O3 () substrate by RF (13.56 MHz) sputtering of a ZnO target.Ay et al. (2003) The sputtering was carried out in an atmosphere of mbar pure Ar () with a substrate temperature of . In order to increase the quality of ZnO film, we have carried out post-growth annealing in an oxygen atmosphere with a partial pressure of up to 2000 mbar and a temperature of . After annealing, the ZnO sample was implanted in the ILU-3 ion accelerator (Kazan Physical-Technical Institute of Russian Academy of Science) by using 40 keV Co+ ions with an ion current density of . The sample holder was cooled by flowing water during the implantation to prevent the sample from overheating. The implantation dose was .
III Experimental Results
III.1 Structural Properties
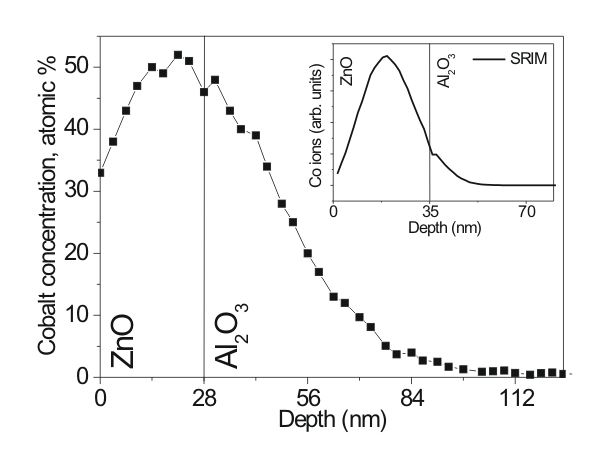
The depth dependence of the cobalt concentration in Co-implanted ZnO/Al2O3 film was investigated using RBS technique at the Dynamic Tandem Laboratory (DTL) at Ruhr-Universität Bochum. The RBS data shows both a maximum of cobalt concentration (about 50 at.%) located close to the ZnO/Al2O3 interface and an extended inward tail due to cobalt diffusion into the volume of the Al2O3 substrate (Fig. 1). It is also observed that after ion implantation the thickness of the ZnO layer has decreased from originally 35 nm to 28 nm. According to the SRIM algorithm,Ziegler et al. (1985) the average implanted depth of 40 keV Co ions in ZnO/Al2O3 is about 20.4 nm with a straggling of 9.6 nm in the Gaussian-like depth distribution (inset in Fig. 1). However, because of the surface sputtering, ion mixing and heating of the implanted region by the ion beam, there is a redistribution of the implanted cobalt compared to the calculated profile.
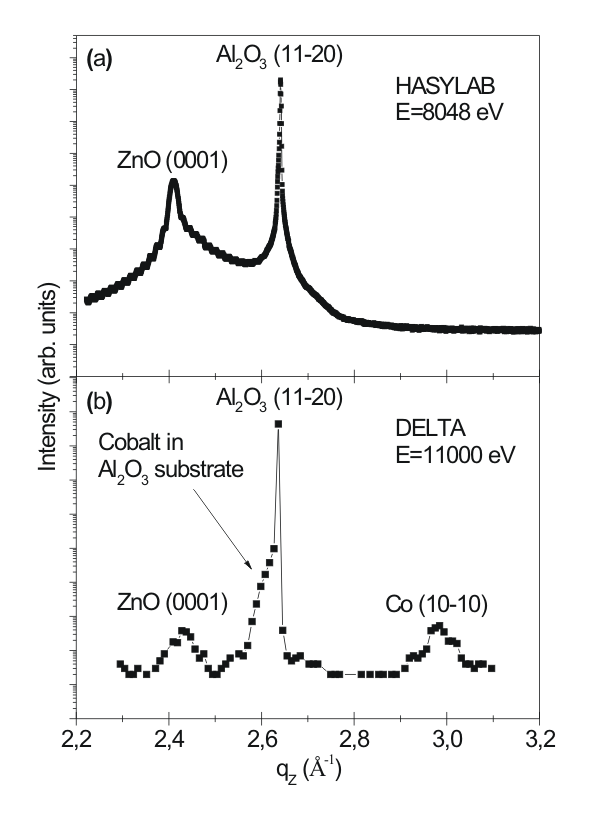
The high-angle XRD experiments provide information on the structural coherence of the films and in our case also give us a chance to detect possible additional phases in the sample after ion implantation. Fig. 2 shows a high angle Bragg scans of the ZnO film before (a) and after (b) cobalt implantation. The data were taken using synchrotron radiation at the ”Hamburg Synchrotron Radiation Laboratory” (HASYLAB) (Fig. 2(a)) and at the ”Dortmund Electron Accelerator” (DELTA) (Fig. 2(b)) with an energy of E=8048 eV and E=11000 eV, respectively. X-ray diffraction measurements yielded evidence for the () reflection of the Co hcp structure as is clearly seen on the right side of the sapphire substrate peak (Fig. 2(b)). The heavy ion bombarding also causes a reduction of intensity of the ZnO (0001) peak. In addition to this, after implantation we observed that the ZnO (0001) peak is shifted to higher angles. This is due to the shrinking of the ZnO lattice caused by the substitution of cobalt ions in the ZnO matrix. After implantation a tail (shown by an arrow in Fig. 2) appears around the main peak of Al2O3 () reflection which is not observed before implantation. This tail likely reflects the lattice expansion of the sapphire substrate upon Co implantation.
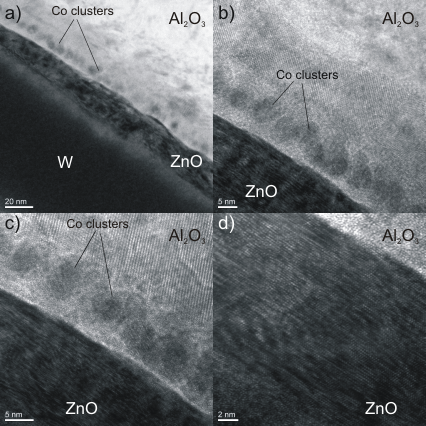
In order to further investigate both the presence of metallic cobalt clusters and the damage of the sapphire substrate, high resolution cross sectional TEM measurements were performed. The sample preparation for TEM measurements is done by using focused ion beam (FIB) technique. To prevent charging effects, the sample surface was covered by a tungsten (W) film and then a very small cross sectional piece of the implanted sample was cut by using FIB. Fig. 3 presents TEM images of the ZnO sample with an increasing magnification from 20 nm to 2 nm. In the first image (Fig. 3(a)), a general overview of the ZnO/Al2O3 sample is shown. The cobalt clusters can be seen in the sapphire substrate located close to the ZnO/Al2O3 interface. The clusters most likely form because of a segregation of Co in the Al2O3 substrate. Clustering occurs in a Al2O3 at an annealing temperature of .Morawe and Zabel (1995) Thus, obviously ion bombardment heats up the sample locally to this temperature. Fig. 3(b) and (c) focuses on the ZnO/Al2O3 interface. These images reveal that the cobalt clusters have a size of about 5-6 nm and that they nearly touch each other. Further information from these images is the deformation of the Al2O3 crystal structure close to the ZnO/Al2O3 interface. This results in a lattice expansion of the substrate which is in agreement with the XRD results shown in Fig. 2. However, far from the interface the structure of Al2O3 is preserved and one can see nicely the atomic rows of Al2O3 presented in Fig. 3(c). Fig. 3(d) shows the ZnO layer with a magnification of 2 nm. Even after heavily ion bombardment, ZnO still has a good arrangement of atomic rows. Moreover, any distinct clusters cannot be observed in this region.
III.2 Magnetic Properties
III.2.1 MOKE and SQUID measurements
Next we discuss the magnetic properties of the Co-implanted ZnO film. In Fig. 4(a) we show the hysteresis loop of Co-doped ZnO film. This hysteresis was recorded at room temperature using a high-resolution MOKE setup Zeidler et al. (1996); Schmitte (2002); Westphalen (2007) in the longitudinal configuration with s-polarized light. The MOKE data clearly indicate that after cobalt implantation, non-magnetic ZnO becomes ferromagnetic at room temperature with a large remanent magnetization.
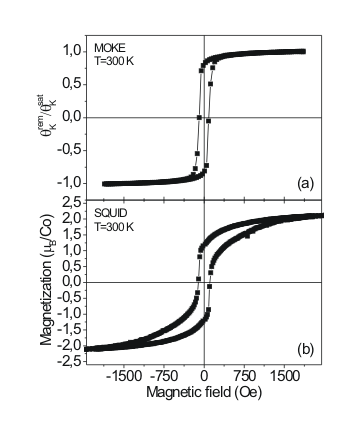
Since the MOKE technique is only sensitive to the magnetization of thin layers close to the surface (20-30 nm penetration depth), measurements have also been carried out using a Quantum Design MPMS XL SQUID magnetometer. Fig. 4(b) presents the SQUID hysteresis loop of the sample after subtraction of a diamagnetic contribution from the sapphire substrate. The coercive field of this hysteresis is more or less the same as the one measured by MOKE technique. However, some additional contributions appear and the magnetization saturates at considerably higher fields.
III.2.2 XRMS and XAS measurements
In order to study in detail the observed ferromagnetic behavior, the magnetic properties of the Co-implanted ZnO film were investigated using the XRMS and XAS techniques.
XRMS has proven to be a highly effective method for the analysis of the magnetic properties of buried layers and interfaces, including their depth dependence. Tonnerre et al. (1995); van der Laan (2006) Moreover, if the photon energy is fixed close to the energy of the corresponding absorption edges, element specific hysteresis loops can be measured. Kortright et al. (2003) Since there are three elements in the Co-doped ZnO film, the analysis can be carried out separately for Co, O and Zn.
The XRMS experiments were performed using the ALICE diffractometer Grabis et al. (2003) at the undulator beamline UE56/1-PGM at BESSY II (Berlin, Germany). The diffractometer comprises a two-circle goniometer and works in horizontal scattering geometry. A magnetic field can be applied in the scattering plane along the sample surface either parallel or antiparallel to the photon helicity, which corresponds to the longitudinal magneto-optical Kerr effect (L-MOKE) geometry. The maximum field of was high enough to fully saturate the sample. The magnetic contribution to the scattered intensity was always measured by reversing the magnetic field at fixed photon helicity.
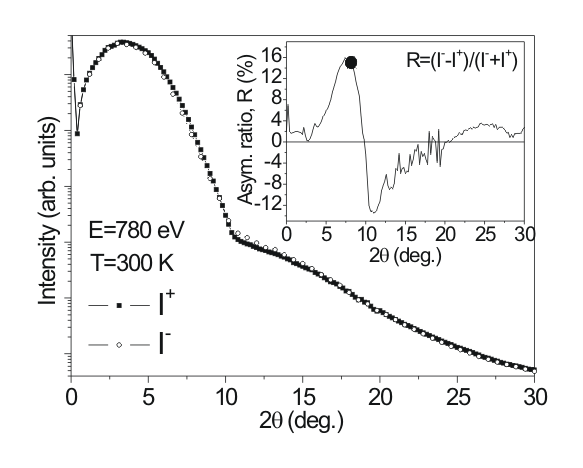
Fig. 5 shows the specular reflectivities measured at the Co edge (E=780 eV) in magnetic saturation. The measurements were taken at room temperature and with a magnetic field applied in the sample plane parallel (, solid line) and antiparallel (, open circles) to the photon helicity. Due to the high surface roughness no Kiessing fringes are observed in the reflectivity curves. Nevertheless, the splitting of the two curves is clearly seen in Fig. 5. The inset in Fig. 5 presents the angular dependence of the asymmetry ratio () to show how the magnetic signal varies. As a compromise between high scattering intensity and high magnetic sensitivity for the investigation of the magnetic properties at the Co L edges, the scattering angle was fixed at the position of (the angle of incidence ), shown by a black circle in the inset in Fig. 5. For measurements at the O K edge (E530 eV) the scattering angle was fixed at , which corresponds to the same scattering vector in the reciprocal space.
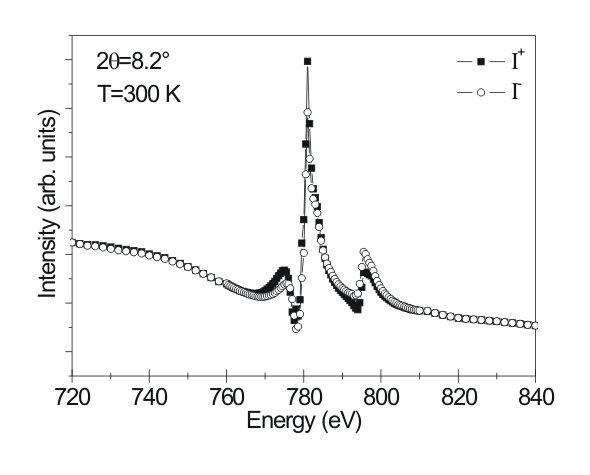
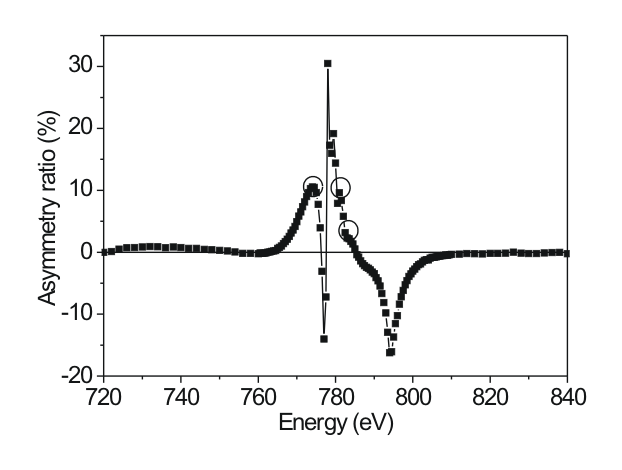
The energy dependence of the scattered intensity around the Co edges measured in positive (solid line) and negative (open circles) saturation fields is shown in Fig. 6. Since the magnetic contribution to the resonant scattering can best be visualized by plotting the asymmetry ratio, in Fig. 7 we present the asymmetry ratio at the Co edges. The asymmetry ratio shows a strong ferromagnetic signal of up to 30 %. The fine structure of the Co peak in Fig. 6 is typical for oxidized cobalt which has been observed before for CoO by Regan et al. Regan et al. (2001) They also showed that in the case of metallic cobalt the Co peak consists of mainly one single component.
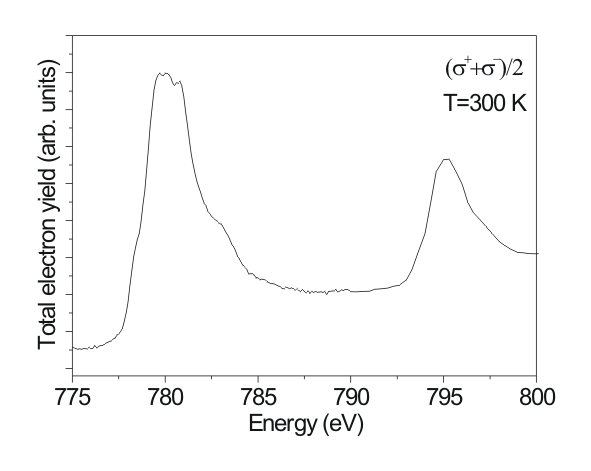
Recently, Kobayashi et al. Kobayashi et al. (2005) reported that for a Co2+ oxidation state in ZnO, the XAS spectra exhibits a multiplet fine structure around the Co L3 edge. To check whether this behavior is also present in our sample, XAS experiments were carried out at the undulator beamline UE52-SGM at BESSY II using the ALICE diffractometer. The absorption data were taken by the total electron yield (TEY) method, i.e. by measuring the sample drain current. Since the excited electron trajectories are affected by the external magnetic field, the XAS spectra were taken with fixed photon helicity at remanence. The angle of incidence was chosen to be with respect to the surface. The spectra were normalized to the incoming photon flux. Fig. 8 shows the averaged x-ray absorption spectra (+)/2 at the Co edges. The XAS spectrum clearly shows a multiplet structure at the edge which is similar to that observed before for Co-doped ZnO by Kobayashi et al. This multiplet structure is a clear indication of the presence of oxidized cobalt in this sample.
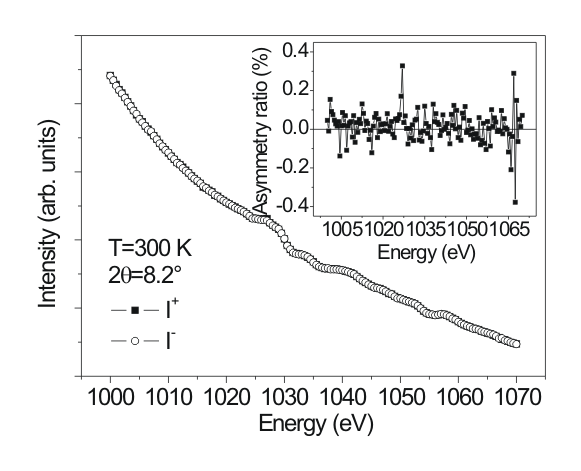
The magnetic signal around the Zn (E=1021.8 eV) and the O K edges were also investigated. Within the sensitivity limit no magnetic signal could be recorded for Zn (Fig. 9). However, a clear magnetic signal was observed at the O K edge. The asymmetry ratio measured at the O K edge is presented in Fig. 10. Note that the maximum in the asymmetry ratio of oxygen is much smaller (by roughly a factor of fifty) than the asymmetry ratio of cobalt shown in Fig. 7.

In Fig. 11 we compare the magnetic hysteresis curves recorded at the Co (773.4 eV) and O K (526.8 eV) edges. The shape and the coercive field of the hysteresis curves are the same, but the intensity is much lower for the O K edge. This is a clear indication for a spin polarization of oxygen atoms in the ZnO host matrix.

Since an additional magnetic contribution is observed in the SQUID hysteresis curve (Fig. 4(b)), it was checked by using XRMS technique whether this feature becomes also visible. For this reason, several hysteresis loops were recorded at different photon energies and a systematic change of the hysteresis loop shape was observed with changing photon energy. Here, only three hysteresis curves shown by open red circles in Fig. 7 are presented. The shape of the hysteresis curve taken at 773.4 eV (closed symbols in Fig. 11) is practically the same as the one measured by MOKE (Fig. 4(a)). However, when the incoming photon energy is increased to 781 eV and 783 eV, two different hysteresis loops are observed. Fig. 12(a) presents the hysteresis curve recorded at 781 eV. At this energy the hysteresis curve has two components one with a small and one with a large coercive field and it is similar to the SQUID hysteresis (Fig. 4(b)). At higher energies the low coercive field component vanishes and at the energy of 783 eV (Fig. 12(b)) the hysteresis curve consists of practically only one component with the large coercive field. This large coercive field component originates from the strong interaction between cobalt clusters in the sapphire substrate and it is present even at room temperature.

The reason for the observation of different hysteresis curves using XRMS technique can be interpreted by the change of the optical parameters as a function of incident photon energy. Depending on the energy deviation from the resonance condition, both types of magnetic hysteresis can be detected. For an energy of 773.4 eV, which is very close to the resonance energy, the contribution to the scattering intensity from the phase with the large coercive field vanishes, resulting in a hysteresis loop (closed symbols in Fig. 11) which is similar to the one measured by MOKE (Fig. 4(a)). However, at the photon energy of 781 eV , at the resonance condition, both phases contribute to the scattering intensity. The hysteresis taken at this energy (Fig. 12(a)) presents the superposition of two phases of cobalt in the host material and it is similar to the hysteresis measured with the SQUID magnetometer (Fig. 4(b)). The hysteresis loop recorded at the energy of 783 eV (Fig. 12(b)) is representative for the metallic phase of cobalt in Al2O3 with a large coercive field, whereas at this energy the contribution to the scattering intensity from the small coercive field component nearly vanishes.
III.2.3 Magnetic moment per substituted Co atom and estimation for TC
To calculate the magnetic moment per substituted Co atom we used the RBS data and SQUID hysteresis presented in Figs. 1 and 4. First we determined the percentage of cobalt atoms located within ZnO layer from the RBS data. Integrating the area under the curve in Fig. 1, we estimate that 48.5 per cent of the implanted cobalt atoms are contained inside the ZnO layer. Secondly, we assumed that all cobalt atoms in the ZnO layer are substituted in the ZnO lattice. Indeed, the XAS data presented in Fig. 8 provide clear evidence for substitutional cobalt in the implanted matrix and furthermore we could not find any indication for clustering in the ZnO layer in the TEM pictures. We also assumed that all cobalt atoms in the Al2O3 substrate are in the cluster phase with a magnetic moment of 1.6 per cobalt atom, as expected for metallic cobalt. Using the average magnetic moment value from the SQUID data (=2.19 ), finally we calculate =2.81 per substituted cobalt atom in the ZnO layer. This value is very close to the magnetic moment of Co 2+ in its high spin state (=3 ). Janisch et al. (2005); Patterson (2006)

In Fig. 13 we show the temperature dependent magnetization of Co-implanted ZnO film. Since the annealing to very high temperatures destroys the ferromagnetism in oxide-based DMS materials, Khaibullin et al. (2007) we only heated the sample up to 400 K. From Fig. 13 it is clear that the TC is much higher than 400 K. To check whether the substitutional phase is still present at 400 K, we measured another hysteresis curve at this temperature using SQUID magnetometer. Fig. 14 shows that substitutional Co in ZnO is ferromagnetic even at 400 K. By fitting a Brillouin curve to the M(T) data in Fig. 13 as a crude approximation, we estimate that the ferromagnetic Curie temperature is as high as 700 K for our film, as it was observed for Co-implanted TiO2 rutile. Khaibullin et al. (2007)

IV Discussion and Conclusions
In the literature, the reported highest solubility limit of cobalt ions in ZnO is less than 50 % using pulsed-laser deposition (PLD). Ueda et al. (2001) The measured cobalt concentration of 40-50 at.% in ZnO in this study is rather high, such that the formation of cobalt clusters in ZnO should be expected. However, no clusters could be observed within the ZnO layer. It seems that this is a peculiarity of ion implantation, which allows doping of transition metals beyond their solubility limits. Hebard et al. (2004)
The difference in the shape of the hysteresis curves obtained by MOKE and SQUID is attributed to the surface sensitivity of the MOKE technique with a maximum penetration depth of about 20-30 nm. On the other hand, the SQUID technique probes the whole volume of a sample. The ZnO films has a thickness of 35 nm before implantation. Because of the surface sputtering, the ZnO thickness decreases to about 28 nm after implantation. Thus MOKE provides information only from the ZnO layer, not from the sapphire substrate, i.e. MOKE is only sensitive to the ferromagnetic contribution from the ZnO layer. In this layer a small fraction of nonmagnetic ZnO atoms are replaced by magnetic Co ions, giving rise to the MOKE hysteresis. However, SQUID collects magnetic contributions from both the Co-implanted ZnO film and from the cobalt clusters in Al2O3. Therefore, the difference between the MOKE and SQUID data appear as a result of the depth-dependent Co content in the implanted layer.
Another important result of this study is the observation of oxygen spin polarization in the Co-implanted ZnO film. Since the shape of the hysteresis curve measured at the O K edge (Fig. 11) is the same as the one recorded by MOKE (Fig. 4(a)), spin polarization of oxygen atoms in this sample cannot be due to the cobalt clusters in the sapphire substrate. Otherwise, the hysteretic shape of the polarized oxygen should be similar to the hysteresis of metallic cobalt clusters in sapphire with a large coercive field. From this we infer that the oxygen atoms are polarized due to the spontaneous ferromagnetic order in the ZnO film.
The main question that arises here is the mechanism which leads to the observed long range ferromagnetic ordering in Co-doped ZnO. Recently, Patterson PattersonCond-mat calculated the electronic structures of Co substituted for Zn in ZnO, for Zn and O vacancies, and for interstitial Zn in ZnO using the B3LYP hybrid density functional theory. He reported that the singly-positively charged O vacancy is the only defect in Co-doped ZnO which can mediate ferromagnetic exchange coupling of Co ions at intermediate range (just beyond near neighbor distances). In the ground state configuration the majority Co spins are parallel whereas the minority spins are parallel to each other and to the oxygen vacancy spin, so that there are exchange couplings between these three spins which lead to an overall ferromagnetic ground state of the Co ions. No substantial exchange coupling was found for the positively charged interstitial Zn defect which has also spin half. The exchange coupling mechanism explained by Patterson is essentially the same as the impurity band model of Coey et al., Coey et al. (2005) in which the polarons bound to the oxygen vacancies mediate ferromagnetic coupling between Co ions. In order to have the magnetic moments of the Co ions aligned ferromagnetically, one mediating electron is required with an oppositely directed spin. The oxygen spin polarization has not explicitly been considered in the aforementioned band structure calculations and may be due to a ferromagnetic splitting of nearest neighbor oxygen p-levels.
V Summary
In conclusion, the structural and magnetic properties of a Co-implanted ZnO film, deposited by RF-sputtering method on a () oriented sapphire substrate, have been investigated. The structural data indicate a Co cluster formation in the sapphire substrate close to the ZnO/Al2O3 interface. However, no indication of clustering in the ZnO layer has been found. The XAS data with a multiplet structure around the Co L3 edge clearly shows that the implanted cobalt ions are in the Co2+ oxidation state in Co-implanted ZnO film. The magnetization measurements show that there are two magnetic phases in the Co-implanted ZnO/Al2O3 films. One is the ferromagnetic phase due to the Co substitution on Zn sites in the ZnO host matrix and the second magnetic phase originates from Co clusters in the sapphire substrate. Using x-ray resonant magnetic scattering at the Co edge, the magnetic contributions from the ZnO film and the substrate can be separated. A clear ferromagnetic signal at the O K edge is also observed which shows that the oxygen atoms close to the substituted cobalt atoms are polarized. Furthermore, we have found very high magnetic magnetic moment of 2.81 per substituted cobalt atom with a very high Curie temperature (TC400 K) in Co-implanted ZnO film.
Acknowledgements.
We wish to acknowledge S. Erdt-Böhm and P. Stauche for sample preparation and technical support and A. Kröger for preparation of TEM samples. We would like to thank also Dr. C. Sternemann and Dr. M. Paulus for their assistance with the beamline operation at DELTA and G. Nowak for his help to perform XRD experiments at HASYLAB. This work was partially supported by BMBF through Contracts Nos. 05KS4PCA (ALICE Chamber) and 05ES3XBA/5 (Travel to BESSY), by DFG through SFB 491, and by RFBR through the grant No 07-02-00559-a. N. Akdogan acknowledges a fellowship through the IMPRS-SurMat.References
- Feynman (1986) R. P. Feynman, Found. Phys. 16, 507 (1986).
- Datta and Das (1990) S. Datta and B. Das, Appl. Phys. Lett. 56, 665 (1990).
- Prinz (1998) G. A. Prinz, Science 282, 1660 (1998).
- Ohno et al. (1998) H. Ohno, N. Akiba, F. Matsukura, A. Shen, K. Ohtani, and Y. Ohno, Appl. Phys. Lett. 73, 363 (1998).
- Oestreich (1999) M. Oestreich, Nature (London) 402, 735 (1999).
- Ohno et al. (1999) Y. Ohno, D. K. Young, B. Beschoten, F. Matsukura, H. Ohno, and D. D. Awschalom, Nature 402, 790 (1999).
- Wolf et al. (2001) S. A. Wolf, D. D. Awschalom, R. A. Buhrman, J. Daughton, S. von Molnar, M. L. Roukes, A. Y. Chtchelkanova, and D. M. Treger, Science 294, 1488 (2001).
- Sarma (2001) S. D. Sarma, Am. Sci. 89, 516 (2001).
- Jonker et al. (2001) B. T. Jonker, A. T. Hanbicki, Y. D. Park, G. Itskos, M. Furis, G. Kioseoglou, and A. Petrou, Appl. Phys. Lett. 79, 3098 (2001).
- Schmidt et al. (2000) G. Schmidt, D. Ferrand, L. W. Molenkamp, and B. J. van Wees, Phys. Rev. B 62, R4790 (2000).
- Ohno et al. (1996) H. Ohno, A. Shen, F. Matsukura, A. Oiwa, A. Endo, S. Katsumoto, and Y. Iye, Appl. Phys. Lett. 69, 363 (1996).
- Ando et al. (1998) K. Ando, T. Hayashi, M. Tanaka, and A. Twardowski, J. Appl. Phys. 83, 65481 (1998).
- Beschoten et al. (1999) B. Beschoten, P. A. Crowell, I. Malajovich, D. D. Awschalom, F. Matsukura, A. Shen, and H. Ohno, Phys. Rev. Lett. 83, 3073 (1999).
- Grandidier et al. (2000) B. Grandidier, J. P. Hys, C. Delerue, D. Stievenard, Y. Higo, and M. Tanaka, Appl. Phys. Lett. 77, 4001 (2000).
- Sadowski et al. (2001) J. Sadowski, R. Mathieu, P. Svedlindh, J. Z. Domagala, J. Bak-Misiuk, J. Swiatek, M. Karlsteen, J. Kanski, L. Ilver, H. Asklund, et al., Appl. Phys. Lett. 78, 3271 (2001).
- Potashnik et al. (2001) S. J. Potashnik, K. C. Ku, S. H. Chun, J. J. Berry, N. Samarth, and P. Schiffer, Appl. Phys. Lett. 79, 1495 (2001).
- Schott et al. (2001) G. M. Schott, W. Faschinger, and L. W. Molenkamp, Appl. Phys. Lett. 79, 1807 (2001).
- Munekata et al. (1989) H. Munekata, H. Ohno, S. von Molnar, A. Segmuller, L. L. Chang, and L. Esaki, Phys. Rev. Lett. 63, 1849 (1989).
- Munekata et al. (1993) H. Munekata, A. Zaslevsky, P. Fumagalli, and R. J. Gambino, Appl. Phys. Lett. 63, 2929 (1993).
- Soo et al. (1996) Y. L. Soo, S. W. Huang, Z. H. Ming, Y. H. Kao, and H. Munekata, Phys. Rev. B 53, 4905 (1996).
- Koshihara et al. (1997) S. Koshihara, A. Oiwa, M. Hirasawa, S. Katsumoto, Y. Iye, C. Urano, H. Takagi, and H. Munekata, Phys. Rev. Lett. 78, 4617 (1997).
- Akai (1998) K. J. Akai, Phys. Rev. Lett. 81, 3002 (1998).
- Oiwa et al. (2001) A. Oiwa, T. Slupinski, and H. Munekata, Appl. Phys. Lett. 78, 518 (2001).
- Ohno (1998) H. Ohno, Science 281, 951 (1998).
- Ohno (2000) H. Ohno, J. Vac. Sci. Technol. B 18, 2039 (2000).
- Ohno et al. (2002) H. Ohno, F. Matsukura, and Y. Ohno, Jap. Soc. Appl. Phys. Int. 5, 4 (2002).
- Dietl et al. (2000) T. Dietl, H. Ohno, F. Matsukura, J. Cibert, and D. Ferrand, Science 287, 1019 (2000).
- Sato and Katayama-Yoshida (2000) K. Sato and H. Katayama-Yoshida, Jpn. J. Appl. Phys. 39, L555 (2000).
- Sato and Katayama-Yoshida (2001) K. Sato and H. Katayama-Yoshida, Jpn. J. Appl. Phys. 40, L334 (2001).
- Ueda et al. (2001) K. Ueda, H. Tabada, and T. Kawai, Appl. Phys. Lett. 79, 988 (2001).
- Pearton et al. (2003) S. J. Pearton, C. R. Abernathy, D. P. Norton, A. F. Hebart, Y. D. Park, L. A. Boatner, and J. D. Budai, Mater. Sci. and Engineering R 40, 137 (2003).
- Prellier et al. (2003) W. Prellier, A. Fouchet, and B. Mercey, J. Phys.: Condens. Matter. 15, R1583 (2003).
- Tuan et al. (2004) A. C. Tuan, J. D. Bryan, A. B. Pakhomov, V. Shutthanandan, S. Thevuthasan, D. E. McCready, D. Gaspar, M. H. Engelhard, J. W. Rogers, K. Krishnan, et al., Phys. Rev. B 70, 054424 (2004).
- Pearton et al. (2004a) S. J. Pearton, W. H. Heo, M. Ivill, D. P. Norton, and T. Steiner, Semicond. Sci. Technol. 19, R59 (2004a).
- Pearton et al. (2004b) S. J. Pearton, D. P. Norton, K. Ip, Y. W. Heo, and T. Steiner, J. Vac. Sci. Technol. B 22, 932 (2004b).
- Liu et al. (2005) C. Liu, F. Yun, and H. Morkoc, J. Mater. Sci.: Mater. in Electronics 16, 555 (2005).
- Janisch et al. (2005) R. Janisch, P. Gopal, and N. A. Spaldin, J. Phys.: Condens. Matter. 17, R657 (2005).
- Liu et al. (2006) J. J. Liu, M. H. Yu, and W. L. Zhou, J. Appl. Phys. 99, 08M119 (2006).
- Pacuski et al. (2006) W. Pacuski, D. Ferrand, J. Cibert, C. Deparis, J. A. Gaj, P. Kossacki, and C. Morhain, Phys. Rev. B 73, 035214 (2006).
- Zhang et al. (2007) J. Zhang, X. Z. Li, Y. F. Lu, and D. J. Sellmyer, J. Phys.: Condens. Mater. 19, 036210 (2007).
- Behan et al. (2008) A. J. Behan, A. Mokhtari, H. J. Blythe, D. Score, X.-H. Xu, J. R. Neal, A. M. Fox, , and G. A. Gehring, Phys. Rev. Lett. 100, 047206 (2008).
- Ay et al. (2003) M. Ay, A. Nefedov, and H. Zabel, Appl. Surf. Sci. 205, 329 (2003).
- Ziegler et al. (1985) J. F. Ziegler, J. P. Biersack, and U. Littmark, The Stopping and Range of Ions in Solids (Pergamon Press, New York, 1985).
- Morawe and Zabel (1995) C. Morawe and H. Zabel, J. Appl. Phys. 77, 1969 (1995).
- Zeidler et al. (1996) T. Zeidler, F. Schreiber, H. Zabel, W. Donner, and N. Metoki, Phys. Rev. B 53, 3256 (1996).
- Schmitte (2002) T. Schmitte, Ph.D. thesis, Ruhr-Universität Bochum (2002).
- Westphalen (2007) A. Westphalen, Ph.D. thesis, Ruhr-Universität Bochum (2007).
- Tonnerre et al. (1995) J. M. Tonnerre, L. Seve, D. Raoux, G. Soullie, B. Rodmacq, and P. Wolfers, Phys. Rev. Lett. 75, 740 (1995).
- van der Laan (2006) G. van der Laan, Current Opinion in Solid State and Materials Science 10, 120 (2006).
- Kortright et al. (2003) J. B. Kortright, J. S. Jiang, S. D. Bader, O. Hellwig, D. T. Marguiles, and E. E. Fullerton, Nucl. Instr. Meth. Phys. Res. B 199, 301 (2003).
- Grabis et al. (2003) J. Grabis, A. Nefedov, and H. Zabel, Rev. Sci. Instr. 74, 4048 (2003).
- Regan et al. (2001) T. J. Regan, H. Ohldag, C. Stamm, F. Nolting, J. Lüning, J. Stöhr, and R. L. White, Phys. Rev. B 64, 214422 (2001).
- Kobayashi et al. (2005) M. Kobayashi, Y. Ishida, J. I. Hwang, T. Mizokawa, A. Fugimori, K. Mamiya, J. Okamoto, Y. Takeda, T. Okane, Y. Saitoh, et al., Phys. Rev. B 72, 201201(R) (2005).
- Patterson (2006) C. H. Patterson, Phys. Rev. B 74, 144432 (2006).
- Khaibullin et al. (2007) R. I. Khaibullin, S. Z. Ibragimov, L. R. Tagirov, V. N. Popok, and I. B. Khaibullin, Nucl. Instr. and Meth. in Phys. Res. B 257, 369 (2007).
- Hebard et al. (2004) A. F. Hebard, R. P. Rairigh, J. G. Kelly, S. J. Pearton, C. R. Abernathy, S. N. G. Chu, and R. G. Wilson, J. Phys. D: Appl. Phys. 37, 511 (2004).
- Coey et al. (2005) J. M. D. Coey, M. Venkatesan, and C. B. Fitzgerald, Nature Materials 4, 173 (2005).