An accretion disc model for quasar optical variability
Abstract
Some different correlations between optical-UV variability and other quasar properties, such as luminosity, black hole mass and rest-frame wavelength, were discovered. The positive correlation between optical-UV variability amplitude and black hole mass was first found by Wold et al., and this was confirmed by Wilhite et al. We suggest that the accretion disk model can explain these correlations, provided the optical-UV variability is triggered by the change of accretion rate. The disk temperature of accretion discs decreases with increasing black hole mass, which leads to systematical spectral shape difference with black hole mass even if the black hole is accreting at the same rate (). The observed positive correlation between optical-UV variability and black hole mass can be well reproduced by our model calculations, if the mean accretion rate with variation of . We also found that the observed correlations of optical-UV variability amplitude with luminosity or rest-frame wavelength can be qualitatively explained by this accretion disc model.
keywords:
accretion, accretion discs - quasars: general - galaxies: photometry1 Introduction
Quasars are variable in different wavebands, and their variability has been extensively explored for several decades (Smith & Hoffleit, 1963; Matthews & Sandage, 1963). It has been accepted that quasars are powered by black hole accretion, and their variability therefore provides an important clue to understand the physics at work in accretion discs. The timescales of optical variability for quasars vary from hours to decades. The variability is found to be correlated with other quasar properties, such as redshift and luminosity. There is a strong negative correlation of variability with quasar luminosity, while a significant positive correlation between variability and redshift is also present (Cristiani et al., 1996; Vanden Berk et al., 2004). An anti-correlation between variability amplitude and rest-frame wavelength has also been observed, so the correlation between variability and redshift was explained by the selection effect, because quasars at higher redshifts are more easier to be probed in shorter rest-frame wavelength (Cid Fernandes et al., 1996; Cristiani et al., 1996). However, Vanden Berk et al. (2004) claimed that the evolution of quasar population or the change of quasar variability mechanism can cause quasars to be more variable at higher redshifts based on a sample of over 25,000 quasars from the Sloan Digital Sky Survey, which is different from the selection effect scenario.
Recently, Wold et al. (2007) matched quasars from the the Quasar Equatorial Survey Team Phase 1 (QUEST1) variability survey with broad-line objects from the Sloan Digital Sky Survey, which leads to quasars. The black hole masses of these quasars are estimated from the widths of broad-line . They measured the variability amplitudes from the QUEST1 light curves, and found a correlation between quasar variability amplitude and black hole mass. They found that the correlation seems to be unlikely caused by selection effects or the contamination coming from host galaxy or other well-known correlations. This correlation between black hole mass and variability amplitude was confirmed by Wilhite et al. (2007) by using a sample over 2500 quasars.
There were many efforts devoted to reveal the physics behind the correlations between quasar optical-UV variability and other quasar properties. Many different scenarios were suggested, such as, variation of accretion rates, disc instabilities, stellar collisions, and microlensing effect (e.g., Pereyra et al., 2006; Mineshige et al., 1994; Kawaguchi et al., 1998; Terlevich et al., 1992; Torricelli-Ciamponi et al., 2000; Cid Fernandes et al., 2000; Morgan et al., 2006). It is widely believed that quasars are powered by black hole accretion. However, the spectral shape in optical-UV bands for a standard thin accretion disc can be approximated as , while the observed quasar continua usually exhibit . Gaskell (2007) suggested that the observed quasar spectra can be reproduced by accretion discs with a temperature gradient of instead of as predicted by standard thin disc model. This means that there is some flow of heat outwards in the disk. They use the optical variability timescales of quasars to argue that the variations must propagate at close to the speed of light, rather than on viscous timescales (Gaskell, 2007). Pereyra et al. (2006) found that the multi-epoch quasar spectra in the rest-frame wavelength range can be fitted by the standard thin disc model, provided their accretion rates vary from one epoch to the next. Thus, it is a reasonable scenario that the variability may be caused by the change of accretion rates.
In this work, we investigate the variability amplitude of quasars as a function of black hole mass based on accretion disc models assuming the variability to be caused by the change of accretion rates. We also compare our theoretical calculations with the observed correlations of variability amplitude with other quantities (i.e., luminosity or observed wavelength).
2 Accretion disc models
The big blue bump observed in many AGN is believed to be related to some kind of thermal emission (Malkan & Sargent, 1982; Shalyapin et al., 2002). The thermal emission of the standard thin accretion disc can reproduce the general features of AGN continua, provided some other components, such as an extrapolation of infrared continuum or a power-law X-ray continuum, are included (Sun & Malkan, 1989; Laor, 1990) (but also see Gaskell, 2007).
The standard thin disc is geometrically thin, optically thick, and its emission is close to blackbody (Shakura & Sunyaev, 1973). The gases in the disc rotate at Keplerian velocities, and they are in hydrodynamical equilibrium in the vertical direction. The structure of a standard thin disc can be derived analytically (see, e.g., Kato et al., 1998). In this work, we adopt the temperature distribution of an accretion disc as a function of radius given by Kato et al. (1998),
| (1) |
where,
and
Here is the black hole mass, , , and is the viscosity parameter. The spectrum of the accretion disc can be calculated with
| (2) |
where is given by Eq. (1), , is the outer radius of disc, is the Plank’s constant, is the inclination of axis of the disc with respect to the line of sight, and is the distance from the observer to the black hole (Frank et al., 2002).
The optical/UV continuum of a standard thin disc is , which is inconsistent with observed in many quasars. Gaskell (2007) suggested that the observed quasar spectra can be reproduced by accretion discs with a temperature gradient of instead of as predicted by standard thin disc model. Thus, we also adopt this modified disc model in our spectral calculations (this model is referred to as modified accretion disc model hereafter). The temperature of the disc is then given by
| (3) |
where is a correction factor used to let the resulted disc luminosity be the same as that for a standard thin disc with the same disc parameters. The spectra of the modified accretion discs can be calculated with Eqs. (2) and (3).
3 results
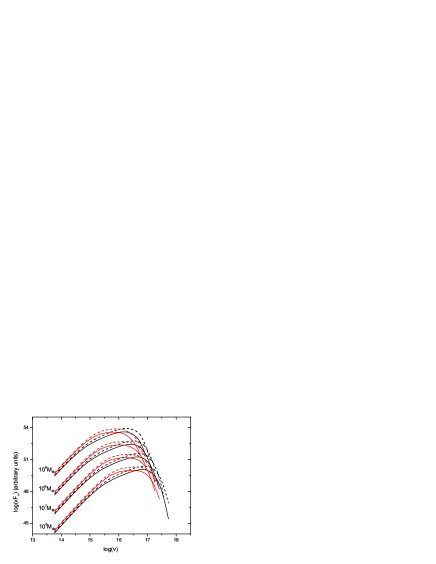
The spectra of standard thin discs can be calculated with Eqs. (1) and (2), provided the values of disc parameters (, and ) are supplied. In Fig. 1, we plot the spectra of the discs with different black hole masses and accretion rates. For comparison, we also plot the spectra of the discs calculated with Eqs. (3) and (2) based on the modified disc model described in last section. In the figure, we find that both standard thin disc model and modified disc model naturally show the optical/UV variability becomes larger with the increase of black hole mass, if the accretion rate changes at the same percentage.
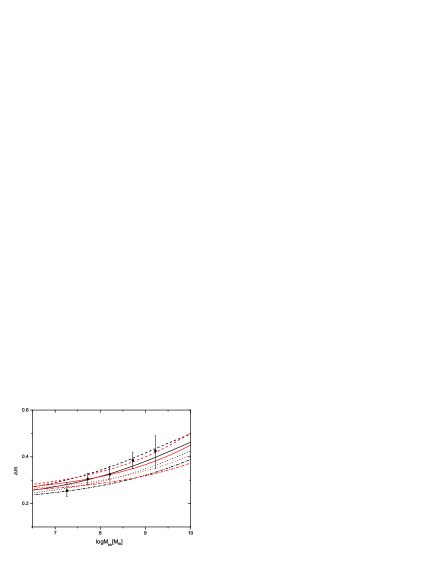
Assuming the optical variability to be caused by the change of accretion rates in AGN, we calculate the optical variability amplitude as a function of black hole mass with the disc models described in last section. In our calculations, the accretion rate varies in the range of , where and for standard disc model ( for the modified disc model), are adopted. In Fig. 2, we compare our calculations with the correlation between variability amplitude at R-band and black hole mass discovered by Wold et al. (2007). We find that our calculations can reproduce their statistic result quite well(see Fig. 2).
We also calculate the optical variability amplitude as functions of luminosity by changing accretion rates for given black hole mass (see Fig. 3). We find that the optical variability amplitude decreases with increasing luminosity for a given black hole mass, which is qualitatively consistent with the observed anti-correlation between these two quantities (e.g., Cristiani et al., 1996; Vanden Berk et al., 2004; Wilhite et al., 2007).

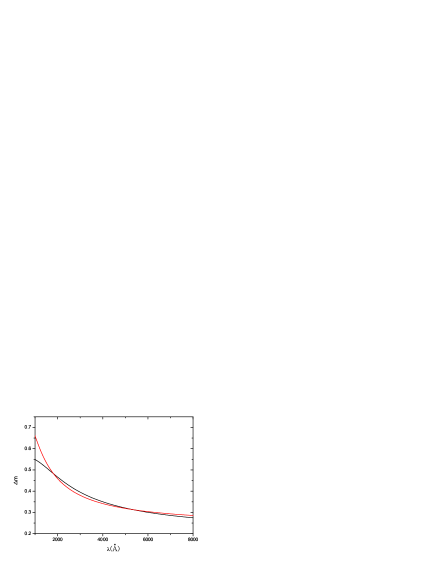
The dependence of the optical variability amplitude on the observed wavelength measured in the rest frame can be calculated based on either the standard thin disc model or the modified disc model for given disc parameters (see Fig. 4). It is found that the variability amplitude decreases with increasing rest-frame wavelength is either for standard accretion disc model or the modified disc model.
4 conclusions and discussion
The temperature of the disc decreases with increasing black hole mass, so the spectra of the discs surrounding massive black holes are softer than those for less massive black holes (see Fig. 1). It is found that the optical variability amplitude varies with black hole mass even if the changes of accretion rates are same. Our present calculations show that the observed correlation between the optical variability amplitude and black hole mass can be explained by accretion disc models, if the variability is triggered by the variation of accretion rate. In all our calculations, a conventional value of viscosity parameter is adopted. The final results depend on the value of quite insensitively (see Eqs. 1 and 3), and the conclusions will not be altered even if a different value of is adopted.
In this work, the accretion rate (standard thin disc model) and (modified disc model) are adopted to calculate the disc spectra, and we find that the optical variability amplitude increases with black hole mass, which can reproduce the observed correlation quite well (see Fig. 2). The mean accretion rate of the sample used in Wold et al. (2007) is , which is roughly consistent with the mean accretion rate adopted in this work provided the radiative efficiency is .
The optical emission is dominantly from the accretion disc region with several hundred Schwarzschild radii from the black hole (e.g., Gaskell, 2007; Liu et al., 2008). The timescales of quasar variability in Wold et al. (2007) range from a few hours to years, which are much shorter than the viscous timescale of the disc, but is usually longer than the light-travel time of the distance to the black hole (see detailed discussion in Gaskell, 2007). This may imply that the energy propagates at close to the speed of light, rather than on viscous timescales. Thus, the outer disc region is irradiated by the radiation of the inner disc region, and the temperature distribution of the disc is altered significantly as described by the modified accretion disc model. Such a modified disc model can successfully reproduce the steep spectra in optical-UV bands (Gaskell, 2007).
Our calculations indicate that the optical variability amplitude declines with luminosity of the accretion disc if it black hole mass is fixed. This is qualitatively consistent with the statistical result given by Wilhite et al. (2007). Based on either the standard accretion disc model or the modified disc model, the spectral calculation show that the optical variability amplitude decreases with increasing wavelength. Such a relation has already observed by Vanden Berk et al. (2004).
We thank Zhaohui Shang for helpful discussion and the support from the NSFC (grant 10773020), the CAS (grant KJCX2-YW-T03) and the China Postdoctoral Science Foundation (grant 20070420681).
References
- Cid Fernandes et al. (1996) Cid Fernandes R. J., Aretxaga I., Terlevich R., 1996, MNRAS, 282, 1191
- Cid Fernandes et al. (2000) Cid Fernandes R., Sodré L. Jr., Vieira da Silva L. Jr., 2000, ApJ, 544, 123
- Cristiani et al. (1996) Cristiani S., Trentini S., La Franca F., Aretxaga I., Andreani P., Vio R., Gemmo A., 1996, A&A, 306, 395
- Frank et al. (2002) Frank, J., King, A., Raine, D. 2002, Accretion Power in Astrophysics (London: Cambridge Univ. Press)
- Gaskell (2007) Gaskell, C.M., 2007,arXiv:0711.2113G
- Kawaguchi et al. (1998) Kawaguchi T., Mineshige S., Umemura M., Turner E. L., 1998, ApJ, 504, 671
- Kato et al. (1998) Kato, S., Fukue, J., Mineshige, S. 1998, Black-Hole Accretion Disks (Kyoto: Kyoto Univ. Press)
- Laor (1990) Laor, A. 1990, MNRAS, 246, 369
- Liu et al. (2008) Liu, H. T., Bai J. M., Zhao, X. H., Ma, L., 2008 ApJ, 677, 884L
- Malkan & Sargent (1982) Malkan, M., Sargent, W. 1982, ApJ, 254, 22
- Matthews & Sandage (1963) Matthews, Thomas A., Sandage, Allan R., 1963, ApJ, 138, 30M
- Mineshige et al. (1994) Mineshige, S., Ouchi, B. N., Nishimori, H. 1994, PASJ, 46, 97
- Morgan et al. (2006) Morgan C.W., Kochanek C. S., Morgan N. D., Falco E. E., 2006, ApJ, 647, 874
- Pereyra et al. (2006) Pereyra N. A., Vanden Berk D. E., Turnshek D. A., Hillier D. J., Wilhite B. C., Kron R. G., Schneider D. P., Brinkmann J., 2006, ApJ, 642, 87
- Shakura & Sunyaev (1973) Shakura, N. I., Sunyaev, R. A. 1973, A&A, 24, 337
- Shalyapin et al. (2002) Shalyapin, V. N., Goicoechea, L. J., Alcalde, D., Mediavilla, E., Muñoz, J. A., Gil-Merino, R. 2002, ApJ, 579, 127
- Smith & Hoffleit (1963) Smith, H. J., Hoffleit, D., 1963, Nature, 198, 650S
- Sun & Malkan (1989) Sun, W.-H., Malkan, M. A. 1989, ApJ, 346, 68
- Terlevich et al. (1992) Terlevich, R., Tenorio-Tagle, G., Franco, J., Melnick, J. 1992, MNRAS, 255, 713
- Torricelli-Ciamponi et al. (2000) Torricelli-Ciamponi G., Foellmi C., Courvoisier T. J.-L., Paltani S., 2000, A&A, 358, 57
- Vanden Berk et al. (2004) Vanden Berk D. E. et al., 2004, ApJ, 601, 692
- Wold et al. (2007) Wold M., Brotherton M.S., Shang Z., 2007, MNRAS, 375, 989W
- Wilhite et al. (2007) Wilhite, B. C., Brunner, R. J., Grier, C. J., Schneider, D. P., Vanden Berk, D. E., 2008, MNRAS, 383, 1232w