Kinematics and Stellar Populations of Low-Luminosity Early-Type Galaxies in the Abell 496 Cluster ††thanks: Based on observations obtained with ESO VLT (program 074.A-0533) and MegaPrime/MegaCam, a joint project of Canada France Hawaii Telescope (CFHT) and CEA/DAPNIA, at the Canada-France-Hawaii Telescope (program 03BF12), which is operated by the National Research Council (NRC) of Canada, the Institut National des Sciences de l’Univers of the Centre National de la Recherche Scientifique (CNRS) of France, and the University of Hawaii. ††thanks: All the spectral and imaging data used in this paper are available through the VO-Paris Data Centre: http://voplus.obspm.fr/DataCollections/Abell0496/
Abstract
Context. The morphology and stellar populations of low-luminosity early-type galaxies in clusters have until now been limited to a few relatively nearby clusters such as Virgo or Fornax. Scenarii for the formation and evolution of dwarf galaxies in clusters are therefore not well constrained.
Aims. We investigate here the morphology and stellar populations of low-luminosity galaxies in the relaxed richness class 1 cluster Abell 496 ().
Methods. Deep multiband imaging obtained with the CFHT Megacam allowed us to select a sample of faint galaxies, defined here as objects with magnitudes mag within a 1.2 arcsec fibre ( mag). We observed 118 galaxies spectroscopically with the ESO VLT FLAMES/Giraffe spectrograph with a resolving power . We present structural analysis and colour maps for the 48 galaxies belonging to the cluster. We fit the spectra of 46 objects with PEGASE.HR synthetic spectra to estimate the ages, metallicities, and velocity dispersions. We estimated possible biases by similarly analysing spectra of 1200 early-type galaxies from the Sloan Digital Sky Survey Data Release 6 (SDSS DR6). We computed values of /Fe abundance ratios from the measurements of Lick indices. We briefly discuss effects of the fixed aperture size on the measurements.
Results. For the first time, high-precision estimates of stellar population properties have been obtained for a large sample of faint galaxies in a cluster, allowing for the extension of relations between stellar populations and internal kinematics to the low-velocity dispersion regime. We have revealed a peculiar population of elliptical galaxies in the core of the cluster, resembling massive early-type galaxies by their stellar population properties and velocity dispersions, but having luminosities of about 2 magnitudes fainter.
Conclusions. External mechanisms of gas removal (ram pressure stripping and gravitational harassment) are more likely to have occurred than internal mechanisms such as supernova-driven winds. The violent tidal stripping of intermediate-luminosity, early-type galaxies in the cluster core can explain the properties of the peculiar elliptical galaxies surrounding the cD galaxy.
Key Words.:
evolution of galaxies; galaxies: clusters: individual (Abell 496); kinematics; stellar populations; spectroscopic survey1 Introduction
Understanding the formation and evolution of galaxies is one of the most challenging tasks in modern astrophysics, and substantial progress has been achieved in characterising the evolutionary pattern of early-type galaxies. Massive ellipticals, which are found principally in clusters, are known to be already present at z 1 (Ziegler 2000, and references therein). Recent large surveys give strong support to: (1) the downsizing star formation concept (the star formation activity is seen to progress with time, from high mass galaxies to smaller ones (as first suggested by Matteucci 1994) from variations of the [Mg/Fe] ratio with galaxy luminosity in ellipticals, then by Cowie et al. 1996); and (2) the top-down formation where mass assembly occurs at lower redshifts for lower galaxy masses (Bundy et al. 2006; Cimatti et al. 2006). However, if a consensus exists for star formation timescales and chemical evolution, it is not clear even for massive ellipticals if the mass assembly time corresponds to the star formation episode duration (Bell et al. 2006; Pozzetti et al. 2007; Scarlata et al. 2007). In addition, multiple mergers of smaller galaxies are not the only formation mechanism, also leaving room for a rapid collapse of gas in the remote past. Moreover, galaxy evolution in clusters is expected to be different from that in lower density environments. The local morphology-density relation revealed by Dressler (1980), with a very high fraction of early-type galaxies found in cluster cores, has been extended to a larger range of galaxy density from the SDSS (Goto et al. 2003) and to higher redshift (Capak et al. 2007). Both the latter study and the disc-fading model discussion for S0 galaxy formation by Christlein & Zabludoff (2004) indicate that the morphology and star formation could be affected by different processes: the increase in early-type fraction is mostly driven by galaxy interactions and harassment (Moore et al. 1998) or by tidal effects induced by the crossing of the cluster potential well (including dynamical friction); the reduction or suppression of the star formation is caused by ram pressure gas stripping (Gunn & Gott 1972, Abadi et al. 1999) or by strangulation, which prevents further gas accretion by cutting off the outer neutral gas reservoir (Larson et al. 1980). In conclusion, the bulges of lenticulars in clusters are suspected to be the results of tidal interactions.
Such scenarii of morphological transformations of infalling galaxies are also invoked for the transformation of dwarf irregulars or faint late-type spirals into early-type dwarf galaxies constituting the most numerous class of galaxies in nearby clusters. However, until now both the harassment model and the classical wind model in a virialized protogalaxy fail to reproduce the observed positions of dwarf ellipticals in the fundamental plane (Djorgovski & Davis, 1987) which links the internal kinematics and the structural properties (De Rijcke et al. 2005). Geha et al. (2003) and Van Zee et al. (2004) faced similar difficulties trying to explain the intermediate ages and slightly subsolar to solar metallicities found for dwarf ellipticals (dEs) from the analysis of Lick indices: no evolutionary scenario could be ruled out or confirmed. To complicate the situation, Lisker et al. (2007) have shown that early-type dwarfs including ellipticals and dwarf lenticulars (dS0s) do not form a homogeneous class of galaxy. At least five subclasses with different morphological and clustering properties are found in the Virgo cluster: the dE(di)s displaying disc-like features (Lisker et al. 2006a); the dE(bc)s showing a blue centre with recent or ongoing star formation (Lisker et al. 2006b); the bright nucleated dwarfs dE(N)s form an unrelaxed population of disc-shaped dwarfs, which is suspected to be the result of transformations of infalling progenitors; faint nucleated dwarfs; and all non-nucleated dEs form a relaxed population of classical spheroidal objects that formed or arrived in the cluster a long time ago.
In order to clarify the evolutionary path of intermediate and low-mass, early-type galaxies in clusters we have studied the photometric, stellar population and kinematical properties of a sample of dwarf galaxies in the nearby cluster Abell~496. Our goal is to point out objects that are clearly the results of the different proposed scenarii to define which properties are discriminant for the formation and evolution of faint early-type galaxies. It is more promising to identify and select the most probable candidates rather than performing statistical studies on the whole class of intermediate and low-mass early-type objects. A first step has been the discovery of a new compact elliptical which is the result of tidal stripping by the central cluster Dominant (cD) galaxy of an intermediate mass lenticular (Chilingarian et al. 2007c).
Abell~496 is a richness class 1 cluster (Abell 1958) of cD type (Struble & Rood 1987) at a heliocentric velocity of 9885 km s-1 (, Durret et al. 2000 and references therein), or 9707 km s-1 () after correcting for infall of the Local Group toward Virgo. For a Hubble constant H0=73 km s-1 Mpc-1, the distance modulus is 35.70 ( Mpc) and the corresponding scale is 0.627 kpc arcsec-1. Abell~496 is a cluster with several hundred measured galaxy redshifts (Durret et al. 1999). The analysis of the distribution of 466 redshifts in the direction of this cluster has revealed the existence of several structures along the line of sight; however, the redshift distribution of the 274 galaxies found to belong to the cluster itself implied that Abell~496 has a regular morphology and a well relaxed structure (Durret et al. 2000). This is confirmed by X-ray data: the X-ray map obtained from XMM-Newton observations is indeed quite regular, contrary to most clusters where even if the X-ray emissivity map appears regular, the temperature map of the hot gas does not (e.g., Durret et al. 2005).
We will present here results for 48 low-luminosity galaxies in Abell~496. The observations and data reduction are described in Sect. 2. We give the photometric properties of the Abell~496 sample in Sect. 3 and a description of the spectral fitting applied to recover the stellar population and kinematical properties in Sect. 4. We present results from the photometric and spectroscopic analyses in Sect. 5, and discuss our conclusions in Sect. 6.
2 Observations and data reduction
2.1 Imaging observations and sample selection
We obtained images with the Canada France Hawaii Telescope with the Megacam camera in the fall of 2003 (program 03BF12, P.I. V. Cayatte). Megacam covers a field of 1 on the sky, with a pixel size of 0.1870.187 arcsec2. We obtained deep images in the , , , and filters. We reduced these images in the usual way (bias and flat field corrections, photometric, and astrometric calibrations) by the staff of the Terapix data center at Institut d’Astrophysique de Paris (IAP), France. The SExtractor software was run on the image (the image with the best seeing) to detect objects and measure their positions and magnitudes. In particular, we measured magnitudes within a 1.2 arcsec diameter, to prepare FLAMES/Giraffe observations (see below). Details on the data reduction of these images can be found in Boué et al. (2008).
We then discarded stars based on a diagram of aperture minus total magnitude versus total magnitude for 21. Above this magnitude, we kept all objects in our galaxy sample. A photometric redshift code was kindly applied by O. Ilbert to our catalogue in an attempt to eliminate background galaxies. Finally, the galaxies observed with FLAMES/Giraffe were taken from this imaging catalogue, with a magnitude within a diameter of 1.2 arcsec in the band () in the [18-22] interval.
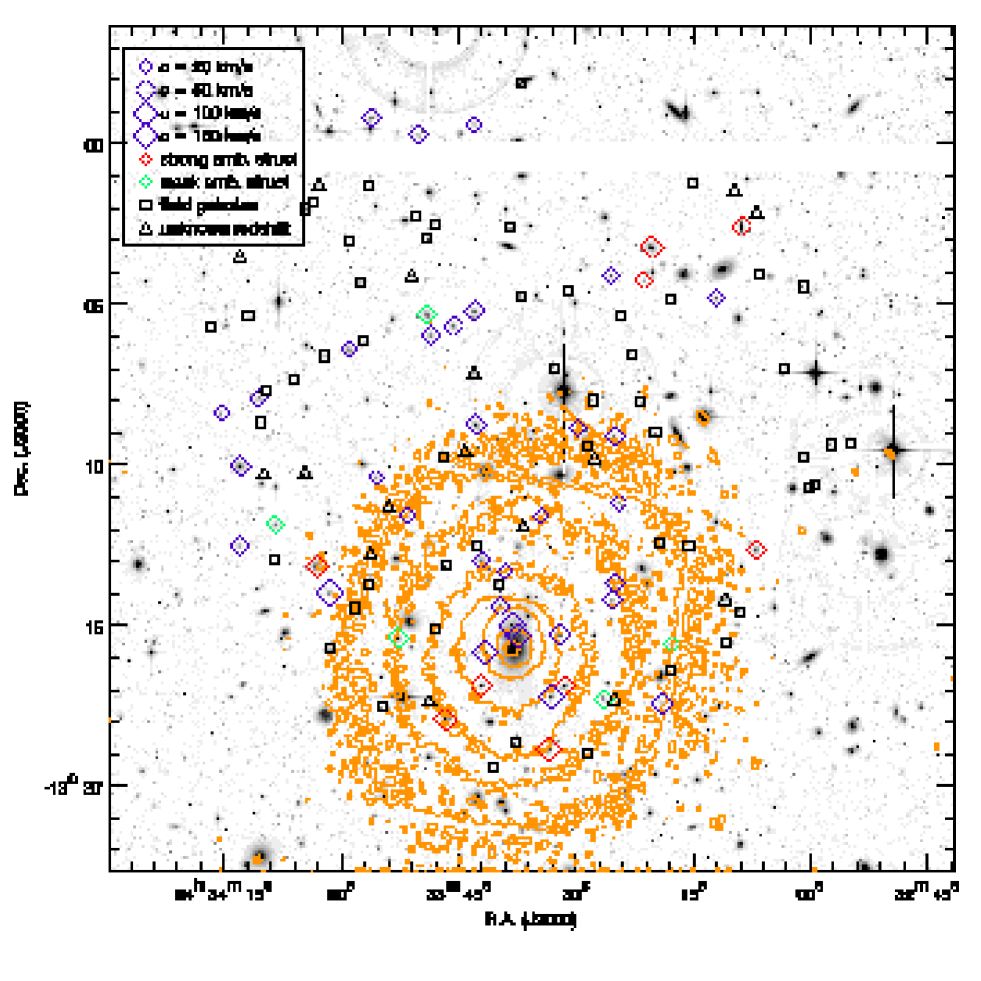
We took the observed galaxies from the catalogue described above, with the following priorities: top priority, objects with ; middle priority, objects with ; and low priority, objects with . We thus obtained 118 galaxy spectra (some fibers had to be used for guide stars and sky spectra). A fragment of the ’-band image with the galaxies observed spectroscopically with FLAMES/Giraffe is shown in Fig. 1.
2.2 Spectroscopic observations and reduction
We obtained spectra with the ESO Very Large Telescope using the FLAMES/Giraffe instrument in the L543.1 configuration on the two nights of 8-10/12/2004. The FLAMES/Giraffe field of view is 20 arcmin in diameter, with a total number of fibres of 130; each fiber has a circular aperture on the sky of 1.2 arcsec in diameter. We used the 600 lines/mm grating in the LR4 setup, giving a resolving power of about in the wavelength range 5010–5831 Å.
We obtained four exposures on the first night for 2700, 3300, 2351, and 1699 seconds. The second night four other exposures have been acquired with the same positioner configuration file and effective durations of 2700, 33002 and 4200 seconds. During the day, exposures of bias, flat fields, and arc line lamps for the wavelength calibration have been done in the same setup and with the two separate sets of MEDUSA fibers. The description of the FLAMES/Giraffe instrument can be found in Pasquini et al. (2002). We extracted and calibrated the spectra were using the Python version of BLDRS - Baseline Data Reduction Software (girbldrs-1.12) available from http://girbldrs.sourceforge.net and with functions and recipes described in the BLDRS Software Reference Manual, Doc. No. VLT-SPE-OGL-13730-0040 (Issue 1.12, 20/9/2004). We did the reduction with the Image Reduction and Analysis Facility (IRAF). The processing includes bias subtraction; diffuse light estimation; removal, localisation, and extraction of the spectra; correction for fiber transmission variations; wavelength calibration; division by the continuum lamp spectrum; and sky subtraction. The resulting spectra are not calibrated in absolute fluxes. We use the flux uncertainties provided by the BLDRS for the data analysis.
We combined individual 1D spectra with the RSI IDL software and we measured redshifts with the rvsao.xcsao package in IRAF, using various stellar templates. Redshifts were also measured through the stellar population synthesis fit described in this work, and both values agreed within their uncertainties.
We had a very good result for our star-galaxy separation since we did not observe any stars spectroscopically. On the other hand, the rejection of background objects based on photometric redshifts was not very efficient, since only 48 out of 102 galaxies with measurable redshifts actually belong to the cluster. Of those 48, 46 have sufficient signal-to-noise ratios to analyse their kinematic and stellar populations. For the two remaining objects we present only the photometric analysis.
Absolute magnitudes were computed using the distance modulus mentioned above. All magnitudes considered throughout the paper are corrected for intergalactic extinction according to Schlegel et al. (1998). We corrected for cosmological dimming, and applied the K-correction and conversion into the -band (if needed) assuming an elliptical galaxy SED and transformations from Fukugita et al. (1995).
3 Spectral fitting
To deduce kinematical and stellar population parameters, we have used direct fitting of the PEGASE.HR (Le Borgne et al. 2004) synthetic spectra to observed data in pixel space (van der Marel & Franx 1993, Cappellari & Emsellem 2004). At the same time, the minimisation procedure returns the parameters of the population model (age and metallicity of Simple Stellar Populations, hereafter SSPs) and of the internal kinematics (Gaussian LOSVD).
Details of the method are given in Chilingarian et al. (2005, 2007d) and Prugniel et al. (2005), and its stability and biases are described in Chilingarian et al. (2007a). In the present paper we fit the observations with single SSPs computed with the Salpeter (1955) IMF. This gives us the SSP-equivalent stellar population parameters that we will refer to throughout the text. We use a 15th order multiplicative polynomial continuum in the fitting procedure and no additive continuum, as discussed in Appendix B, together with the effects of non-solar [Mg/Fe] abundance ratios on the stellar population parameters.
To obtain reliable and precise uncertainties of the stellar population parameters, the computations are done in the rotated coordinate system defined as , where the axis is parallel to the direction of the age–metallicity degeneracy for intermediate-age and old stellar populations noticed by Worthey (1994).
Since the spectral resolution of FLAMES/Giraffe in the MEDUSA mode is rather high (), the PEGASE.HR models, based on the high-resolution () ELODIE.3 empirical stellar library (Prugniel & Soubiran 2001, 2004), remain the only choice if one tries to: (1) avoid a degradation of the spectral resolution of the observed spectra; and (2) use an empirical stellar library. In order to acquire unbiased estimates of the velocity dispersions, one needs to take into account variations of the spectrograph line-spread-function (LSF) and to broaden the template spectra according to the LSF shape (strictly speaking, according to the difference between the LSF of the spectrograph used to obtain the spectra being analysed and that of the stellar library used for spectral synthesis purposes). To achieve this, we fit the twilight spectra obtained with FLAMES/Giraffe in the same setup as the Abell~496 galaxies with solar spectra available in the ELODIE.3 library, which obviously have exactly the same intrinsic LSF as the stars used for the spectral synthesis. The instrumental response of FLAMES/Giraffe appeared to be very stable across the fibers. The instrumental width () changes smoothly from 19 km s-1 at 5000 Å to 15 km s-1 at 5800 Å, H3 remains stable at about , and H4 at about (see the definition of Gauss-Hermite parametrization in van der Marel & Franx, 1993). Slightly negative values of H4 are trivially explained by the fiber sizes (1.2 arcsec) which are larger than a normal spectrograph slit width (diffraction limit of the collimator) resulting in a -shaped LSF. A high spectral resolution of FLAMES/Giraffe allows us to measure velocity dispersions as low as 10 km s-1 for data having a signal-to-noise ratio of about 10 per pixel.
Since our technique for extraction of stellar population and kinematical parameters is based on a non-linear, least-square fitting on many parameters, there is always a chance that the minimisation procedure does not reach the absolute minimum in the space. In addition there are several degeneracies between the parameters, the most important being the (1) age-metallicity, and (2) metallicity-velocity dispersion parameters. For this reason, the shape of the minimum in the parameter space becomes strongly extended along the lines corresponding to those degeneracies, sometimes exhibiting several local minima, where the minimisation algorithm can be trapped. To check how critical the problem is in our case, we built maps.
We proceeded as in Chilingarian et al. (2007a) – Appendix A – fitting only the kinematics and a multiplicative polynomial continuum for a set of fixed values of ages () and metallicities () of the templates; thus for every pair of values () the best fitting kinematical parameters are obtained. Finally, we obtained a map of minimal values in the age–metallicity space for each spectrum. These maps allow us to detect possible systemic errors on the stellar population parameters derived from the non-linear fitting.
For the 46 spectra the solutions of the fitting coincide with the minima seen on the maps, therefore, our minimisation strategy can be considered as reliable (see figures in Appendix A). The reduced values for the spectra (), where no template mismatch due to non-solar [Mg/Fe] ratios is seen, suggest that the flux uncertainties provided by the BLDRS are overestimated by 50 percent.
4 Results
4.1 Photometric and morphological properties
We provide integrated photometric parameters and colour maps for the 48 galaxies identified as definitive members of the cluster. Surface photometry, profile decomposition and fundamental relations will be discussed in a forthcoming paper. As previously discussed, the galaxies selected inside the virial radius of a relaxed cluster and in its redshift range have a large probability of being early-type galaxies, i.e., ellipticals or lenticulars.
From the Megacam images, we perform a simplified morphological classification by visual inspection, determining if the galaxy is an elliptical, S0, Sa, or late-type spiral. Morphological types are always evaluated with a scatter of about one type given the uncertainty on this measurement, so, in some cases, we kept two possible types. This classification is reported in Table 1 of Appendix A. We have found only two galaxies to be of a later type than Sa and one has been classified as SBa. The 45 other galaxies can be considered as real, early-type galaxies. Even if our sample is not completely representative of the whole population of the cluster because some observational constraints (avoidance of bright objects and some limitations due to the FLAMES/Giraffe positioner) have been set, the morphological segregation is observed as expected in a cluster core.
Since the range in absolute magnitude [] covers the limit between intermediate luminosity and dwarf galaxies, we split the sample into three different subsets: the brightest representatives corresponding to the intermediate luminosity galaxies of Bender et al. (1992) with (among our full sample ten galaxies belong to this subset), a transition subsample with between and mag (the classification is given as dS0/S0 or dE/E depending whether the galaxy is found to be lenticular or elliptical; this subset contains eight galaxies), and finally, the real, early-type dwarf set with (28 objects, i.e., 57 percent of the whole sample). Among all three subsets, the galaxies are at different projected distances from the cD (taken as the centre of the cluster). The morphological classification seems pertinent for the brightest objects, but we will not discuss the separation between dS0 and dE, as suggested by Lisker et al. (2007) who assigned a common abbreviation “dE” to this rather heterogeneous class of faint galaxies. They concluded their study by evidencing various subclasses of dEs, and we will examine our sample in such a context.
We have applied an elliptically-smoothed unsharp masking technique (e.g. Lisker et al. 2006a) to the CFHT/Megacam images of our galaxies to search for embedded structures. Using different smoothing radii (semi major-axes of ellipses) from 0.3 to 4 arcsec, we classified all the objects into three categories: no, weak, and strong embedded structures. They included bar, disc, spiral arms, and ring types (see Tab 1). Nine and five objects were found to have strong and weak embedded structures, respectively. We stress that only one galaxy with shows strong embedded structures and three other faint objects have weak ones; on the other hand, brighter objects often exhibit strong and complex structures, not observed in fainter early-type dwarfs.
Among the nine objects with strong embedded structures two sets of three galaxies are found relatively near each other in projection but with very different radial velocities. The first set (ACO496J043308.85-130235.6 (G-02), ACO496J043320.35-130314.9 (G-06) and ACO496J043321.37-130416.6 (G-07)) is located at the northern limit of the X-ray halo (see Fig. 12 of Tanaka et al. 2006); the second set (ACO496J043326.49-131717.8 (G-13), ACO496J043331.48-131654.6 (G-15) and ACO496J043333.53-131852.6 (G-18)) is in the south near the cluster centre, in a region where the X-ray surface brightness is seen in excess compared to its azimuthally averaged value and corresponding to a cold front. However, we interpret the set of three galaxies projected on the cluster core as three objects only seen close in projection (see notes for each galaxy in Appendix A). In both cases, the existence of a real group of galaxies has to be tested.
Concerning the galaxies with weak embedded structures, one of them is the brightest object found among a group of four galaxies in our spectroscopic sample, which are all in the same region of the sky about 400 kpc north of the cD. As discussed in the notes of Appendix A, ACO496J043348.59-130558.3 (G-32), ACO496J043343.04-130514.1 (G-28), ACO496J043345.67-130542.2 (G-30) and ACO496J043349.08-130520.5 (G-33) probably belong to a real group since their radial velocities are close to each other.
Finally, eight dwarf galaxies with mag exhibit spiral arms, bars, rings, or edge-on discs similar to the structural properties defined by Lisker et al. (2006a) in the dwarf population of the Virgo cluster, corresponding to 24 percent for a total number of 34 dEs in the spectroscopic sample of Abell~496; this value is larger than the percentage given by Lisker et al. (2007) for their dE(di) subclass, but it can be explained by a bias toward bright galaxies in our sample. Another subclass pointed out by Lisker et al. is that of dEs with blue centres which exhibit recent or ongoing central star formation. Three objects are seen on the colour maps with such a property; all of them are rather flattened galaxies compared to the other dwarfs and could perfectly correspond to the flattened spheroid invoked by Lisker et al. (2006b) to explain their subclass of dEs with blue cores. A last subclass defined in the Virgo cluster is obtained by separating the “featureless” dE class into nucleated and non-nucleated galaxies. Since Abell 496 is more distant than Virgo, the identification of a nucleus is more difficult to define with the same precision in terms of flux and size. From unsharp masks we can identify the galaxies where strong gradients are observed in the central regions; nine dwarf galaxies with mag present bright compact components in their centres, one of them having a bright blue core. Compared to the Virgo dwarf study, the estimated number of nucleated objects missed could be larger because we cannot be sure that small size nuclei are not smoothed by the seeing effects. In the following subsection we will discuss the results of the spectroscopic data in terms of age of the central stellar population; another subclassification will be proposed to provide tests for formation and evolution scenarii.
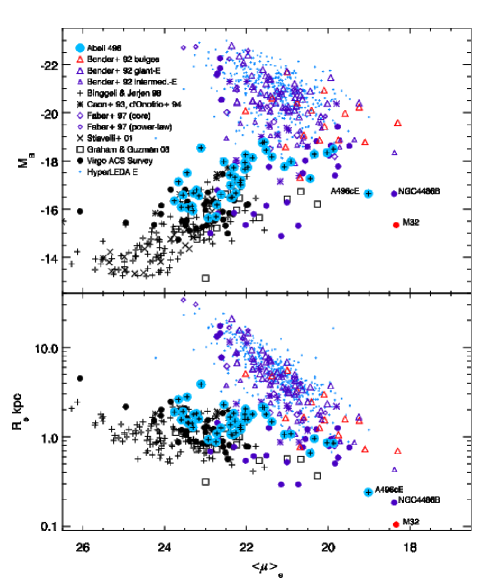
Figure 2 presents the updated versions of Figs. 9a,g from Graham & Guzmán (2003): absolute magnitude and effective radius versus mean surface brightness within the effective radius , with the Abell~496 galaxies superimposed. The plot contains literature data only for elliptical galaxies and bulges of lenticulars/spirals (where the bulge/disc decomposition has been made in the original papers). All integrated measurements for spiral and lenticular galaxies have been excluded. Data in computer-readable format for dE and E galaxies from Binggeli & Jerjen (1998), Caon et al. (1993), D’Onofrio et al. (1994), Faber et al. (1997), Graham & Guzmán (2003), Stiavelli et al. (2001) and homogenization algorithms for these datasets have been kindly provided by A. Graham. We also included photometric parameters of E and dE/dS0 galaxies from the Virgo Cluster ACS Survey (Ferrarese et al. 2006); photometric data on giant, intermediate elliptical galaxies and bulges of spirals and lenticulars from Bender et al. (1992); photometric parameters of the Sérsic component of M~32 (Graham 2002); and data for 430 elliptical galaxies from the HyperLeda111http://leda.univ-lyon1.fr/ database (Paturel et al. 2003), with radial velocities below 10000 km s-1 and brighter than mag.
The well-known structural dichotomy between diffuse dwarf galaxies and classical ellipticals and bulges is clearly visible on both plots in Fig. 2. A sequence of classical elliptical galaxies starts with the most luminous cluster galaxies at fainter surface brightnesses and ends with a few compact elliptical galaxies (M 32-like objects) at high surface brightnesses. At the same time, diffuse dwarf elliptical galaxies form a separate sequence. We notice that the counter-arguments againt this interpretation of the structural diagrams exist (e.g. Graham & Guzmán 2003). It is remarkable that over a large span of absolute magnitudes ( mag) diffuse galaxies show no correlation between effective surface brightness and effective radius: always remains between 0.6 and 2.0 kpc (see bottom panel). A number of objects, the brightest representatives of our sample, lie in the transition region between the two regimes (“normal” and “diffuse” ellipticals).
4.2 Kinematical properties
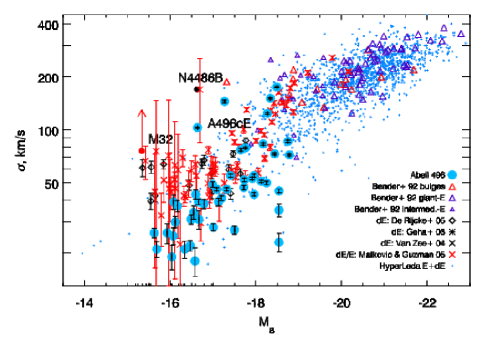
The Faber-Jackson relation (Faber & Jackson 1976), reflecting the connection between the dynamical and stellar masses, is shown in Fig. 3. We present a compilation of data for dwarf (Geha et al. 2003; van Zee et al. 2004; De Rijcke et al. 2005; Matković & Guzman, 2005), intermediate luminosity, and giant elliptical galaxies and bulges of bright lenticulars (Bender et al. 1992).
Matković & Guzmán (2005) have analysed a sample of mostly dwarf and low-luminosity elliptical galaxies () in the Coma cluster. In order to have accurate B magnitudes for these galaxies, we retrieved the photometric catalogue of galaxies in the direction of Coma222http://cencosw.oamp.fr/ (Adami et al. 2006) and cross-correlated it with the Matković & Guzmán catalogue. Values for 66 matched objects have been used in Fig. 3.
Some objects of our sample located below the bulk of galaxies in the luminosity range between and mag are mostly lenticular galaxies with large discs, therefore, their velocity dispersions tend to be lower (e.g., ACO496J043306.97-131238.8 (G-01)).
We observe a population of objects with higher velocity dispersions than expected for their luminosities. Most of them are located in the inner 80 kpc from the cluster centre and exhibit quite unusual stellar populations. We will discuss their origin and evolution below.
We found a number of Abell~496 objects, located systematically below dE galaxies in the literature. Since most of the studies (apart from Geha et al. 2003) were based on spectroscopy with significantly lower spectral resolution than FLAMES/Giraffe, we cannot exclude the possibility of systematic errors on velocity dispersions for low- objects in the literature due to a template mismatch (-metallicity degeneracy, see Chapter 1 in Chilingarian 2006).
4.3 Stellar population properties
Our fitting method is not sensitive to the presence or absence of the H feature in the spectral range: though age estimations have higher uncertainties when H is not included, they remain unbiased (see Appendix B for details).
To fit the spectra we use the PEGASE.HR synthetic populations built using the ELODIE.3 library including only stars in the nearest solar neighborhood. These stars are known to have [Mg/Fe] correlated with their [Fe/H] metallicities (see Wheeler et al. 1989 and references therein). Thus fitting spectra of galaxies with non-solar [Mg/Fe] for metallicities higher than dex results in a template mismatch that can bias our estimations of stellar population parameters. To quantify possible biases and study the effect in detail we used spectra of early-type galaxies from the Sloan Digital Sky Survey Data Release 6 (Adelman-McCarthy et al. 2008). See Appendix B for details.
To obtain [Mg/Fe] abundance ratios for the Abell~496 galaxies and to check whether our age and metallicity estimations are correct we used stellar population models dealing with Lick indices of magnesium and iron (Thomas et al. 2003). In order to compute Lick indices we degraded the spectral resolution to match that needed to compute Lick indices (Worthey et al. 1994, Thomas et al. 2003) by convolving the original spectra with a Gaussian having a width equal to the square root of the differences between the squares of the Lick resolution (), LSF () and velocity dispersion values found by the spectral fitting procedure (): . One should also apply a velocity dispersion correction for large galaxies, when the intrinsic broadening of the spectral lines exceeds the Lick resolution. All the objects in our sample have relatively low velocity dispersions, therefore these corrections were not necessary. A similar approach to compute Lick indices has been used by Kuntchner et al. (2006). The spectral range of FLAMES/Giraffe in the setup we used and the mean heliocentric redshift of the cluster allow us to compute the following Lick indices: Fe5015, Mg, Fe5270, Fe5335, and Fe5406. Uncertainties on the measurements were computed according to Cardiel et al. (1998).
There are three sources of systematic errors that can affect the measurements of Lick indices: (1) data reduction issues resulting in additive errors, such as problems with the diffuse light or sky subtraction; (2) difference in the spectral resolution between given observations and the Lick/IDS system; (3) uncertainties in the determination of the radial velocities.
The diffuse light subtraction for FLAMES/Giraffe is done with a high accuracy thanks to the rather sparse packing of the MEDUSA fiber traces on the CCD plane, therefore, it cannot result in significant errors. We observed the sky simultaneously with the galaxies in different parts of the field of view, so it is possible to assess the quality of sky subtraction by comparing individual sky spectra obtained in different fibers. No systematic difference is observed, we therefore conclude that the sky subtraction procedure is reliable.
The radial velocities and velocity dispersions of the Abell~496 galaxies are measured with high accuracy, due to the fact that the the FLAMES/Giraffe LSF has almost infinite resolution in terms of square differences, compared to the Lick/IDS system.
We also notice, that in the course of this study to analyze Lick indices for both FLAMES/Giraffe and SDSS spectra (see Appendix B), we use the models by Thomas et al. (2003), rather than the models by Worthey et al. (1994). Therefore, converting the computed values of Lick indices into the Lick/IDS system through the observations of the Lick/IDS stars is not necessary. Moreover it was not possible to perform this empirical conversion because Lick stars have not been observed.
The measurements of the Lick indices are presented in Appendix A (Table 3).
There have been a number of recent studies (Gallazzi et al. 2006; Smith et al. 2006; Yamada et al. 2006; Carretero et al. 2007) addressing correlations between galaxy absorption line strengths and velocity dispersions. Most of them are based on observations obtained with multi-object spectrographs with fixed spatial aperture sizes (as in the present study). Although this observational technique allows for the acquisition of spectra of many objects during a single exposure time, it has some disadvantages when studying stellar populations. Early-type galaxies (giants and dwarfs) and bulges of spirals are known to have rather strong metallicity gradients (see, e.g., Sánchez-Blázquez et al. 2006c) and often evolutionary decoupled nuclei (e.g., Sil’chenko 2006; Chilingarian et al. 2007b; 2008b; Peletier et al. 2007). Young and/or metal-rich stellar populations in nuclei will not strongly affect the aperture measurements for galaxies located 100 Mpc or further, because their spatial sizes are small and contributions to the total fluxes within a 1.5 arcsec-wide aperture are negligible, metallicity gradients may bias the results quite strongly.
If members of a given cluster of galaxies are analyzed, the scale of the gradient will depend on their effective radii, which are rather tightly connected to luminosities. At the same time since luminosities of early-type galaxies correlate with central velocity dispersions (Faber & Jackson 1976), for low- objects the same aperture size in average will contain a larger fraction of the galaxy, leading to an underestimation of the central or effective metallicity. This may cause a change in the slope of the Mg- relation, especially for fainter objects (making it steeper). On the other hand, the velocity dispersion also varies with radius; however, for low-luminosity and dwarf galaxies, -profiles turn to be almost flat (Simien & Prugniel 2002; Geha et al. 2002; Geha et al. 2003; van Zee et al. 2004). Therefore, while the aperture effect may not be very important for giant galaxies (as mentioned in Gallazzi et al. 2006) because the gradient will compensate the metallicity gradient; it may be important for dwarfs and intermediate luminosity objects.
When many clusters of galaxies at different redshifts are observed with the same instrument (e.g., Gallazzi et al. 2006; Smith et al. 2006) the aperture effect will increase the spread of absorption line strength measurements for a given velocity dispersion.
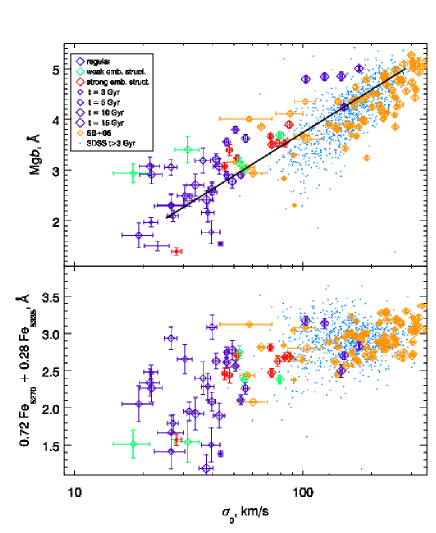
In Fig. 4, we present the measurements of Mg and Fe = 0.72 Fe5270 + 0.28 Fe5335 versus velocity dispersion. We also put measurements for 700 early-type galaxies older than 3 Gyr with redshifts observed in the SDSS on the same plots. We have used values of Lick indices provided by the SDSS. The solid line on the Mg- diagram corresponds to the best-fitting relation from the National Optical Astronomical Observatory (NOAO) Fundamental Plane Survey (NFPS, Smith et al. 2006). Measurements for a sample of early-type galaxies from Sánchez-Blázquez et al. (2006a,b,c), kindly provided by P. Sánchez-Blázquez in a computer readable form, are shown in orange. There is relatively good agreement between NFPS, SDSS, Sánchez-Blázquez et al. (2006a), and the correlation we find for Abell~496 galaxies. Our objects tend to be slightly richer in magnesium, in contrast to the SDSS ones. In our case, we have observed mostly galaxies near the Abell~496 cluster core, while in the case of NFPS, galaxies have been observed in the peripheral parts of the clusters as well, and for SDSS there was a number of group and field galaxies (since we did not apply any environmental selection criteria). Smith et al. (2006; see also Sil’chenko 2006, for an application to lenticular galaxies) demonstrated that objects in the cores of clusters tend to be above the average line, and conversely, galaxies populating less dense environments are less metal-rich.
We notice four high- outliers from the Abell~496 sample significantly above the sequence of Smith et al. (2006) in the Mg- plot. Those objects (ACO496J043333.17-131712.6 (G-17); ACO496J043337.35-131520.2 (G-20); ACO496J043338.22-131500.7 (G-21); ACO496J043341.69-131551.8 (G-24)) are all located in the innermost part of Abell~496 and have probably experienced strong tidal harassment (see discussion).
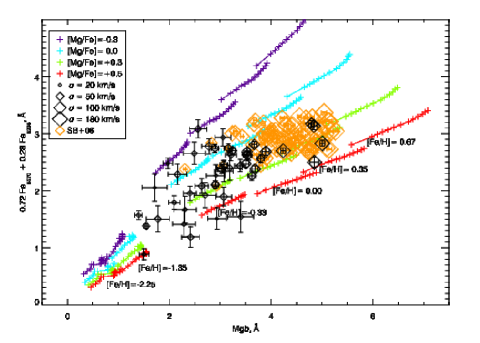
The Fe versus Mg relation is shown in Fig. 5. The sizes of symbols reflect values of the velocity dispersion. The data for early-type galaxies from Sánchez-Blázquez et al. (2006a,b,c) are overplotted. The models of Thomas et al. (2003) for [Mg/Fe] dex are shown as crosses; each sequence includes models for an indicated metallicity and ages from 3 to 15 Gyr (bottom-left to top-right). Nearly all objects with low velocity dispersions exhibit solar [Mg/Fe] ratios (the corresponding models are shown in cyan). High- objects have [Mg/Fe]0.2 dex and, in general, tend to have higher metallicity values.
In Appendix B, we demonstrate that non-solar [Mg/Fe] ratios bias neither age, nor metallicity estimations obtained by spectral fitting in the wavelength range of FLAMES/Giraffe. Indeed, the measurements do suffer from the well-known age-metallicity degeneracy (see, e.g., Worthey 1994) expressed as or . In Appendix A, we provide maps of in the age-metallicity space for every object in our sample. The elongated shape of the minima, corresponds exactly to the expected degeneracy.
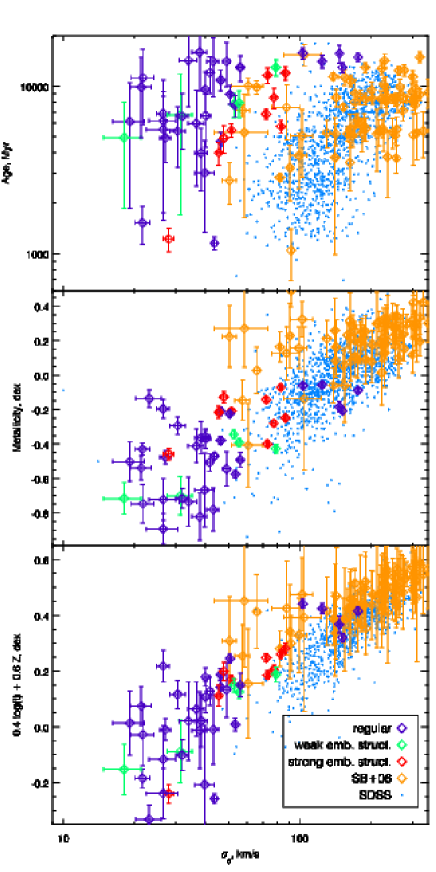
In Fig. 6, we compare the age and metallicity estimates versus velocity dispersion for Abell~496 galaxies and for the samples of SDSS objects mentioned above and early-type galaxies from Sánchez-Blázquez et al. (2006a). We used the values from Sánchez-Blázquez obtained by inverting the grid of the H and MgFe Lick indices. The top panel presents versus . Abell~496 galaxies are systematically older than objects from the SDSS sample and the spread of ages is quite large. However, we note (a) the absence of young galaxies with high velocity dispersions; (b) the fact that small galaxies (with low velocity dispersions) tend to be younger than large ones; and (c) the spread of age estimates is larger for low-mass objects. Two explanations for the offset between the Abell~496 galaxies and the two other samples on the top panel are the environmental effects and the sample selection. We have selected the SDSS galaxies with a minimal signal-to-noise ratio, so dwarf galaxies have been nearly automatically excluded. On the other hand, we confirm from our sample (which includes the galaxies in the central region of a massive cluster) that intermediate-luminosity objects tend to be older in dense environments, since we find very few objects there younger than 10 Gyr having km s-1.
Metallicity versus (middle panel of Fig. 6) exhibits a much stronger correlation than age vs . The Abell~496 galaxies appear to be almost on the low- extension of the sequence of the SDSS galaxies, although there are several faint Abell~496 dwarfs with rather high metallicities. The bottom panel in Fig. 6 shows a combination of age and metallicity giving an edge-on view of the age-metallicity degeneracy: versus velocity dispersion. The correlation becomes much tighter than -, and loci of Abell~496 and SDSS galaxies follow the same correlation. The spread of points (standard deviation) for a given value of the velocity dispersion is less than 0.1 dex. A number of outliers in the Abell~496 sample are seen: two galaxies in the high- area, located in the very centre of the cluster (A496cE and A496g1 using the terminology from Chilingarian et al. 2007c); and three dwarf galaxies (ACO496J043324.61-131111.9 (G-08); ACO496J043339.07-131319.7 (G-22); and ACO496J043355.55-131024.9 (G-37)). This quantity, , is considered an indicator of the average strength of absorption lines in the spectrum.
There are seven galaxies in our sample exhibiting relatively young stellar populations ( Gyr): ACO496J043321.37-130416.6 (G-07); ACO496J043325.54-130408.0 (G-12); ACO496J043334.54-131137.1 (G-19); ACO496J043350.17-125945.4 (G-34); ACO496J043351.54-131135.5 (G-35); ACO496J043356.18-125913.1 (G-38); and ACO496J043415.37-130823.5 (G-46). Three of them, ACO496J043321.37-130416.6 (G-07); ACO496J043356.18-125913.1 (G-38); and ACO496J043415.37-130823.5 (G-46) have narrow [OIII] emission lines in the spectra ( between 20 and 40 km s-1) and there is no evidence for the [NI] (=5199Å) line in at least two of them, suggesting ongoing star formation rather than shocked gas. The first two, as well as ACO496J043351.54-131135.5 (G-35), contain blue spatially unresolved central regions clearly visible on colour maps. This can be considered as an argument for the presence of young stars and/or star formation only in the cores of the galaxies. All seven galaxies are located quite far from the cluster centre (projected distances are 150 – 200 kpc for ACO496J043334.54-131137.1 (G-19) and ACO496J043351.54-131135.5 (G-35) and kpc for the other five).
A significant fraction of galaxies (13 of 46) exhibit red spatially unresolved cores in the colour maps. Stellar populations of these objects determined by spectral fitting are rather old and metal rich, none of the spectra shows emission lines. In some cases (ACO496J043320.35-130314.9 (G-06); ACO496J043331.48-131654.6 (G-15); ACO496J043333.53-131852.6 (G-18); ACO496J043342.10-131653.7 (G-25); ACO496J043346.71-131756.2 (G-31); and ACO496J043401.57-131359.7 (G-40)) the red cores represent the central parts of extended bar-like structures, clearly visible on colour maps, which are redder than the outer parts of their host galaxies. However, in most of the other red-core galaxies only the cores show peculiar colours, while the discs/spheroids look more or less uniform on the maps. In the case of ACO496J043306.97-131238.8 (G-01), an edge-on disky galaxy, dust absorption is responsible for the redder colour of the central region.
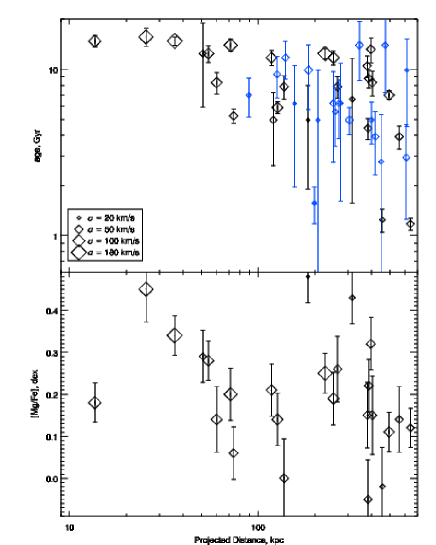
Trying to relate the presence of embedded structures (discs, spiral arms, bars) to the stellar population parameters, we stress that the majority of the galaxies exhibiting embedded structures have luminosity-weighted ages of between 4 and 10 Gyr (only ACO496J043346.71-131756.2 (G-31) and ACO496J043403.19-131310.6 (G-41), with bars and faint spiral arms, are about 14 Gyr old, but their absolute blue magnitude is below mag; ACO496J043321.37-130416.6 (G-07) is a young star-forming galaxy) and all of them have features visible on colour maps. No objects with embedded structures are found in the very inner part of the cluster ( kpc) where the luminosity-weighted ages of the five galaxies in our sample are above 12 Gyr. In Fig. 7, the ages and -enhancements of galaxies at different projected distances from the Abell~496 centre are shown. In a transition area ( between 60 and 230 kpc) the age of the youngest stellar populations decreases when the projected distance increases, as it can be seen in Fig. 7. Half of the galaxies with embedded structures are found in this area but some of them could have a distance to the cluster centre larger than their projected distance. In the bottom panel of Fig. 7, the ratio of -elements over iron in the transition area is not as large as for the innermost part of the cluster and spreads over the same range as for galaxies at larger projected distances.
In their study of Virgo early-type dwarf galaxies, Lisker et al. (2007 and references therein) do not give the stellar population properties of the three subclasses, which are the result of infalling galaxy transformation. If we put together the eight dwarfs corresponding to their dE(di) subclass and the five other dwarfs, which exhibit very young central stellar populations, this subsample presents the same spatial and velocity distributions as their least unrelaxed dwarf galaxy population. The velocity histogram is more spread for the 13 selected dwarfs compared to that of the 24 remaining early-type dwarfs, including the two galaxies for which we did not succeed to fit the spectra due to low signal-to-noise ratios. If we also take into account their corresponding spatial distributions, we can conclude that the subclass is probably not fully relaxed. A clear difference exists in the stellar population ages, since among the 22 dwarfs with no embedded structures, only six galaxies have ages between 3 and 9 Gyr.
The brighter part of our sample can be compared to existing studies of stellar populations of early-type galaxies. Poggianti et al. (2001) presented the luminosity-weighted ages and metallicities for several dozens of Coma cluster early-type galaxies. From their Fig. 2, it is clear that there are two populations of galaxies, old and young. The age of the old ones for anticorrelates with the luminosity. In our sample, however, we do not have any bright galaxy with a young stellar population. This is probably due to the selection of objects in our sample: (1) we tried to avoid galaxies with redshifts already in the literature; (2) young galaxies have higher surface brightnesses compared to old ones for a given size, therefore, they have a better chance to have already been observed in redshift surveys with limited aperture magnitudes, and thus to be excluded from our sample.
Sánchez et al. (2007) have obtained internal kinematics and stellar population parameters for galaxies in the core of the Abell 2218 cluster using 3D-spectroscopy of the cluster centre. The behavior of age estimates is similar to that of the Abell~496 galaxies: for low-mass objects, ages tend to be younger and more spread out than for large galaxies.
5 Discussion
5.1 On the origin of dE/dS0 galaxies
We discuss here what we can learn from the stellar population properties of dE/dS0s in Abell~496 regarding their origin and evolution. First, what is the explanation for the spread in the stellar ages and metallicities of our dwarf galaxy sample? Is this spread related to some differences in the time needed for galaxies to be accreted into the cluster and to reach the cluster core? Low-mass galaxies are more sensitive than massive galaxies to both internal and external processes affecting their gas contents and star formation rates. Therefore, the “in situ” formation scenario, which is able to reproduce the various timescales for star formation, could work as well as an accretion scenario. Which scenario can explain that star formation occurs in the nuclear regions for a number of dwarfs? Star formation is driven in particular by the gas content, and if the gas is rapidly removed from its host galaxy, star formation can be stopped in a very short time. On the other hand, an infall of gas in the galaxy centre will induce star formation in the nuclear region. The scenario should also reproduce the observed [Mg/Fe] ratio and its relation with the velocity dispersion.
Three possible scenarii for the gas removal usually considered for dE galaxies are: (1) supernova-driven winds at the early stages of galaxy evolution (Dekel & Silk 1986); (2) ram pressure stripping by the intra-cluster medium (e.g., Marcolini et al. 2003); and (3) tidal harassment due to distant and repeated encounters with other cluster members (Moore et al. 1998). The first one is often referred to as “internal” and latter two as “external” agents of dE galaxy formation and evolution.
The idea of supernova-driven winds is based on the assumption that the gravitational field of dwarf galaxies is not sufficiently strong to keep the interstellar medium from being swept out by SN II explosions during the first intense star formation episode.
Several different models for galactic winds exist (see De Rijcke et al. 2005 for a detailed review). Simple models discussed in Yoshii & Arimoto (1987) lead to abrupt gas loss and interruption of the star formation episode after a short time ( years). Consequently, later explosions of SNIa on a timescale of gigayears will not contribute to the iron enrichment of the stellar population (Matteucci 1994). Thus, a short star formation episode will lead to an overabundance of -elements over iron ([/Fe] 0). This phenomenon is observed in globular clusters and, usually, in giant early-type galaxies (Kuntschner et al. 2006, Sil’chenko 2006). If gas is removed from dE galaxies by supernova-driven winds, we would expect to see [Mg/Fe]0 dex, and it should anticorrelate with the dynamical mass of galaxies (or ). This does not agree with what we see in our data.
Another study by Chiosi & Carraro (2002), contrary to Yoshii & Arimoto (1987), predicts very long and oscillating star formation histories in dwarf galaxies: supernova explosions disperse the gas, stopping star formation, but later the gas cools down, falls back in and another star-formation episode begins. In this case, the [Mg/Fe] ratios decrease to 0 dex, the correlation between the dynamical mass and metallicity can be explained by the lower efficiency of star formation in galaxies of lower masses due to more efficient supernova feedback. However, under this scenario, one would not observe any old dwarf ellipticals because younger stars, formed in the secondary episodes of star formation, would dominate the light even though their masses might be low compared to the masses of the first generation of stars. Therefore, one still needs a mechanism to sweep out the remaining gas from the low-mass galaxies earlier or later during their lifetime.
In the case of Abell~496, [Mg/Fe]0 dex for nearly all low-mass objects (60 km/s), meaning that the star formation epoch durations were at least 12 Gyr, the minimal required time to complete the iron enrichment (Matteucci 1994). Hence, we cannot consider the scenario of gas removal by supernova-driven winds as the only explanation for the observed properties of dE galaxies, although it allows us to reproduce the observed mass-metallicity correlation.
Ram-pressure stripping of late-type dwarf galaxies (dIrr) or dwarf spirals appears to be an acceptable way to remove the gas from dE progenitors. If we assume that late-type galaxies have formed outside the central region of the cluster, and later fell onto it, sufficient time is left for iron enrichment, since the typical infall time is a few Gyr. If ram-pressure stripping plays the leading role in gas removal, one would expect a large spread of luminosity-weighted ages for low-mass objects that can be completely stripped during their first passage through the cluster centre. This stripping can occur at any moment during the galaxy lifetime. Due to our small sample we cannot give a decisive answer to whether the spread of age estimations in Fig. 6 is the result of ram-pressure stripping of late-type progenitors, or due to the low quality of measurements (including the age-metallicity degeneracy effects).
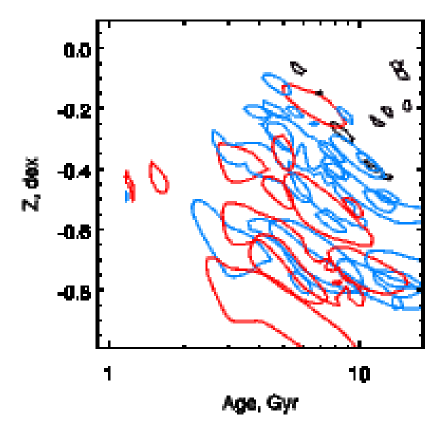
Smith et al. (2007) pointed out that there is a conspiracy in the sense that the distribution of galaxies in the plane at fixed velocity dispersion is aligned with the age-metallicity degeneracy. In Fig.8, we plotted the relationship between age and metallicity for different intervals of sigma with the Smith et al. sample of faint red galaxies in three clusters located inside the Shapley Supercluster. We choose two intervals in the same range and separately present the galaxies where sigma is lower than 30 km s-1 (not found in the Smith et al. survey). For the two intervals we had in common with the Smith et al. survey, we confirm the existence of the age-metallicity anticorrelation for fixed velocity dispersion. The spread in age is not due to the age-metallicity degeneracy since the measurement errors account for less than one fourth of the dispersion when 30 km s-1. For lower velocity dispersions the spread in metallicity is clearly not due to degeneracy and the SSP model cannot be applied if star formation occurs at low rate, but during a significant period of time. Note the peculiar location of four galaxies with high sigma values, high metallicities, and old ages.
The existence of cores of various colours in a number of dE/dS0 galaxies of our sample are related to the young nuclei in dE galaxies, which were recently discovered in three dwarfs in the Virgo cluster (Chilingarian et al. 2007b) and in a low-luminosity S0 in a group (Chilingarian et al. 2008b). They proposed that ram-pressure stripping is a way to expel the ISM from the outer parts of a low-mass disc galaxy (dE progenitor), and, at the same time, to compress the gas and to induce star formation in the dense nuclear region. Depending on the time and duration of this phenomenon, the colour of the nuclear region can be blue (when the star formation event is still going on or has finished recently) or red (if the star formation period ended long ago, so only the metallicity excess can be easily detected). Although the quantitative modelling of this phenomenon is quite complex and requires extensive numerical simulations, qualitatively, we consider the presence of cores of various colours in our sample of dE galaxies as an argument for the ram-pressure stripping scenario.
The presence of faint embedded discs in some galaxies is another strong argument for an evolutionary connection between early- and late- type dwarf galaxies. This result is in agreement with N-body modelling of morphological evolution of late-type galaxies in clusters (Mastropietro et al. 2005), suggesting that discs will not be completely destroyed. This is supported by the fact that embedded structures are revealed only in brighter dE galaxies, which are more resistant to tidal harassment.
From the correlations among early-type galaxies in the SDSS Clemens et al. (2006) found that the metallicity grows monotonically with and interpreted this correlation as due to the stellar mass build-up being regulated by the halo mass. We confirm this trend, which was also noticed by other studies, but find that the environment plays an important role for suppressing star formation in dwarf ellipticals and causing morphological transformation as revealed in nearby clusters (e.g., Michielsen et al., 2008).
Our main conclusion is that dE galaxies have late-type progenitors and have formed in the peripheral parts of the cluster, experiencing tidal interactions with the cluster potential and other cluster galaxies, as well as ram-pressure stripping while crossing the cluster centre.
5.2 Galaxies in a dense environment
There are five galaxies belonging to Abell~496 located above the bulk of objects in the Faber-Jackson relation (Fig. 3). Four of them (ACO496J043333.17-131712.6 (G-17); ACO496J043341.69-131551.8 (G-24); ACO496J043337.35-131520.2 (G-20); ACO496J043338.22-131500.7 (G-21)) are located within 100 kpc of the cD in projected distance, while the fifth one (ACO496J043401.57-131359.7 (G-40)) is located at 240 kpc. All five objects have a number of common properties: (1) old stellar populations (12 Gyr); (2) very high Mg abundances (Mg Å) and [Mg/Fe] abundance ratios (0.18 [Mg/Fe] 0.45 dex); (3) high surface brightnesses and structural properties in the continuity of those of normal ellipticals and bulges of spirals (Fig. 2). These objects are all ellipticals and show high surface brightness red cores in their colour maps and no embedded structures. Four of them are notably above the Mg correlation from Smith et al. (2006), while the fifth one (ACO496J043401.57-131359.7 (G-40)) falls exactly on the correlation. The latter object is the one located 240 kpc from the cD and is the only elongated one; its properties are therefore not as extreme as those of the four other galaxies.
As evidenced in Fig. 7, we note the complete avoidance of the inner region of the cluster by young galaxies. That Abell~496 is a dynamically relaxed cluster explains this effect: all the galaxies we observe now in the central region of the cluster have been captured a long time ago by the cluster potential.
We translate the [Mg/Fe] ratio into duration of the starburst using prescriptions from Thomas et al. (2005). According to their formula 4, [Mg/Fe]=0.45 dex corresponds to 30 Myr and [Mg/Fe]=0.3 dex to 250 Myr. The four objects described above have high Mg abundances for their velocity dispersions (which are already too high for their luminosities), but normal iron abundances and average metallicities. This suggests that when Mg was produced these galaxies were more massive than now, and environmental effects have occurred before the production of iron, i.e. during the first 1 Gyr of their evolution. In view of their proximity to the cD, such properties can be explained by tidal stripping during their infall onto the cluster centre. The most extreme cases are compact ellipticals such as ACO496J043337.35-131520.2 (G-20) that we discovered in this cluster (Chilingarian et al. 2007c), which may have lost up to 90% of its stellar mass. The progenitors of the three other galaxies have undergone stellar mass loss as well, although not as strong. If we combine all the information derived from the kinematics and stellar population analyses, we estimate the progenitor luminosities to range between mag for cE (G-20) and mag for ACO496J043341.69-131551.8 (G-24). The similar process applied to fainter early-type galaxies (nucleated dE’s or dS0’s) may lead to the formation of ultra-compact dwarfs (Bekki et al. 2003) or UCD/cE transitional objects, as the one found by Chilingarian & Mamon (2008). Another unusual galaxy in the cluster centre (54 kpc from the cD in projection) is ACO496J043332.07-131518.1 (G-16): it has an extreme value of [Mg/Fe] (+0.28 dex) for its velocity dispersion ( km s-1) and luminosity ( mag). Taking into account its old population (14 Gyr), it probably has an origin similar to that of the four galaxies discussed above.
Objects close to the cluster centre are, therefore, strongly affected by their high-density environment in the central part of the cluster. We can make a rough estimate for the lower limit of the total dynamical mass in the centre of the cluster by taking the radial velocity of ACO496J043333.53-131852.6 (G-18) and assuming it is on a circular orbit observed perpendicular to the line of sight with a radius of 130 kpc. This will result in a value of that is consistent with the total mass estimate from the analysis of X-ray data, which gives within 150 kpc (T. F. Lagana et al. in preparation).
6 Conclusions
We have conducted an analysis of spectral and photometric data for a unique sample of dwarf early-type galaxies extending toward small objects having low velocity dispersions, down to km s -1.
Although dwarf elliptical and lenticular galaxies with shallow brightness profiles are structurally different from the “classical” elliptical galaxies and bulges of spirals forming the Kormendy relation, their stellar population properties seem to follow and extend known correlations of absorption line strengths, metallicity, and age versus .
Low-mass galaxies ( km s -1) show solar [Mg/Fe] element abundance ratios, arguing for long durations of the star formation episodes (1.5 Gyr)
Based on the properties of the observed galaxies, we conclude that there must be an evolutionary connection between late- and early-type dwarf galaxies; external agents (ram-pressure stripping, harassment, etc.) must play a key role in the morphological transformation.
Evolution of even more massive galaxies residing in the central part of the cluster is ruled by environmental effects: tidal stripping of stellar discs by the cluster potential is one of the probable scenarii of formation and evolution of relatively compact and dense elliptical galaxies, observed only in the vicinity of the cD.
Acknowledgements.
We acknowledge support for IC’s PhD thesis in 2005–2006 by the INTAS foundation (project 04-83-3618). We are very grateful to the organizing committee of the conference “Mapping the Galaxy and Nearby Galaxies”, who provided IC with the financial support essential to attend the meeting and present preliminary results of this study. Additional support is given by the RFBR-Flaanders project 05-02-19805 on studies of dwarf elliptical galaxies (co-PI: O. Sil’chenko). Special thanks to the VO-Paris project (M.-L. Dubernet, P. Le Sidaner) for funding several short missions of IC to Paris during 2005–2006. We are grateful to the staff of the Terapix data centre at IAP, France, for their efficiency and competence in reducing our Megacam imaging data and to C. Marchais and N. Bavouzet for their help during the early stages of the spectroscopic analysis. This research has made use of (1) the NASA/IPAC Extragalactic Database (NED) which is operated by the Jet Propulsion Laboratory, California Institute of Technology, under contract with the National Aeronautics and Space Administration; (2) Aladin developed by the Centre de Données astronomiques de Strasbourg; (3) SAOImage DS9, developed by Smithsonian Astrophysical Observatory; (4) XMM Newton Science archive, operated by the European Space Agency. Special thanks to: A. Graham for critical reading of the manuscript and fruitful discussions, M. Koleva for useful suggestions regarding the spectral fitting technique; P. Sánchez-Blázquez for providing stellar population parameters for early-type galaxies in a computer-readable format; E. Slezak for making available to us his wavelet analysis software. We thank our anonymous referee for constructive comments.References
- Abadi et al., (1999) Abadi, M. G., Moore, B., Bower, R.G. 1999, MNRAS 308, 947
- Abell, (1958) Abell G.O. 1958, ApJS, 3, 211
- Adami et al. (2006) Adami C., Picat J.-P., Savine C. et al. 2006, A&A 451, 1159
- Adelman-McCarthy et al. (2008) Adelman-McCarthy J.K., et al. 2008, ApJS 175, 297
- Bekki et al. (2003) Bekki K., Couch W., Drinkwater M., Shioya Y., 2003, MNRAS 344, 399
- Bell at al. (2006) Bell E. F., Phleps S., Somerville R. S. et al. 2006, ApJ 652, 270
- Bender et al. (1992) Bender R., Burstein D., Faber S. M. 1992, ApJ 399, 462
- Binggeli & Jerjen, (1998) Binggeli B. & Jerjen H. 1998, A&A, 333, 17
- Boué et al. (2008) Boué G., Adami C., Durret F., Mamon G.A., Cayatte V. 2008, A&A 479, 335
- Bundy et al. (2006) Bundy K., Ellis R., Conselice C. J. et al. 2006, ApJ 651, 120
- Caon et al. (1993) Caon N., Capaccioli M., D’Onofrio M. 1993, MNRAS 265, 1013
- Capak et al. (2007) Capak P., Abraham R. G., Ellis R.S. et al. 2007, ApJS 172, 284
- Cappellari & Copin, (2003) Cappellari M.& Copin Y. 2003, MNRAS, 342, 345
- Cappellari & Emsellem, (2004) Cappellari M. & Emsellem E. 2004, PASP 116, 138
- Cardiel et al., (1998) Cardiel N., Gorgas J., Cenarro J., Gonzalez J. J. 1998, A&AS, 127, 597
- Carretero et al. (2007) Carretero C., Vazdekis A., Beckman J. E. 2007, MNRAS 375, 1025
- Chilingarian et al. (2005) Chilingarian I., Prugniel P., Sil’chenko O., Afanasiev V. 2005, proceedings of the IAUC 198, eds: Jerjen, H. & Binggeli, B., Cambridge University Press, 105
- Chilingarian (2006) Chilingarian I. 2006, PhD Thesis, Moscow State University – Université Claude Bernard Lyon [arXiv:astro-ph/0611893]
- (19) Chilingarian I., Prugniel Ph., Sil’chenko O., Afanasiev V. 2007a, MNRAS, 376, 1033
- (20) Chilingarian I., Sil’chenko O., Afanasiev V., Prugniel Ph. 2007b, AstL, 33, 292
- (21) Chilingarian I., Cayatte V., Chemin L. et al. 2007c, A&A 466, L21
- (22) Chilingarian I. V., Mamon G. A., 2008a, MNRAS 385, L83
- (23) Chilingarian I. V., Sil’chenko O. K., Afanasiev V. L., Prugniel P., 2008b, in Knapen J., Mahoney T., Vazdekis A., eds., proc. of ‘Pathways Through an Eclectic Universe”, in press, arXiv:0711.2100
- (24) Chilingarian I., Prugniel P., Sil’chenko O., Koleva M., in Stellar Populations as Building Blocks of Galaxies, Proceedings of IAU Symposium #241. Eds. A. Vazdekis and R. F. Peletier; Cambridge University Press, 2007d, 175
- Chiosi & Carraro (2002) Chiosi C. & Carraro G. 2002, MNRAS 335, 335
- Christlein & Zabludoff (2004) Christlein D. & Zabludoff A. I. 2003, ApJ 591, 764
- Christlein & Zabludoff (2004) Christlein D. & Zabludoff A. I. 2004, ApJ 616, 192
- Cimatti et al. (2006) Cimatti A., Daddi E. & Renzini A. 2006, A&A 453, L29
- Clemens et al. (2006) Clemens M. S., Bressan A., Nikolic B. et al. 2006, MNRAS, 370, 702
- Cowie et al. (1996) Cowie L. L., Songaila A., Hu E. M. & Cohen, J. G. 1996, AJ 112, 839
- Dekel& Silk (1986) Dekel A. & Silk J. 1986, ApJ 303, 39
- Djorgovski & Davis (1987) Djorgovski S. & Davis M. 1987, ApJ 313, 59
- De Rijcke et al. (2005) De Rijcke S., Michielsen D., Dejonghe H., Zeilinger W.W., Hau G.K.T. 2005, A&A 438, 491
- D’Onofrio et al., (1994) D’Onofrio M., Capaccioli M., Caon N. 1994, MNRAS 271, 523
- Dressler (1980) Dressler A. 1980, ApJ 236, 351
- Dupke & White (2003) Dupke R. & White R.E.III 2003, ApJ 583, 13
- Durret et al. (2000) Durret F., Adami C., Gerbal D. & Pislar V. 2000, A&A 356, 815
- Durret et al. (1999) Durret F., Felenbok P., Lobo C., Slezak E. 1999, A&AS 139, 525
- Durret et al. (2005) Durret F., Lima Neto G. B., Adami C. et al. 2005, Proc. Semaine de l’Astrophysique Francaise, Strasbourg, France, June 27 - July 1, 2005, Eds. Casoli et al., EdP-Sciences, Conference Series, 2005, p. 709
- Faber & Jackson (1976) Faber S.M. & Jackson R.E. 1976, ApJ 204, 668
- Faber et al., (1997) Faber S. M., Tremaine S., Ajhar E.A. et al. 1997, AJ 114, 1771
- Ferrarese et al., (2006) Ferrarese L., Côté P., Jordán A. et al. 2006, ApJS 164, 334
- Fukugita et al., (1995) Fukugita M., Shimasaku K., Ichikawa T. 1995, PASP 107, 945
- Gallazzi et al. (2006) Gallazzi A., Charlot S., Brinchmann J., White S. D. M. 2006, MNRAS 370, 1106
- Geha et al. (2002) Geha M., Guhathakurta P., van der Marel R. P. 2002, AJ 124, 3073
- Geha et al. (2003) Geha M., Guhathakurta P., van der Marel R.P. 2003, AJ 126, 1794
- Goto et al. (2003) Goto T., Yamauchi C., Fujita Y. et al. 2003, MNRAS 346, 601
- Graham, (2002) Graham A. 2002, ApJ 568, L13
- Graham et al., (2003) Graham A., Jerjen H., Guzmán R. 2003, AJ 126, 1787
- Graham & Guzman (2003) Graham A. & Guzmán R. 2003, AJ 125, 2936
- Gunn & Gott (1972) Gunn J. E. & Gott J. R. III. 1972, ApJ 176, 1
- Joseph et al. (2001) Joseph C.L., Merritt D., Olling R. et al. 2001, ApJ 550, 668
- Koleva et al. (2007) Koleva M. et al. 2007, in Knapen J., Mahoney T., Vazdekis A., eds., “Pathways Through an Eclectic Universe”, subm. (arXiv:0708.1716)
- Koleva et al. (2008) Koleva M., Prugniel Ph., Ocvirk P., Le Borgne D., Soubiran C., 2008, accepted to MNRAS, arXiv:0801.0871
- Kuntschner (2004) Kuntschner, H. 2004, A&A 426, 737
- Kuntschner et al. (2006) Kuntschner H., Emsellem E., Bacon R. et al. 2006, MNRAS 369, 497
- Larson et al. (1980) Larson R.B., Tinsley B.M & Caldwell C.N. 1980, ApJ 237, 692
- Le Borgne et al. (2004) Le Borgne D., Rocca-Volmerange B., Prugniel P. et al. 2004, A&A 425, 881
- (59) Lisker T., Grebel E.K., Binggeli B. 2006a, AJ 132, 497
- (60) Lisker T., Glatt K., Westera P., Grebel E.K. 2006b, AJ 132, 2432
- Lisker et al. (2007) Lisker T., Grebel E.K., Binggeli B., Glatt K. 2007, ApJ 660, 1186
- Malumuth et al. (1992) Malumuth E.M., Kriss G.A., Van Dyke Dixon W., Ferguson H.C., Ritchie C. 1992, AJ 104, 495
- Marcolini al. (2003) Marcolini A., Brighentini F., D’Ercole A. 2003, MNRAS, 345, 1329
- Mastropietro et al. (2005) Mastropietro C., Moore B., Mayer L. et al. 2005, MNRAS 364, 607
- Mathis et al. (2006) Mathis H., Charlot S., Brinchmann J. 2006, MNRAS 365, 385
- Matković & Guzmán (2005) Matković A. & Guzmán R. 2005, MNRAS 362, 289
- Matteucci (1994) Matteucci F. 1994, A&A 288, 57
- Michielsen et al. (2008) Michielsen D., Boselli A., Conselice C.J. et al. 2008, MNRAS 385, 1374
- Moore et al. (1998) Moore B., Lake G., Katz N. 1998 ApJ 495, 139
- Pasquini et al. (2002) Pasquini L., Avila G., Blecha A. et al. 2002, The Messenger, 110, 1
- Paturel et al. (2003) Paturel G., Petit C., Prugniel Ph. et al. 2003, A&A, 412, 45
- Peletier et al. (2007) Peletier R., Falcón-Barroso J., Cappellari M. et al. 2007, MNRAS 379, 445
- Poggianti et al. (2001) Poggianti B. M., Bridges T. J., Mobasher B. et al. 2001, ApJ 562, 689
- Pozzetti et al. (2007) Pozzetti L., Bolzonella M., Lamareille F. et al. 2007, A&A 474, 443
- Prugniel & Soubiran (2001) Prugniel P. & Soubiran C. 2001, A&A 369, 1048
- Prugniel & Soubiran (2004) Prugniel P. & Soubiran C. 2004, astro-ph/0409214
- Prugniel et al. (2005) Prugniel P., Chilingarian I., Sil’chenko O., Afanasiev V. 2005, proceedings of the IAUC 198, eds: Jerjen, H. & Binggeli, B., Cambridge University Press, 73
- Quintana & Ramirez (1990) Quintana H., Ramirez A. 1990, AJ 100, 1424
- Salpeter (1955) Salpeter E. 1955, ApJ 121, 161
- Sanchez et al. (2007) Sánchez S.F., Cardiel N., Verheijen M.A.W., Pedraz S., Covone G. 2007, MNRAS 376, 125
- (81) Sánchez-Blázquez P., Gorgas J., Cardiel N., González J. 2006, A&A 457, 787
- (82) Sánchez-Blázquez P., Gorgas J., Cardiel N., González J. 2006, A&A 457, 809
- (83) Sánchez-Blázquez P., Gorgas J., Cardiel N. 2006, A&A 457, 823
- Scarlata et al. (2007) Scarlata C., Carollo C. M., Lilly S. J. et al. 2007, ApJS 172, 494
- Schlegel et al (1998) Schlegel D.J., Finkbeiner D.P., Davis M. 1998, ApJ 500, 525
- Sil’chenko, (2006) Sil’chenko O. K. 2006, ApJ 641, 229
- Simien & Prugniel (2002) Simien F. & Prugniel P. 2002, A&A 384, 371
- Smith et al. (2006) Smith R. J., Hudson M., Lucey J., Nelan J., Wegner G. 2006, MNRAS 369, 1419
- Smith, Lucey and Hudson (2007) Smith R. J., Lucey J. R., Hudson M. J. 2007, Proceedings of IAU Symp. 245 “Formation and Evolution of Galaxy Bulges”, (Oxford, July 16-20 2007), Eds. M. Bureau, E. Athanassoula, and B. Barbuy, arXiv:0712.0274
- Stiavelli et al., (2001) Stiavelli M. Miller B.W., Ferguson H.C. et al. 2001, AJ 121, 1385
- Struble & Rood, (1987) Struble M.F. & Rood H.J. 1987, ApJS 63, 543
- Tanaka et al (2006) Tanaka T., Kunieda H., Hudaverdi M., Furuzawa A., Tawara Y. 2006, PASJ 57, 703
- Thomas et al. (2003) Thomas D., Maraston C., Bender R. 2003, MNRAS 339, 897
- Thomas et al. (2005) Thomas D., Maraston C., Bender R., Mendes de Oliveira C. 2005, ApJ 621, 673
- van der Marel & Franx (1993) van der Marel R.P., Franx M. 1993, ApJ 407, 525
- van der Marel et al. (1998) van der Marel R.P., Cretton N., de Zeeuw P.T., Rix H.-W. 1998, ApJ 493, 613
- van Zee et al. (2004) van Zee L., Skillman E.D., Haynes M.P. 2004, AJ 128, 121
- Wheeler et al. (1989) Wheeler J. C., Sneden C., Truran J. W. Jr 1989, ARA&A 27, 279
- Wolf et al. (2007) Wolf M. J., Drory N., Gebhardt K., Hill G. J. 2007, ApJ 655, 179
- Worthey (1994) Worthey G. 1994, ApJS 95, 107
- Worthey et al. (1994) Worthey G., Faber S.M., González J.J., Burstein D. 1994, ApJS 94, 687
- Yamada et al. (2006) Yamada Y., Arimoto N., Vazdekis A., Peletier, R. F. 2006, ApJ 637, 200
- (103) Yoshii Y. & Arimoto N. 1987, A&A 188, 13
- Ziegler (2000) Ziegler B.L. 2000, Reviews in Modern Astronomy 13: New Astrophysical Horizons, ed. R.E. Schielicke. Hamburg, Germany, Astronomische Gesellschaft, 211
Appendix A Atlas of 46 members of Abell~496.
| N | IAU Name | type | emb.str. | |||||
| mag | mag | mag | mag | mag | ||||
| 01 | ACO496J043306.97-131238.8 | -17.72 | SB0a/dS0 | (s):B+S | 19.090.03 | 17.670.04 | 17.080.04 | 16.680.04 |
| 02 | ACO496J043308.85-130235.6 | -18.54 | Sbc | (s):D | 18.230.02 | 16.850.03 | 16.230.03 | 15.850.03 |
| 03 | ACO496J043312.08-130449.3 | -16.55 | dE | - | 20.120.12 | 18.840.14 | 18.350.06 | 17.960.07 |
| 04 | ACO496J043317.75-131536.6 | -16.58 | dS0/dE | (w):S | 19.930.17 | 18.810.06 | 18.280.06 | 17.960.04 |
| 05 | ACO496J043318.95-131726.9 | -16.99 | dE | - | 19.810.05 | 18.400.03 | 17.960.06 | 17.660.06 |
| 06 | ACO496J043320.35-130314.9 | -18.78 | SB0 | (s):B/S/R? | 18.010.02 | 16.610.03 | 16.000.03 | 15.620.03 |
| 07 | ACO496J043321.37-130416.6 | -17.01 | dSB0a | (s):B/S/R? | 19.380.07 | 18.380.03 | 17.970.05 | 17.710.04 |
| 08 | ACO496J043324.61-131111.9 | -15.69 | dE | - | 21.080.08 | 19.700.09 | 19.130.06 | 18.780.08 |
| 09 | ACO496J043324.91-131342.6 | -17.20 | dE | - | 19.570.05 | 18.190.04 | 17.600.04 | 17.250.05 |
| 10 | ACO496J043325.10-130906.6 | -15.93 | dE | - | 20.660.09 | 19.460.04 | 18.870.15 | 18.630.07 |
| 11 | ACO496J043325.40-131414.6 | -16.66 | dE | - | 20.060.04 | 18.730.07 | 18.170.04 | 17.820.04 |
| 12 | ACO496J043325.54-130408.0 | -16.07 | dE | - | 20.600.07 | 19.320.04 | 18.900.07 | 18.620.07 |
| 13 | ACO496J043326.49-131717.8 | -17.13 | dS0 | - | 19.630.03 | 18.260.05 | 17.720.05 | 17.350.06 |
| 14 | ACO496J043329.79-130851.7 | -16.49 | dE | - | 20.030.05 | 18.900.07 | 18.390.06 | 18.050.04 |
| 15 | ACO496J043331.48-131654.6 | -18.13 | S0a | (s):S/D | 18.670.05 | 17.260.04 | 16.660.03 | 16.320.04 |
| 16 | ACO496J043332.07-131518.1 | -17.76 | dE/E/S0 | (w):R | 19.110.03 | 17.630.05 | 16.960.04 | 16.530.03 |
| 17 | ACO496J043333.17-131712.6 | -18.27 | E | - | 18.680.04 | 17.120.03 | 16.460.04 | 16.050.04 |
| 18 | ACO496J043333.53-131852.6 | -18.17 | SB0a | (s):B | 18.620.03 | 17.220.03 | 16.600.03 | 16.220.03 |
| 19 | ACO496J043334.54-131137.1 | -16.04 | dE | - | 20.650.15 | 19.350.13 | 18.850.04 | 18.500.07 |
| 20 | ACO496J043337.35-131520.2 | -16.99 | cE | - | 19.930.03 | 18.400.06 | 17.600.06 | 17.200.08 |
| 21 | ACO496J043338.22-131500.7 | -17.44 | dE | - | 19.670.02 | 17.950.04 | 17.260.05 | 16.810.04 |
| 22 | ACO496J043339.07-131319.7 | -15.63 | dE | - | 21.220.20 | 19.760.10 | 19.060.10 | 18.700.11 |
| 23 | ACO496J043339.72-131424.6 | -16.17 | dE | - | 20.590.04 | 19.220.03 | 18.630.05 | 18.240.10 |
| 24 | ACO496J043341.69-131551.8 | -18.49 | E | - | 18.540.04 | 16.900.04 | 16.170.04 | 15.710.03 |
| 25 | ACO496J043342.10-131653.7 | -17.65 | dS0/S0 | (s):D/R | 19.280.05 | 17.740.04 | 17.070.04 | 16.620.04 |
| 26 | ACO496J043342.13-131258.8 | -16.92 | dE | - | 19.970.06 | 18.470.04 | 17.840.02 | 17.530.02 |
| 27 | ACO496J043342.83-130846.8 | -17.92 | S0/E | - | 18.810.03 | 17.470.04 | 16.840.04 | 16.420.04 |
| 28 | ACO496J043343.04-130514.1 | -17.41 | dS0 | - | 19.330.03 | 17.980.03 | 17.360.03 | 16.950.04 |
| 29 | ACO496J043343.04-125924.4 | -16.34 | dS0/dE | - | 20.350.14 | 19.050.07 | 18.550.04 | 18.210.27 |
| 30 | ACO496J043345.67-130542.2 | -17.32 | dS0 | - | 19.390.06 | 18.070.06 | 17.530.03 | 17.140.06 |
| 31 | ACO496J043346.71-131756.2 | -18.44 | SB0 | (s):S+B | 18.420.04 | 16.950.04 | 16.340.03 | 15.960.03 |
| 32 | ACO496J043348.59-130558.3 | -17.09 | dE | - | 19.710.06 | 18.300.04 | 17.690.03 | 17.350.07 |
| 33 | ACO496J043349.08-130520.5 | -17.96 | S0a/dS0 | (w):S | 18.830.02 | 17.430.03 | 16.850.04 | 16.440.04 |
| 34 | ACO496J043350.17-125945.4 | -16.08 | dS0 | - | 20.560.11 | 19.310.09 | 18.790.10 | 18.440.09 |
| 35 | ACO496J043351.54-131135.5 | -16.47 | dS0/dE | - | 20.170.05 | 18.920.10 | 18.430.09 | 18.230.08 |
| 36 | ACO496J043352.77-131523.8 | -17.73 | S0/dS0 | (w):D? | 18.940.06 | 17.660.04 | 17.080.05 | 16.690.04 |
| 37 | ACO496J043355.55-131024.9 | -16.12 | dS0/dE | - | 20.500.13 | 19.270.07 | 18.680.07 | 18.400.06 |
| 38 | ACO496J043356.18-125913.1 | -17.96 | E/dE/dS0 | - | 18.520.02 | 17.430.04 | 16.950.03 | 16.600.03 |
| 39 | ACO496J043359.03-130626.7 | -17.50 | dS0 | - | 19.170.03 | 17.890.04 | 17.340.04 | 16.980.04 |
| 40 | ACO496J043401.57-131359.7 | -18.34 | E/S0 | - | 18.440.03 | 17.050.03 | 16.410.03 | 16.040.03 |
| 41 | ACO496J043403.19-131310.6 | -18.75 | SB0/SBa | (s):S+B | 18.140.02 | 16.640.03 | 16.000.04 | 15.620.04 |
| 42 | ACO496J043408.50-131152.7 | -16.67 | dE/dS0 | (w):B?/D | 19.970.05 | 18.720.12 | 18.130.10 | 17.800.14 |
| 43 | ACO496J043410.60-130756.7 | -16.79 | dS0 | - | 19.890.05 | 18.600.07 | 18.070.03 | 17.740.06 |
| 44 | ACO496J043413.00-131003.5 | -18.25 | E/S0 | - | 18.610.02 | 17.140.03 | 16.540.03 | 16.120.03 |
| 45 | ACO496J043413.08-131231.6 | -16.60 | dE | - | 20.140.09 | 18.790.03 | 18.240.09 | 17.910.10 |
| 46 | ACO496J043415.37-130823.5 | -17.46 | dIm | - | 18.490.03 | 17.930.05 | 17.810.06 | 17.670.06 |
| A1 | ACO496J043411.72-131130.2 | -15.07 | dE | - | 21.530.09 | 20.320.09 | 19.780.08 | 19.470.08 |
| A2 | ACO496J043414.54-131303.0 | -15.50 | dE | - | 20.870.19 | 19.890.11 | 19.320.17 | 19.000.17 |
| N | ||||||||
|---|---|---|---|---|---|---|---|---|
| arcsec | km s-1 | arcsec | mag arcsec-2 | km s-1 | km s-1 | Gyr | dex | |
| 01 | 486 | -970 | 2.940.12 | 22.310.04 | 89151 | 471 | 4.90.9 | -0.130.03 |
| 02 | 892 | 977 | 6.200.14 | 23.110.05 | 108621 | 451 | 4.00.6 | -0.210.04 |
| 03 | 752 | -691 | 2.520.34 | 23.160.12 | 91943 | 333 | 14.26.7 | -0.730.14 |
| 04 | 293 | 1179 | 3.070.16 | 23.550.09 | 110642 | 183 | 4.93.1 | -0.720.09 |
| 05 | 295 | -1260 | 2.180.10 | 22.390.06 | 86252 | 492 | 14.04.1 | -0.540.10 |
| 06 | 788 | -1120 | 3.380.12 | 21.560.05 | 87651 | 721 | 6.80.4 | -0.140.01 |
| 07 | 725 | -2149 | 1.940.06 | 22.130.06 | 77361 | 271 | 1.20.2 | -0.460.03 |
| 08 | 331 | -292 | 1.410.10 | 22.750.07 | 95932 | 212 | 9.94.9 | -0.540.07 |
| 09 | 222 | -686 | 2.130.08 | 22.130.05 | 91991 | 411 | 12.03.0 | -0.510.05 |
| 10 | 436 | 528 | 2.030.06 | 23.310.08 | 104133 | 263 | 6.24.6 | -0.720.12 |
| 11 | 201 | -1510 | 1.750.14 | 22.260.08 | 83751 | 391 | 9.52.6 | -0.350.03 |
| 12 | 716 | 1208 | 2.300.13 | 23.430.07 | 110933 | 263 | 5.52.5 | -0.890.07 |
| 13 | 192 | -944 | 4.150.28 | 23.650.06 | 89412 | 402 | 6.62.3 | -0.370.06 |
| 14 | 426 | -1244 | 1.680.11 | 22.330.11 | 86412 | 312 | 6.62.4 | -0.720.06 |
| 15 | 118 | -298 | 2.850.10 | 21.840.05 | 95871 | 511 | 5.50.5 | -0.210.01 |
| 16 | 87 | 69 | 1.690.09 | 21.070.10 | 99541 | 791 | 12.91.4 | -0.430.03 |
| 17 | 114 | -13 | 1.510.05 | 20.340.06 | 98721 | 1242 | 14.01.2 | -0.060.02 |
| 18 | 202 | 1820 | 2.340.11 | 21.380.06 | 117051 | 831 | 5.70.5 | -0.070.01 |
| 19 | 248 | -1441 | 2.250.35 | 23.420.18 | 84442 | 193 | 6.14.3 | -0.500.11 |
| 20 | 22 | -130 | 0.750.02 | 20.070.07 | 97551 | 1031 | 15.71.2 | -0.060.02 |
| 21 | 41 | 407 | 1.220.05 | 20.690.05 | 102922 | 1472 | 15.61.9 | -0.180.03 |
| 22 | 142 | 929 | 1.510.13 | 22.950.09 | 108141 | 262 | 6.91.9 | -0.200.06 |
| 23 | 81 | 256 | 1.740.04 | 22.720.07 | 101412 | 373 | 15.96.5 | -0.820.14 |
| 24 | 58 | -114 | 1.370.06 | 19.870.07 | 97711 | 1761 | 14.80.9 | -0.090.01 |
| 25 | 96 | -369 | 2.510.11 | 22.040.06 | 95161 | 771 | 8.51.2 | -0.280.02 |
| 26 | 174 | 463 | 4.440.18 | 24.010.08 | 103483 | 363 | 6.03.5 | -0.410.10 |
| 27 | 420 | 649 | 2.840.12 | 22.040.04 | 105341 | 531 | 7.71.1 | -0.580.02 |
| 28 | 631 | -203 | 2.640.11 | 22.400.06 | 96821 | 561 | 12.92.3 | -0.490.04 |
| 29 | 979 | 338 | 3.020.19 | 23.760.09 | 102232 | 212 | 11.25.4 | -0.750.11 |
| 30 | 610 | -196 | 2.390.22 | 22.270.06 | 96891 | 461 | 4.70.6 | -0.210.03 |
| 31 | 188 | -1519 | 2.840.10 | 21.530.05 | 83661 | 731 | 11.61.2 | -0.400.02 |
| 32 | 603 | -108 | 2.030.12 | 22.150.08 | 97771 | 461 | 10.91.6 | -0.380.02 |
| 33 | 642 | -115 | 3.660.18 | 22.550.05 | 97701 | 551 | 7.91.4 | -0.390.02 |
| 34 | 972 | 492 | 2.480.18 | 23.590.11 | 103773 | 394 | 3.01.7 | -0.670.21 |
| 35 | 317 | -426 | 1.710.21 | 22.380.13 | 94591 | 212 | 1.50.4 | -0.430.03 |
| 36 | 219 | -959 | 2.520.12 | 21.970.06 | 89261 | 521 | 7.81.3 | -0.340.02 |
| 37 | 409 | -1459 | 2.250.13 | 23.340.09 | 84262 | 302 | 5.42.1 | -0.290.05 |
| 38 | 1024 | 1318 | 1.710.09 | 20.900.04 | 112031 | 431 | 1.20.1 | -0.470.02 |
| 39 | 635 | 667 | 4.460.21 | 23.450.06 | 105521 | 272 | 4.91.4 | -0.480.04 |
| 40 | 361 | 398 | 1.340.07 | 20.010.05 | 102831 | 1511 | 12.90.9 | -0.210.01 |
| 41 | 400 | -933 | 3.410.11 | 21.610.05 | 89521 | 871 | 11.91.1 | -0.250.02 |
| 42 | 503 | -123 | 2.830.30 | 23.290.18 | 97623 | 314 | 6.75.0 | -0.700.11 |
| 43 | 667 | -1510 | 2.900.24 | 23.220.06 | 83752 | 382 | 4.01.6 | -0.360.09 |
| 44 | 615 | 950 | 3.270.11 | 22.020.04 | 108351 | 501 | 8.91.1 | -0.230.02 |
| 45 | 549 | 314 | 2.020.06 | 22.620.06 | 101992 | 433 | 14.15.4 | -0.780.12 |
| 46 | 701 | -2138 | 2.740.15 | 22.420.13 | 77472 | 223 | 0.20.1 | -0.160.05 |
| A1 | 555 | 606 | 1.220.13 | 23.000.23 | 104914 | |||
| A2 | 559 | 1020 | 1.560.15 | 23.170.12 | 1090510 |
∗The values of and for G-20 in this table are strongly discrepant with those presented in Chilingarian et al. (2007c) measured on HST WFPC2, because here we did not take into account seeing quality of our ground-based CFHT observations.
| N | Fe5015 | Mg | Fe5270 | Fe5335 | Fe5406 | [Mg/Fe] | Comments |
|---|---|---|---|---|---|---|---|
| Å | Å | Å | Å | Å | dex | ||
| 01 | 3.890.28 | 3.400.10 | 2.590.10 | 2.050.10 | 1.780.09 | 0.220.10 | red core |
| 02 | 4.610.19 | 3.070.07 | 2.460.07 | 2.450.09 | 1.700.07 | 0.140.07 | red core |
| 03 | 3.070.54 | 2.700.21 | 2.170.21 | 1.280.21 | 0.640.20 | 0.200.20 | |
| 04 | 4.700.47 | 2.940.19 | 1.630.19 | 1.230.20 | 0.560.17 | 0.480.06 | |
| 05 | 3.960.35 | 2.780.14 | 3.010.14 | 2.170.14 | 1.410.11 | -0.110.15 | red core |
| 06 | 5.460.12 | 3.670.05 | 2.930.05 | 2.500.05 | 1.380.04 | 0.110.04 | red core |
| 07 | 2.640.19 | 1.390.07 | 1.750.07 | 1.120.09 | 1.210.06 | -0.020.09 | blue core |
| 08 | 4.500.47 | 3.070.19 | 2.450.19 | 2.040.19 | 0.760.17 | 0.180.22 | |
| 09 | 2.850.28 | 3.210.11 | 2.990.11 | 1.690.11 | 1.400.09 | 0.080.12 | |
| 10 | 2.120.57 | 2.310.22 | 1.670.23 | 1.660.25 | 0.830.22 | 0.240.25 | |
| 11 | 4.730.32 | 2.640.14 | 2.120.12 | 2.000.12 | 1.690.11 | 0.150.17 | red core |
| 12 | 2.010.56 | 2.290.22 | 0.950.24 | 2.610.24 | 0.570.22 | 0.410.27 | |
| 13 | 4.370.43 | 2.560.17 | 3.540.17 | 1.920.17 | 1.700.14 | -0.230.09 | |
| 14 | 3.580.31 | 2.410.12 | 2.340.12 | 0.960.13 | 0.820.10 | 0.170.16 | |
| 15 | 4.220.15 | 3.240.06 | 2.930.06 | 2.120.06 | 1.320.04 | 0.060.06 | red core |
| 16 | 4.360.14 | 3.680.06 | 2.520.06 | 2.010.06 | 1.410.06 | 0.280.04 | red core |
| 17 | 4.850.17 | 4.840.07 | 3.330.07 | 2.640.07 | 1.770.06 | 0.200.04 | red core |
| 18 | 4.870.16 | 3.530.06 | 2.770.06 | 2.440.07 | 1.750.06 | 0.140.06 | red core |
| 19 | 6.170.60 | 1.710.25 | 2.160.23 | 1.790.23 | 1.580.19 | -0.090.23 | |
| 20 | 5.570.16 | 4.790.06 | 3.250.06 | 2.960.06 | 1.950.06 | 0.180.04 | |
| 21 | 4.130.22 | 4.850.08 | 2.650.08 | 2.110.10 | 1.750.08 | 0.450.07 | |
| 22 | 4.260.41 | 3.060.15 | 3.370.15 | 1.820.17 | 1.210.14 | -0.100.17 | |
| 23 | 4.930.44 | 2.420.17 | 1.330.19 | 0.820.19 | 0.680.16 | 0.290.06 | |
| 24 | 4.550.13 | 5.010.05 | 2.940.05 | 2.530.05 | 1.720.04 | 0.340.03 | red core |
| 25 | 4.560.20 | 3.530.07 | 2.800.07 | 2.190.08 | 1.420.07 | 0.140.07 | red core |
| 26 | 3.950.57 | 2.020.22 | 3.360.22 | 0.420.20 | |||
| 27 | 3.500.16 | 2.900.06 | 2.150.06 | 1.990.07 | 1.520.06 | 0.260.07 | |
| 28 | 4.630.21 | 3.620.08 | 2.420.08 | 1.860.08 | 1.280.07 | 0.320.06 | red core |
| 29 | 2.590.49 | 2.910.18 | 2.230.19 | 2.350.19 | 3.160.15 | 0.160.24 | |
| 30 | 4.860.19 | 2.900.08 | 2.920.08 | 2.280.08 | 1.680.06 | -0.050.09 | |
| 31 | 3.560.15 | 3.500.05 | 2.610.05 | 2.130.05 | 1.310.05 | 0.210.05 | red core |
| 32 | 3.740.19 | 3.550.07 | 2.700.07 | 2.380.07 | 1.710.06 | 0.150.07 | red core |
| 33 | 3.810.21 | 3.030.08 | 2.500.08 | 2.060.09 | 1.530.08 | 0.150.09 | |
| 34 | 2.600.57 | 1.770.23 | 1.140.23 | 2.430.23 | 1.840.19 | 0.140.26 | |
| 35 | 1.540.24 | 1.970.09 | 2.800.09 | 1.650.10 | 0.930.09 | -0.250.10 | blue core |
| 36 | 3.360.22 | 3.160.09 | 2.850.09 | 2.490.09 | 1.620.07 | 0.000.09 | red core |
| 37 | 3.000.54 | 2.490.22 | 2.840.19 | 2.170.21 | 1.980.16 | -0.110.22 | |
| 38 | 1.140.09 | 1.550.04 | 1.420.04 | 1.280.04 | 0.770.03 | 0.120.04 | blue core |
| 39 | 3.930.28 | 2.100.11 | 1.690.11 | 2.060.12 | 1.780.09 | 0.130.14 | |
| 40 | 3.920.13 | 4.240.05 | 2.840.05 | 2.340.05 | 1.600.04 | 0.250.04 | red core |
| 41 | 3.350.16 | 3.900.07 | 2.820.07 | 2.330.07 | 1.600.05 | 0.190.05 | red core |
| 42 | 3.310.69 | 3.400.25 | 1.510.27 | 1.610.27 | 1.400.22 | 0.430.06 | |
| 43 | 5.460.45 | 2.160.18 | 2.300.18 | 2.260.18 | 1.210.15 | -0.070.26 | |
| 44 | 4.790.18 | 3.800.07 | 2.670.07 | 2.270.07 | 1.550.06 | 0.220.06 | red core |
| 45 | 2.560.43 | 3.070.16 | 1.890.16 | 1.900.16 | 0.480.15 | 0.340.15 | |
| 46 | -12.090.20 | 1.500.09 | 0.870.09 | 0.930.11 | 0.540.08 | 0.350.11 | strong star formation |
In this section, we present an atlas containing photometric and spectroscopic information on 46 Abell~496 members, and the tables with parameters of morphology, integrated photometry, kinematics, and stellar populations for these galaxies. For the two cluster members (marked as A1 and A2), where stellar population fitting was not possible due to low signal-to-noise ratio of the spectra, we provide redshifts and all photometrical and morphological parameters.
We compute band absolute magnitudes in Table 1, as well as mean surface brightnesses in Table 2 from magnitudes using the photometrical transformation from Fukugita et al. (1995), assuming the SED of elliptical galaxies for all objects ( mag, mag), also applying corrections for Galactic extinction (Schlegel et al. 1998), cosmological dimming (0.14 mag), and K-correction ( mag, mag, Fukugita et al. 1995). Structural parameters: effective radii and surface brightnesses have been calculated directly from the images, without any bulge/disc decomposition or light profile fitting. Total magnitudes in the four CFHT bands in Table 1 have been corrected for Galactic extinction only.
The types of embedded structures in Table 1 are given as follows: B, bar, D, disc, R, ring, S, spiral. Strengths of embedded structures are specified as (s) for strong or (w) for weak.
For every galaxy we present:
-
1.
description of photometric, kinematical, and stellar population properties;
-
2.
cutout of the Megacam image in the band with a size of 2323 arcsec2 for all galaxies for easy comparison of their spatial dimensions;
-
3.
unsharp masking of the band image, zoomed on the galaxy;
-
4.
, , and colour maps;
-
5.
FLAMES/Giraffe spectrum, best-fitting PEGASE.HR model and residuals;
-
6.
map in the age–metallicity space.
We applied an elliptically-smoothed unsharp masking technique (Lisker et al. 2006) to the -band image using the ellipticity and orientation of the isophotes of 23, 24, and 25 mag arcsec-2 in the band. We created masks for 8 different major axes of smoothing elliptical Gaussians. For every galaxy, we present a subjectively selected mask, where embedded structures are most clearly seen. If no embedded structures have been detected, the image, corresponding to the orientation of the 25 mag arcsec-2 isophote and major axis dispersion of 0.5 arcsec for the smoothing Gaussian, is shown.
To build colour maps, we have to take into account the differences between the telescope PSF and atmosphere seeing for observations in different Megacam bands. Images in the and bands have nearly the same seeing quality, while and are slightly better. We have convolved the and band images with circular Gaussians having FWHM 0.57 and 0.34 arcsec to match the image quality in and .
To get reliable colour estimates at the peripheral parts of the galaxies, where the signal level becomes rather low, we have applied the Voronoi adaptive binning procedure (Cappellari & Copin 2003) to the images in to get a constant signal-to-noise ratio of 50 per bin. All tessellae containing more than 120 pixels are masked on the presented colour maps.
A.1 Notes on individual objects
ACO496J043306.97-131238.8 (G-01): This early-type spiral exhibits an extended disc and a small bar, which is aligned nearly along the minor axis of the external disc, explaining the isophotal twisting. The colour maps indicate the presence of a small red bulge and the velocity dispersion is in agreement with a low-mass bulge. Intermediate age and slightly sub-solar metallicity are normal for such a low-luminosity spiral. However, [Mg/Fe] is super-solar and is among the highest values obtained for such faint galaxies. The galaxy is located in the outer parts of the bright X-ray halo observed with Chandra (Dupke & White 2003) and XMM-Newton (Tanaka et al. 2006). Its projected distance (dproj = 304 kpc) places it far from the cluster core. No emission lines are seen in the spectrum.
ACO496J043308.85-130235.6 (G-02): This late type spiral is nearly edge-on. A dust lane is seen on the westside of the galaxy on the colour maps. Star formation regions in the southern part of the disc seem strongly obscured by dust. The residuals of the fitting exhibit a narrow H line in emission, indicating that HII regions are found in the centre. As for the previous galaxy, the stellar population is not older than 4 Gyr, and the metallicity is slightly sub-solar. The velocity dispersion is normal for a galaxy, which is among the brightest objects of our sample, but clearly not an early-type galaxy. The [Mg/Fe] abundance ratio is somewhat higher than the solar value. No X-ray emission is found at the location of ACO496J043308.85-130235.6 (G-02) and its projected distance (dproj = 557 kpc) places it at more than one third of the cluster virial radius. Our radial velocity for ACO496J043308.85-130235.6 (10862 km s-1) is strongly discrepant with the one reported by NED (10197 km s-1), but two other studies (Malumuth et al. 1992; Christlein & Zabludoff 2003) give heliocentric radial velocities different by less than 40 km s-1 from our value.
ACO496J043312.79-130449.3 (G-03): This faint and regular dwarf elliptical galaxy is not nucleated and has no colour gradient. Its low velocity dispersion, relatively old age, very metal-poor stellar population, and low surface brightness make it a normal dwarf elliptical. Its projected distance (dproj = 470 kpc) is large and the galaxy is found in the outskirts of the X-ray halo. No sign of ram-pressure stripping or tidal interaction is observed, as expected if the galaxy is on a roughly circular orbit or just entering the X-ray halo.
ACO496J043317.75-131536.6 (G-04): This dwarf lenticular or elliptical galaxy has a smooth and elongated appearance. The unsharp masked image seems to indicate the presence of a faint bar or nearly edge-on internal disc, but this embedded structure is certainly faint since it is not seen on colour maps. With a low velocity dispersion, an intermediate age for its stellar population and a correspondingly low metallicity, this galaxy does not differ strongly from “classical” dwarfs. Both its projected distance (dproj = 183 kpc) and its radial velocity suggest that interaction with the hot intracluster medium could have induced a short star formation episode in the ACO496J043317.75-131536.6 (G-04) centre. Despite a low S/N spectrum, we can be sure that no emission lines are present. The radial velocity reported by NED (Christlein and Zabludoff, 2003) differs by more than 300 km s-1 from our value.
ACO496J043318.95-131726.9 (G-05): The central part of this dwarf elliptical has redder colours than the outskirts and the velocity dispersion corresponds to the mean value for this absolute magnitude. However the age of the stellar population is close to the maximum value allowed with our PEGASE.HR database (17.6 Gyr) both with quite a low metallicity. Like for the previous galaxy, its projected distance (dproj = 184 kpc) and its radial velocity suggest ACO496J043318.95-131726.9 (G-05) is on a trajectory crossing the cluster core. But the progenitor of this dwarf could have already consumed most of its gas when it entered the X-ray halo and part of its disc could have been tidally stripped, leaving a low-mass bulge nearly intact.
ACO496J043320.35-130314.9 (G-06): This lenticular galaxy has an intermediate luminosity and is the brightest galaxy of the spectroscopic sample. The unsharp masking technique reveals a strong bar and ring system, which is also redder on the colour maps compared to the underlying disc. The galaxy has an intermediate age, a slightly metal poor and -overabundant stellar population, with a quite normal velocity dispersion for the bulge of an S0 galaxy. No emission lines are detected in the spectrum. ACO496J043320.35-130314.9 (G-06) is found outside the X-ray halo in the northern part of the cluster.
ACO496J043321.37-130416.6 (G-07): This dwarf lenticular or early-type spiral is very peculiar since the elongated central structure is bluer than the underlying disc. Both the unsharp masked image and colour maps exhibit a spiral pattern extending over most of the inclined disc. An [OIII] line is noticed in emission on the residual after fitting the stellar population but H is located outside the observed wavelength range. This galaxy has the second bluest () colour index in an aperture of 1.2 arcsec of our whole sample. The stellar population fitting gives a very young age and a slightly sub-solar metallicity, but both estimations have large uncertainties and we suspect that a stellar population with an age of 1.2 Gyr and a metallicity of [Fe/H]=-0.55 dex could also be present in the galaxy centre, indicating that star formation began at that time and is continuing up to now. The [Mg/Fe] ratio is nearly solar and the low velocity dispersion is determined with good precision. Our value for the radial velocity (7736 km s-1) differs by 78km s-1 from the value given NED and found by Durret at al. (1999), but this difference is only equal to 1.2 of the older measurement. As for the previous galaxy, ACO496J043321.37-130416.6 (G-07) is located at the northern border of the X-ray halo, but its radial velocity is smaller than the mean cluster velocity by more than 2000 km s-1. This dwarf could be orbiting around the more luminous lenticular ACO496J043320.35-130314.9 (G-06), but their very high velocity difference and their separation of about 1 arcmin (40 kpc) indicate that if a strong tidal interaction has occurred in the past, leading to a burst of star formation in the centre, the tidal forces are not acting anymore.
ACO496J043324.61-131111.9 (G-08): This is a faint regular dE galaxy, which could be nucleated as evidenced by a slightly bluer centre in the colour maps. The faint S/N ratio of the spectrum does not allow us to determine the age and metallicity precisely, but the stellar population seems to have an old age and low metallicity, both consistent with the values generally expected in such dwarfs. Only the central velocity dispersion can be determined with a good precision since the absorption lines are clearly very narrow. Its velocity is smaller than the mean cluster velocity and its projected distance to the cluster centre is 209 kpc, which is about half the radius of the X-ray halo.
ACO496J043324.91-131342.6 (G-09): This dE exhibits a slightly concentrated structure revealed by the unsharp masking technique and a colour gradient with a redder colour in the centre. The outer part has colour indices typical of those seen in the discs of lenticulars in our sample. Its velocity dispersion is low, and the age of its stellar population is quite old, with a low metallicity and a nearly solar abundance ratio. No emission lines are detected. Its velocity is about 700 km s-1 lower than the mean cluster velocity. The projected distance to the cluster centre is 139 kpc; at about 40 kpc in projection, a brighter elliptical (M and =207 km s-1) is found with a radial velocity of 9300 km s-1, giving an argument that ACO496J043324.91-131342.6 (G-09) could be undergoing tidal interaction.
ACO496J043325.10-130906.6 (G-10): This dE is faint and does not show any substructures. Only a slight colour gradient appears on colour maps, but there is no signature of a nucleus. Stellar population parameters are uncertain because of low signal-to-noise ratio in the spectrum. No emission lines are detected. The velocity dispersion is low, but higher than for galaxies of similar luminosity. This faint dwarf is in projection inside the X-ray halo at dproj = 273 kpc.
ACO496J043325.40-131414.6 (G-11): This is a faint dE galaxy with no substructure, except a slightly concentrated red central part. This red centre is, however, only marginally resolved and could be considered as a nucleus. The galaxy exhibits an intermediate age, a metal poor stellar population and a quite normal velocity dispersion for such a faint dwarf. No emission lines are detected in the spectrum. Like the previous galaxy, this dwarf is in projection near the cluster core (dproj = 130 kpc), but also very near another dE, ACO496J043324.91-131342.6 (G-09). However their radial velocities differ by 825 km s-1, putting them in different physical areas in the cluster.
ACO496J043325.54-130408.0 (G-12): This low surface brightness dE is quite regular and with a small gradient in colour changing from an intermediate colour in the centre to a blue one in the outer regions. The poor S/N ratio spectrum still allows us to determine metal-poor intermediate age stellar population. The velocity dispersion is low, as expected for its faint luminosity. No emission lines are present in the residual of the fitting. The projected distance to the cluster centre is 449 kpc and the galaxy is located just at the northern border of the X-ray halo.
ACO496J043326.49-131717.8 (G-13): This dwarf lenticular exhibits a faint elongated structure. This inclined disc may contain a spiral pattern, which appears bluer on some colour maps despite the noise. In the galaxy centre a red, compact, and slightly elongated component could be a small bulge. Its velocity dispersion is quite low, with an intermediate age and a low metallicity. This object has the lowest value of [Mg/Fe] of the sample, indicating that subsequent star formation episodes might have occurred in this object. No emission lines are detected. It is located quite close to the cluster centre, at a projected distance of 120 kpc.
ACO496J043329.79-130851.7 (G-14): This is a faint dE galaxy with no substructure except for a trend to be centrally concentrated. A strong colour gradient is observed, with redder colours in the centre and becoming bluer toward the outskirts. Its velocity dispersion is low. One can notice two minima of in the age-metallicity space. This can be considered as a hint for a complex star formation history in this object, however, higher signal-to-noise ratio in the spectrum is required to disentangle the two star formation episodes. No emission lines are detected. The projected distance to the cluster centre is 267 kpc.
ACO496J043331.48-131654.6 (G-15): This low-luminosity lenticular galaxy exhibits prominent Z-shaped structure, revealed by the unsharp masking technique, which is probably a spiral pattern in the strongly inclined stellar disc. The stellar population of the galaxy is moderately old, with sub-solar metallicity and exactly solar [Mg/Fe] ratio. No emission lines are detected. The velocity dispersion is low compared to other galaxies of similar luminosities, suggesting that ACO496J043331.48-131654.6 (G-15) may be a stripped spiral or a later-type galaxy with a small bulge (see colour maps). The galaxy is located only 75 kpc in projected distance from the cluster cD, and its radial velocity is close to the cluster redshift. However, its photometric, dynamical, and stellar population properties resemble other galaxies in our sample located much further away from the cluster centre, so this is an indirect argument that its real distance from cD could be considerably larger than the projected one. ACO496J043333.17-131712.6 (G-17), located at the same projected distance and only 30 arcsec away from ACO496J043331.48-131654.6 (G-15) has a very similar luminosity, but completely different properties. Our radial velocity value for ACO496J043331.48-131654.6 (G-15), 9586 km s-1, is strongly discrepant with the one reported by NED, 9875 km s-1, but agrees with the HyperLEDA value (Malumuth et al. 1992). However, the NED value is very close to the redshift of ACO496J043333.17-131712.6 (G-17), so we conclude that it might be a cross-identification mistake.
ACO496J043332.07-131518.1 (G-16): This low-luminosity elliptical galaxy is found in the inner part of the cluster (dproj = 54 kpc). It shows a red concentrated structure in the centre. The stellar population is quite old and metal-poor, and [Mg/Fe] is super-solar. ACO496J043332.07-131518.1 (G-16) exhibits a moderate velocity dispersion value and no emission lines. Its radial velocity does not differ from the mean cluster redshift. The properties of its central stellar population are very unusual for elliptical galaxies and even for low-luminosity objects; they are very similar to those of ACO496J043346.71-131756.2 (G-31), an S0 among the most luminous in our spectroscopic sample. If the disc of a galaxy, with a bulge similar to the one of the previous S0, has lost most of its stars at an early phase of its evolution during tidal interactions, it is plausible that the result will look like this low-luminosity E, a spheroid with a colour gradient. An alternative hypothesis is that the gas has been swept very rapidly after the galaxy formation, leaving it quiescent for a long time in the cluster core without any further merger with other objects.
ACO496J043333.17-131712.6 (G-17): This low-luminosity elliptical galaxy belongs to the population of unusual galaxies in the central dense part of the Abell 496 cluster (72 kpc in projected distance). Its stellar population of high velocity dispersion, very old age, metal-rich and -enhanced, and compact appearance make it very different from nearby E galaxies of this luminosity. No emission lines are detected. No presence of embedded structures is revealed by the unsharp masking. The central part of the galaxy is relatively red and extended; the stellar population properties correspond to those of a normal bulge as seen in more massive lenticulars. Its radial velocity is very close to the mean cluster velocity.
ACO496J043333.53-131852.6 (G-18): This is an early-type galaxy that can be classified as a low-luminosity SB0a with an absolute magnitude that places it slightly above the brightest dE/dS0. Unsharp masking reveals a prominent bar aligned nearly along the minor axis of the external isophotes. The difference in colour between the bulge and disc is clearly seen on all the colour maps, as well as for the bar which is also redder compared to the disc. Its intermediate age, nearly solar metallicity, and moderate velocity dispersion resemble properties of objects of this luminosity in the nearby Universe. However, the [Mg/Fe] abundance ratio is somewhat higher than solar, indicating a short period of star formation (1.5 Gyr). No emission lines are detected. The galaxy is located in the central part of the bright X-ray halo at a projected distance of 130 kpc.
ACO496J043334.54-131137.1 (G-19): This is a faint dE galaxy showing no evidence for embedded structures but a central component redder than the outer parts, however, not as red as typical bulges already seen in the other brighter galaxies. Its velocity dispersion is low, and its stellar population has an intermediate age and significantly sub-solar metallicity. No emission lines are detected. This galaxy is located quite close to the cluster centre, at a projected distance of 156 kpc.
ACO496J043337.35-131520.2 (G-20): This new M32-like compact elliptical has been extensively discussed by Chilingarian et al. (2007c) and is located in projection on the central cD halo. The central very bright component of this very peculiar dwarf has colours similar to most of the other ellipticals and lenticulars. With its high velocity dispersion for its luminosity, very old stellar population, nearly solar metallicity and mild -enhancement, it seems that ACO496J043337.35-131520.2 (G-20) is the disturbed remnant of an intermediate luminosity S0 where most of the disc has been tidally stripped.
ACO496J043338.22-131500.7 (G-21): This dwarf elliptical exhibits very different structural properties from the previous galaxy (A496cE), although it is located only at a projected distance of about 30 kpc of the cD (Chilingarian et al., 2007b). On the other hand, the colours in the central parts of the galaxy seem quite similar in both objects, and the stellar population in ACO496J043338.22-131500.7 (G-21) is only slightly more metal poor than that of ACO496J043337.35-131520.2 (G-20) and with higher -enhancement, while their ages are nearly the same. The velocity dispersion of ACO496J043338.22-131500.7 (G-21) is even larger and more unusual for such a small object. If the tidal stripping of a larger disc galaxy could also be invoked to explain the spectral properties, in the present case the remnant structural properties are quite normal compared to bulges. Two objects are reported in NED near the position of this dwarf and for the second one the radial velocity (Quintana & Ramirez, 1990) is 400 km s-1 smaller than our value.
ACO496J043339.07-131319.7 (G-22): This low-luminosity dwarf elliptical may host a faint nucleus as evidenced by the unsharp mask image. The colour maps are noisy, but indicate some colour difference between the centre and the outer parts. A low velocity dispersion, a relatively old and metal-poor stellar population, and low surface brightness make it a normal dwarf elliptical. No emission lines are detected. Its radial velocity is larger by 900 km s-1 than the mean cluster velocity; it is projected quite close to the cluster centre, at a projected distance of 89 kpc, but its real distance from the centre could be larger.
ACO496J043339.72-131424.6 (G-23): The centre of this faint dE is blue and could be slightly bluer than the rest of the galaxy despite the noise in the colour maps. Its velocity dispersion is low, and the age of its stellar population is old and metal-poor. No emission lines are detected. The projected distance to the cluster centre is 51 kpc, but there is no obvious reason to put this dE into the cluster core.
ACO496J043341.69-131551.8 (G-24): This very unusual, low-luminosity elliptical, representative of the peculiar galaxy population in the inner part of the cluster, is projected on the outer parts of the cD halo (dproj = 36 kpc). This galaxy is the highest velocity dispersion object in our sample. Its velocity dispersion and stellar population with slightly sub-solar metallicity, high -enhancement, and very old age are reminiscent of bulges of bright lenticular galaxies with a luminosity. This galaxy is probably a “scaled-up” analogue of A496cE (ACO496J043337.35-131520.2 (G-20); Chilingarian et al., 2007b) and the evolutionary scenarii of these two objects are very similar: heavy tidal stripping of a more luminous S0.
ACO496J043342.10-131653.7 (G-25): This low-luminosity lenticular galaxy is found in the inner part of the cluster (dproj = 60 kpc). Unsharp masking as well as colour maps reveal a bar or ringlike structure and faint spiral arms in the stellar disc. The stellar population is quite old and metal-poor, although [Mg/Fe] is super-solar, which is rather uncommon for such a faint S0 galaxy, and its velocity dispersion is average. No emission lines are detected.
ACO496J043342.13-131258.8 (G-26): This galaxy has the second largest effective radius (2.8 kpc) among the sample of early-type objects, while its luminosity is moderate, making it a low surface brightness galaxy. The projected distance to the centre is dproj = 109 kpc and the radial velocity is higher by 465 km s-1 than the mean value for the cluster, but this object does not resemble other galaxies populating the central region of the cluster. The velocity dispersion is low and the stellar population properties are normal for its luminosity. There was an artifact in the spectrum around 5320 Å (5140 Å in rest frame) so the Mg Lick index could not be measured.
ACO496J043342.83-130846.8 (G-27): This is a quite low-luminosity S0/E galaxy with an object superimposed less than 2 arcsec from its centre but otherwise no obvious substructures. No colour gradient is observed in this galaxy. Its velocity dispersion is quite low, with a medium age of its stellar population, a quite low metallicity and a high value of [Mg/Fe]. No emission lines are detected. The projected distance to the cluster centre is 264 kpc and the galaxy is located in the outer parts of the X-ray halo.
ACO496J043343.04-130514.1 (G-28): This is a bright dS0 galaxy with no substructure. A strong colour gradient is observed: the very central region is redder than the rest of the galaxy and could be a small bulge (marginally resolved in direction of the minor axis). Its velocity dispersion is quite low, and the age of its stellar population is old, with a low metallicity but a high value of [Mg/Fe]. No emission lines are detected. The projected distance to the cluster centre is 396 kpc. The galaxy, located at the border of the X-ray halo, seems to belong to a group of galaxies for which 4 members are in the spectroscopic sample, with ACO496J043349.08-130520.5 (G-33) being the brightest and largest galaxy.
ACO496J043343.04-125924.4 (G-29): This inclined or elongated faint dS0/dE, with no evident embedded substructure, exhibits a weak colour gradient with redder colours in the centre and becoming bluer towards the outskirts. Its velocity dispersion is low, and the age of its stellar population is quite old, with a very low metallicity. No emission lines are detected. The projected distance to the cluster centre is 614 kpc and the galaxy is found in the north, away from the X-ray halo.
ACO496J043345.67-130542.2 (G-30): This moderately bright dS0 galaxy with no substructures belongs to the group mentioned in the description of ACO496J043343.04-130514.1 (G-28). A colour gradient is observed, with the central region redder than the rest of the galaxy, indicating a small bulge. Its velocity dispersion is small and the age of its stellar population is young, with a low metallicity and [Mg/Fe] ratio. No emission lines are detected. The projected distance to the cluster centre is 382 kpc. Its velocity of 9689 km s-1 is 200 km s-1 smaller than the mean cluster velocity. Our measurement of the radial velocity solves the problem of the discrepancy between the values of 9770 80 km s-1 and 9528 101 km s-1 found respectively by Christlein & Zabludoff (2003) and Malumuth et al. (1992).
ACO496J043346.71-131756.2 (G-31): This is a low-luminosity, early-type galaxy slightly brighter than ACO496J043333.53-131852.6 (G-18). Faint spiral structure and a bar aligned along the major axis of the galaxy are revealed by means of unsharp masking. The galaxy exhibits a very old, metal poor, -overabundant stellar population with a velocity dispersion quite normal for its luminosity. No emission lines are detected. The galaxy is located some 120 kpc away from the cD galaxy in projection, its radial velocity differs significantly (-1500 km s-1) from the mean cluster redshift.
ACO496J043348.59-130558.3 (G-32): This quite faint dE galaxy with no embedded substructure is the third member of the group discovered at the northern border of the X-ray halo. As for the other lenticulars of this group, a small red and compact central structure is seen in the colour maps. Its velocity dispersion is quite low and the age of its stellar population is very old and metal poor but with a high [Mg/Fe] ratio. No emission lines are detected. The projected distance to the cluster centre is 402 kpc.
ACO496J043349.08-130520.5 (G-33): This early-type galaxy can be classified as a dS0. Its luminosity places it among the brightest representatives of the dE/dS0 class. Unsharp masking with elliptical blurring corresponding to the shape of the = 24 mag/arcsec-2 isophote reveals faint spiral arms, reminiscent of structures observed in brighter dE/dS0 galaxies in the Virgo (Jerjen et al. 2000; Barazza et al. 2002; Lisker et al. 2006) and Coma (Graham et al. 2003) clusters. These spiral arms cause an isophote twist in the outer regions of the galaxy. We do not observe emission lines in the spectrum of ACO496J043349.08-130520.5 (G-33). The old age and low metallicity of this galaxy correspond well to similar galaxies in the Virgo cluster. The velocity dispersion value is exactly what is expected from an object of this luminosity. The [Mg/Fe] ratio is slightly supersolar. This galaxy is located some 0.4 Mpc in projection from the centre of the cluster, being the brightest member of the association including three other dwarf galaxies (ACO496J043348.59-130558.3 (G-32); ACO496J043343.04 -130514.1 (G-28); ACO496J043345.67-130542.2 (G-30)) located 24, 55, and 34 kpc in projected distance and having very similar radial velocities, velocity dispersions and stellar populations.
ACO496J043350.17-125945.4 (G-34): This is a faint, blue dS0 galaxy with no substructure and no obvious colour gradient. Its velocity dispersion is low, and the age of its stellar population is young, with a very low metallicity. No emission lines are detected. The projected distance to the cluster centre is 610 kpc and the galaxy is located in the north, well outside the X-ray halo.
ACO496J043351.54-131135.5 (G-35): This is a faint dS0/dE galaxy with a very blue centre. This central compact structure appears notably bluer than the outer zones and is surrounded by an area with a colour gradient going from redder to bluer colours with increasing radius. Its velocity dispersion is small, and its stellar population is very young, and metal-poor. No emission lines are detected. The projected distance to the cluster centre is 199 kpc and this galaxy is located at more than half the X-ray halo radius.
ACO496J043352.77-131523.8 (G-36): As for the dS0 ACO496J043349.08-130520.5 (G-33), the unsharp masking with elliptical blurring corresponding to the shape of the = 24 mag/arcsec-2 isophote reveals a spiral pattern with very faint and slightly blue spiral arms in this bright dS0. These spiral arms cause an isophote twist in the outer regions of the galaxy. The spectral properties of the stellar population are also very similar to those of ACO496J043349.08-130520.5 (G-33), only differing in the [Mg/Fe] ratio, which is nearly solar. The velocity dispersion is in exactly the same range and corresponds to what is expected for a galaxy of this luminosity. In conclusion, one can suspect that this dS0 is projected just onto the cluster core (dproj = 137 kpc), since the other dS0 similar to this one is located outside the X-ray halo.
ACO496J043355.55-131024.9 (G-37): This is a very faint dS0/dE galaxy with no obvious substructures. A weak colour gradient is observed, with colours redder in the centre and becoming bluer towards the outskirts. Its velocity dispersion is small, and its stellar population is old having significantly sub-solar metallicity. No emission lines are detected. It seems this dwarf has a similar stellar population in the centre as ACO496J043318.95-131726.9 (G-05), but with a bulge mass four times smaller. The projected distance to the cluster centre is 256 kpc and the galaxy is located in the external parts of the X-ray halo.
ACO496J043356.18-125913.1 (G-38): This is a bright dE/dS0 galaxy with an early-type morphology and quite unusual stellar population properties. A very blue core is seen on colour maps, partly surrounded by a redder zone, and red patches further out aligned along the major axis. Its velocity dispersion is small, and the age of its stellar population is extremely young, with a sub-solar metallicity. Strong H and [OIII] emission lines are detected, indicating that HII regions are also found in the centre, implying an ongoing star formation process. No signature of [NI] ( Å) is seen, which excludes the possibility of the shockwave gas ionisation. The projected distance to the cluster centre is large (642 kpc) so the burst of star formation is probably not due to the interaction with the intracluster medium.
ACO496J043359.03-130626.7 (G-39): This is a bright extended dS0 galaxy with a low surface brightness and a faint compact central structure. Only a weak colour gradient is observed, with the central region not as blue as the rest of the disc. Its velocity dispersion is low, and the age of its stellar population is quite young, with a low metallicity and a [Mg/Fe] ratio close to solar No emission lines are detected. The projected distance to the cluster centre is 398 kpc with the galaxy location at the border of the X-ray halo.
ACO496J043401.57-131359.7 (G-40): Although this galaxy is not in the cluster core, its spectroscopic and photometrical properties are very similar to the ones of the peculiar ellipticals found in the vicinity of the cD. This bright S0/E has intermediate value of absolute magnitude and a velocity dispersion between those of the two bright Es with the largest sigma values at less than 100 kpc of the cD, ACO496J043341.69-131551.8 (G-24) and ACO496J043333.17-131712.6 (G-17). As for these two galaxies, the stellar population with low metallicity and -enhancement and very old age are similar to bulges of brighter lenticular galaxies. Its projected distance to the cluster centre is 227 kpc. Since no massive object is seen near this peculiar early-type galaxy in projection, one can suspect that a radial orbit almost in the plane of the sky could have brought it near the cD, where strong tidal effects have been responsible for the tidal stripping of the disc and shrinking of the bulge remnant.
ACO496J043403.19-131310.6 (G-41): With almost the same luminosity as ACO496J043320.35-130314.9 (G-06), this SB0/SBa galaxy exhibits an extended spiral pattern and a small bulge evidenced by its red colour on the colour maps. Unsharp masking reveals a bar or ringlike structure. Unexpected for a low-luminosity early-type spiral, it has an old age, but the rest of its stellar population properties are not unusual: it is metal poor and -overabundant, with a quite normal velocity dispersion for a low-mass bulge. No emission lines are detected in the spectrum. ACO496J043403.19-131310.6 (G-41) is found in the outer eastern part of the X-ray halo.
ACO496J043408.50-131152.7 (G-42): This is a faint dS0/dE galaxy with an elongated structure that could be a bar or an inclined disc. A weak colour gradient is observed, with redder colours in the centre and becoming bluer towards the outskirts. Its velocity dispersion is small, and the age of its stellar population is old, with a very low metallicity. No emission lines are detected. The projected distance to the cluster centre is 315 kpc and the galaxy is located just at the limit of the X-ray halo.
ACO496J043410.60-130756.7 (G-43): This is a faint dS0 galaxy with no substructure. A strong colour gradient is observed, with redder colours in the centre and becoming bluer towards the outskirts. Its velocity dispersion is low, and the age of its stellar population is intermediate, with a correspondingly low metallicity and a nearly solar [Mg/Fe] ratio. No emission lines are detected. The projected distance to the cluster centre is 418 kpc. This dS0 seems isolated and is located outside the X-ray halo.
ACO496J043413.00-131003.5 (G-44): This is a rather bright face-on S0 or elliptical galaxy with no obvious substructures, but very extended and with a low surface brightness except in the innermost 2 arcsec. A colour gradient is observed: the very centre of the galaxy appears redder than the outer zones. Its velocity dispersion is average, and its stellar population is old, with a low metallicity and a high [Mg/Fe] ratio. No emission lines are detected. The projected distance to the cluster centre is 385 kpc and it is located just outside the X-ray halo limit.
ACO496J043413.08-131231.6 (G-45): This is a faint dE galaxy with no substructure except for a trend to be centrally concentrated. A strong colour gradient is observed, with redder colours in the centre and becoming bluer towards the outskirts. Its velocity dispersion is rather normal for its luminosity, and the age of its stellar population is quite old, with a very low metallicity. No emission lines are detected. The projected distance to the cluster centre is 344 kpc. This faint dE is similar to another dwarf with the same properties, ACO496J043329.79-130851.7 (G-14). Both galaxies do not seem to be suffering an interaction with the intracluster medium or tidal effects.
ACO496J043415.37-130823.5 (G-46): is a late type star forming dwarf galaxy with a radial velocity differing from that of the cluster by km s-1. On the unsharp masked image and colour maps one can see several spatially unresolved star forming regions. The spectrum shows strong [OIII] emission lines (H is not in our wavelength range) and no obvious sign for emission in [NI]5199, implying that this is a typical HII region spectrum. The velocity dispersion is among the lowest in the sample. The projected distance to the cluster centre is 440 kpc.
ACO496J043411.72-131130.2 (G-A1): This galaxy is the faintest in our sample, and the smallest except for the cE galaxy. The projected distance to the cluster centre is 348 kpc. The spectrum was too faint to fit a stellar population model.
ACO496J043414.54-131303.0 (G-A2): This galaxy is the second faintest in our sample. The projected distance to the cluster centre is slightly larger than 350 kpc and its spectrum was too faint to fit a stellar population model.
Appendix B Stability and biases of the spectral fitting technique
In order to assess the reliability and precision of the stellar population parameters found by the pixel fitting procedure under different circumstances, we have conducted a number of tests using Monte-Carlo simulations and published datasets.
B.1 Multiplicative polynomial continuum
The fitting procedure includes a multiplicative function whose role is to absorb the flux calibration errors, both in the population models and in the observations, and the effect of the extinction (internal and Galactic). Whenever the flux calibration can be trusted, this function can be used to determine the extinction. Since the FLAMES/Giraffe data are not flux calibrated, the usage of a multiplicative continuum is absolutely required. This feature makes the method comparable to spectrophotometric indices, which are also insensitive to the shape of the continuum (they are similar to equivalent widths).
The degree of the polynomial is chosen to remove the signatures of continuum mismatch at the scale of 60 Å and above. The effect of the multiplicative function is thoroughly discussed in Koleva et al. (2008). There is no systematic bias of the results (age, metallicity, and kinematics) as a function of the polynomial degree, but when the degree increases, the well of the becomes deeper and sharper, allowing a better identification of the absolute minimum and giving more precise measurements. There is no degeneracy between the coefficients of the polynomial and the other parameters, even between the age and the low-degree coefficients.
Koleva et al. (2008) also stress that unlike the “rectification” or filtering approach of, e.g., Mathis et al. (2006) or Wolf et al. (2007) the information contained in the broad features like MgH, TiO, or CN bands is not altered by the continuum. For the FLAMES/Giraffe data this is demonstrated in Fig. 57, where the spectrum of a late-type star with a deep MgH 5208Å molecular band is shown with the residuals for its best-fitting PEGASE.HR stellar populations for the three different levels of the multiplicative polynomial continuum 3, 9, and 15. The stellar spectrum has been obtained in the frame of another observational programme using the same FLAMES/Giraffe setup as in our study. This fitting is not physically correct because an individual stellar spectrum cannot be represented by the spectrum of a stellar population, however, this test demonstrates very well that the fitting residuals of the MgH band do not change at all for very strong variations of the multiplicative continuum order.
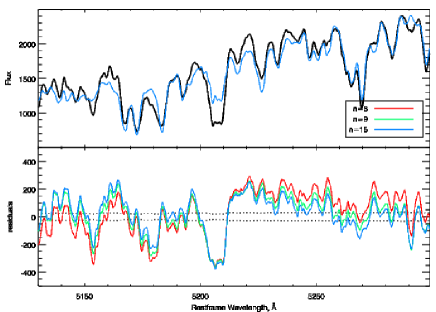
We have followed the recipe described in Sect. A2.3 of Chilingarian et al. (2007a) to determine the minimal order of the multiplicative polynomial continuum sufficient for fitting FLAMES/Giraffe data.
We have taken three objects from our sample having young (G-01), intermediate (G-07), and old (G-24) ages and fit their spectra varying the polynomial continuum order from to . Apart from an old stellar population, G-24 also exhibits a significantly super-solar [Mg/Fe] abundance ratio, providing the possibility to test how a multiplicative polynomial continuum may reduce the template mismatch. Figure 58 demonstrates the relative changes of the as well as trends of the kinematical and stellar population parameters.
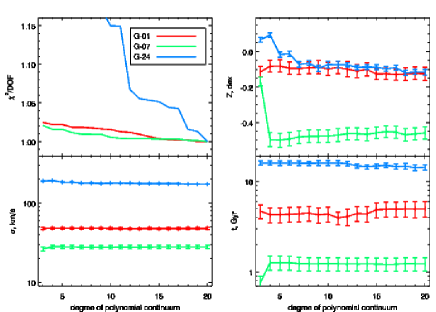
For , none of the parameters shows significant changes. For the two galaxies (G-01 and G-07) having nearly solar [Mg/Fe] abundance ratios, the trends of age, metallicity, velocity dispersion, and estimates are negligible for , however, for the third galaxy, the behaviour of the parameters becomes stable only for , although exhibits a sharp drop at a 10 percent level at . At the same time, the reduced remains almost twice its value for G-01 or G-07.
The analysis of the fitting residuals for G-24 shows that increasing the continuum order allows us to reduce the template mismatch for spectral regions containing numerous blends of iron or -element lines. In Figure 59, we present the fitting residuals for G-24 for the three different orders of the multiplicative polynomial continuum: 5, 10, and 20. One notices that the iron-dominated region between 5005 and 5050 Å is seen very well in the residuals for , but almost disappears for . Changes of the residuals become insignificant for , therefore, we have chosen as the optimal multiplicative polynomial continuum order when processing FLAMES/Giraffe data in the LR4 setup.
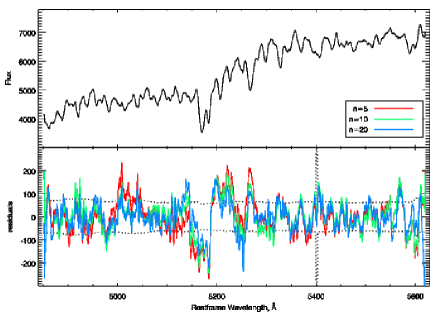
B.2 Non-solar [Mg/Fe] abundance ratios
Quite a high fraction of massive objects in our sample exhibit supersolar values of [Mg/Fe], therefore, we pose the following principal questions for the validation of our results. Does our technique produce biased estimations of single stellar population (hereafter SSP), and equivalent ages and metallicities in the cases of non-solar [Mg/Fe] abundance ratios? Do our results depend on the presence of H? If there are biases, is it still possible to apply some empirical corrections?
Presently, there are no publicly available models of spectral energy distributions of synthetic stellar populations for non-solar -element abundance ratios. Therefore we use published spectral data, where the age and metallicity can be estimated using both Lick indices and pixel fitting. We have selected in the SDSS DR6 (Adelman-McCarthy et al. 2008) 1200 spectra of galaxies having redshifts , colours , and signal-to-noise ratios . The spectral resolution information (Gaussian width of the instrumental LSF at every wavelength) is available for each individual spectrum. For Å, it increases smoothly from blue to red with values around km s-1.
We have not applied any selection criteria based on galaxy morphology. Most of the galaxies (about 95%) exhibit at least faint emission lines, the strongest one usually being [OIII] () Å. If the equivalent width of the [OIII] line was reported to be greater than zero in the SDSS data, we substituted the observed fluxes with those of the best-fitting PEGASE.HR templates in the 8Å-wide regions around , , [OIII], [NI], and 10Å-wide regions around , [OIII]. This was done to avoid contamination of the measurements of Lick indices by emission lines. We decided to use this approach rather than applying corrections based on the intensities of other well-measured emission lines multiplied by empirical coefficients because the latter technique may lead to spurious results due to: (a) extinction inside the object, affecting Balmer decrement, and, therefore, the H/H ratio; or (b) possible activity in the galactic nucleus, affecting the [OIII]/H ratio, which is unaffected by the effects of extinction. Although replacing up-to 30 percent of the counts in the index band by the best-fitting may slightly bias the measurements of the H and Mg indices toward best-fitting PEGASE.HR models, all possible biases correlated or anticorrelated with the values of the [Mg/Fe] abundance ratio should be clearly revealed at least on a qualitative level.
To measure Lick indices we have degraded the spectral resolution of the SDSS by convolving the original spectra with a Gaussian of width , where is velocity dispersion of the galaxy, is the width of the SDSS LSF and is the resolution needed to measure Lick indices, both depend on the index considered. If the value under the square root turned out to be negative, we did no degradation. Instead, the -correction according to Kuntshner (2004) was applied to the corresponding measurements of Lick indices using . The quality of the flux calibration of the SDSS DR6 spectra (Adelman-McCarthy et al. 2008; Schlegel 2007, private communication) has been dramatically improved since SDSS DR5, reaching a precision of better than one percent for relative fluxes, therefore, we consider that the absolute values of Lick indices can be trusted and not only the relative trends, as e.g., in Clemens et al. (2006), based on SDSS DR3.
The values of ages, metallicities, and [Mg/Fe] abundance ratios have been obtained by inverting the grids of SSP models for H, Mg and Fe Lick indices by Thomas et al. (2003). We have first inverted the MgFe - H grid to derive the age and mean metallicity; then another inversion of the Mg - Fe grid for the age value found in the previous step has been done to obtain [Mg/Fe] abundance ratios. In the final sample we have kept 848 SDSS spectra, having 1.4H2.6 Å and 2.0MgFe4.2 Å, corresponding to intermediate-age and old stellar populations.
The spectral fitting has been performed in the three following wavelength ranges (restframe): (1) 4100 – 5800 Å, (2) 4800 – 5600 Å, (3) 4880 – 5680 Å. We chose the first interval to cover the broad wavelength range often used in the intermediate resolution ground-based spectroscopic observations aimed at studies of stellar kinematics and stellar populations (GMOS at Gemini, MPFS at the Russian 6-m telescope, etc.). The second and third ones correspond to the wavelength ranges of the LR4 setup of FLAMES/Giraffe for objects at the redshift of Abell~496, including and excluding the age sensitive H absorption feature.
The radial velocities provided in the SDSS and found by the spectral fitting procedure coincide within the error-bars, rarely exceeding a few km s-1. The velocity dispersions (provided by the SDSS for 824 of the 1200 galaxies) remain consistent within uncertainties for km s-1, but for larger values of there is a prominent trend: the SDSS values turn out to be lower than our measurements, reaching 20 km s-1 for km s-1. This effect can be explained by the - metallicity degeneracy mentioned in Chilingarian (2006) and Chilingarian et al. (2007a) – galaxies with large velocity dispersions tend to be more metal-rich, but the quality of templates used by the SDSS team to measure velocity dispersions was not as good as PEGASE.HR, leading to underestimates of velocity dispersions for high metallicities. A correlation between and metallicity confirms this hypothesis.
The top panel of Fig. 60 shows the comparison between the age determinations based on the Lick indices and those derived from the stellar population fitting technique. The agreement between the measurements is relatively good. The spread of points has two main sources: (1) statistical uncertainties on the measurements of the Lick indices and on the results of the spectral fitting; and (2) age - metallicity degeneracy. In order to demonstrate the agreement between both methods for stellar population parameter determination, we plot a combination of age and metallicity, (according to Worthey et al. 1994) on the bottom panel of Fig. 60. A particularly good agreement is observed between the results obtained from the spectral fitting in the two wavelength ranges and from the inversion of grids of Lick indices (H and MgFe).
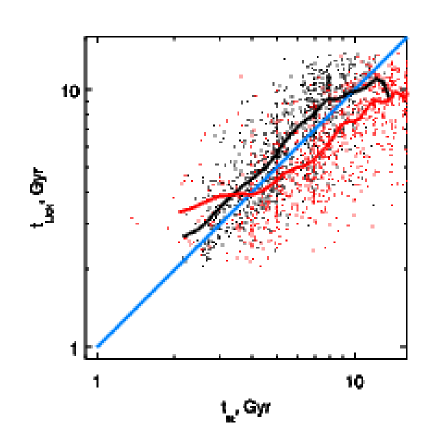
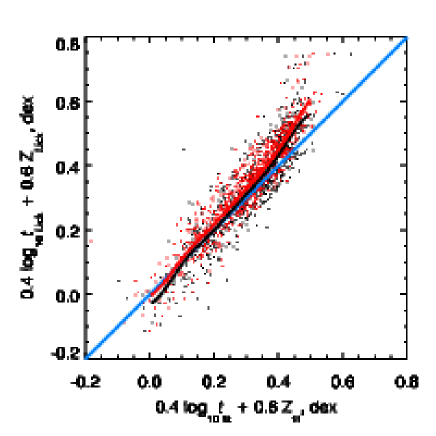
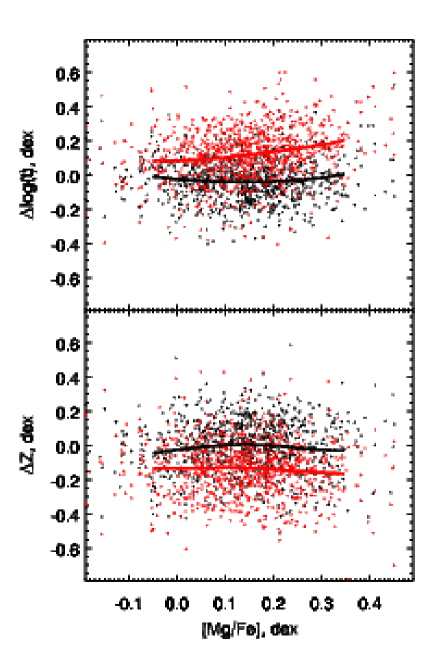
A particularly important result of this study is the fact that the age and metallicity determinations obtained from the spectral fitting are independent from the non-solar [Mg/Fe] abundance ratios of the stellar populations. This is illustrated in Fig. 61. The ordinate axes represent differences (“fit” - “Lick”) between the decimal logarithms of age (top panel) and metallicity (bottom panel) measurements for objects with various abundance ratios of [Mg/Fe]. One can notice the total absence of correlation with [Mg/Fe] ratio for both age and metallicity measurements, although there are slight systematic shifts (0.1 dex) due to age-metallicity degeneracy effects. A similar result has been found for the spectra of star clusters by Koleva et al. (2007). Since the black line indicating the mean difference for the large wavelength range is very near the zero value, we can ensure that the measurements of the Lick indices do not suffer from systematic offsets. Results obtained from the spectral fitting in the 4800 – 5600 Å and 4880 – 5680 Å wavelength ranges are absolutely consistent, showing systematic differences neither in age, nor in metallicity estimates.
We have performed the scanning of the age-metallicity parameter space to locate the absolute minima of for 600 SDSS spectra by fixing age and metallicity values and fitting only the kinematics and multiplicative polynomial continuum (as explained in Sects. 3 and B.1). All three wavelength ranges have been processed. We did this to verify how the spectral fitting procedure based on a non-linear minimisation works in the case of complex shapes of the minima. The agreement between the results of the fitting and scanning is very good for both age and metallicity. In 99 percent of the cases the “best-scanning” values coincide within the size of the bin in the space with the “best-fitting” values. In the remaining 1 percent, the determined ages are as old as the oldest population in the grid of models, so matching between the values cannot be fully trusted.
The main conclusion we draw from this Appendix is that our spectral fitting procedure is quite robust and produces unbiased age and metallicity estimates even for strongly non-solar [Mg/Fe] abundance ratios, although it is based on models having [Mg/Fe]=0. This allows us to exploit the proposed technique to study the kinematics and stellar populations not only of dwarf galaxies, known to exhibit solar [Mg/Fe] element ratios, but also of intermediate luminosity and giant early-type galaxies as well as bulges of spirals, known to be overabundant in -elements.
Appendix C Redshifts of field galaxies
In Table 4 we present the coordinates and redshifts of the 54 field galaxies in the direction of the Abell~496 cluster, observed with FLAMES/Giraffe. We do not discuss these results here. We can mention a large concentration of bright galaxies with redshifts around 0.17 and 0.19, probably members of an unknown cluster, located nearly on the same line of sight as Abell~496, and already detected by Durret et al. (2000) as structure #9 (in their Table 1).
| N | IAU Name | z | em.l |
|---|---|---|---|
| 01 | ACO496J043254.82-130920.0 | 0.0743 | + |
| 02 | ACO496J043257.55-130923.2 | 0.3164 | + |
| 03 | ACO496J043259.43-131035.9 | 0.1672 | + |
| 04 | ACO496J043300.38-131043.3 | 0.0744 | + |
| 05 | ACO496J043300.91-130944.6 | 0.2219 | + |
| 06 | ACO496J043301.05-130428.3 | 0.3451 | + |
| 07 | ACO496J043303.28-130659.2 | 0.2631 | + |
| 08 | ACO496J043306.56-130404.7 | 0.3330 | + |
| 09 | ACO496J043309.11-131434.0 | 0.0993 | + |
| 10 | ACO496J043310.78-131532.9 | 0.1734 | + |
| 11 | ACO496J043315.04-130112.4 | 0.2212 | + |
| 12 | ACO496J043315.64-131230.6 | 0.2240 | + |
| 13 | ACO496J043317.87-130450.2 | 0.4535 | + |
| 14 | ACO496J043317.97-131626.5 | 0.1275 | + |
| 15 | ACO496J043319.29-131227.7 | 0.2802 | + |
| 16 | ACO496J043319.90-130900.8 | 0.1744 | - |
| 17 | ACO496J043321.70-130804.8 | 0.3147 | + |
| 18 | ACO496J043323.02-130633.7 | 0.4551 | + |
| 19 | ACO496J043324.34-130522.1 | 0.2546 | + |
| 20 | ACO496J043327.88-130800.6 | 0.2735 | + |
| 21 | ACO496J043328.44-131858.1 | 0.3588 | + |
| 22 | ACO496J043328.51-130925.6 | 0.2790 | + |
| 23 | ACO496J043331.18-130435.3 | 0.2630 | + |
| 24 | ACO496J043332.92-130659.5 | 0.0844 | + |
| 25 | ACO496J043337.17-125808.5 | 0.1336 | + |
| 26 | ACO496J043337.21-130445.1 | 0.0842 | + |
| 27 | ACO496J043337.87-131841.6 | 0.1958 | - |
| 28 | ACO496J043338.45-130239.4 | 0.0559 | + |
| 29 | ACO496J043340.03-131342.2 | 0.3582 | + |
| 30 | ACO496J043340.63-131925.0 | 0.2730 | + |
| 31 | ACO496J043342.84-131230.9 | 0.3097 | + |
| 32 | ACO496J043346.79-131310.4 | 0.3577 | + |
| 33 | ACO496J043346.96-130948.0 | 0.1967 | - |
| 34 | ACO496J043348.07-130231.0 | 0.1795 | - |
| 35 | ACO496J043348.09-131509.4 | 0.2732 | + |
| 36 | ACO496J043348.96-130259.5 | 0.4946 | + |
| 37 | ACO496J043350.42-130214.7 | 0.1790 | + |
| 38 | ACO496J043354.89-131734.4 | 0.3451 | + |
| 39 | ACO496J043356.50-130121.2 | 0.0851 | + |
| 40 | ACO496J043356.68-131346.2 | 0.1918 | + |
| 41 | ACO496J043357.22-130609.7 | 0.1798 | + |
| 42 | ACO496J043357.62-130419.5 | 0.0695 | + |
| 43 | ACO496J043358.32-131428.7 | 0.1606 | + |
| 44 | ACO496J043358.98-130301.5 | 0.2589 | + |
| 45 | ACO496J043401.51-131544.2 | 0.1795 | - |
| 46 | ACO496J043402.18-130637.7 | 0.1797 | - |
| 47 | ACO496J043403.80-130149.4 | 0.1832 | + |
| 48 | ACO496J043404.73-130203.5 | 0.1894 | + |
| 49 | ACO496J043405.98-130722.7 | 0.1912 | + |
| 50 | ACO496J043408.53-131257.8 | 0.1714 | + |
| 51 | ACO496J043409.64-130742.6 | 0.5077 | + |
| 52 | ACO496J043410.28-130841.9 | 0.1909 | + |
| 53 | ACO496J043411.96-130522.4 | 0.1921 | + |
| 54 | ACO496J043416.79-130543.1 | 0.4347 | + |