Peak shifts due to rescattering in dipion transitions
Abstract
We study the energy distributions of dipion transitions to in the final state rescattering model. Since the is well above the open bottom thresholds, the dipion transitions are expected to mainly proceed through the real processes and . We find that the energy distributions of markedly differ from that of . In particular, the resonance peak will be pushed up by about 7-20 MeV for these dipion transitions relative to the main hadronic decay modes. These predictions can be used to test the final state rescattering mechanism in hadronic transitions for heavy quarkonia above the open flavor thresholds.
pacs:
14.40.Gx, 13.25.Gv, 13.75.LbI Introduction
Hadronic transitions between heavy quarkonia are important for understanding both the heavy quarkonium dynamics and the formation of light hadrons (for recent reviews see, e.g. Kuang06 ). Particularly, in recent years, the dipion and single pion transitions have proved to be a very efficient way to discover new or missing charmonium or charmonium-like states, the so-called ”” mesons, by Belle, Babar, and CLEO collaborations (see Olsen for a recent review and related references). To search for the partners of and in the sector, say and , a similar approach was also suggested hou . More recently, Belle has found a very striking result Belle07-5SmS that signals of with collected at the energy of 10870 MeV, i.e. at the peak of , indicate that the partial widths of are larger than that of by two orders of magnitude or more if the is the sole source of the observed dipion transition events.
If the peak at is identified with the resonance, we will have to answer the question: what is the essential difference between the and in their dipion transitions. To answer this question, in an earlier paper Meng-Y5S we use the final state rescattering model Cheng05_ReSC to study the dipion transitions of and . In this model, the first decays to , and then the meson pair turns into a lower state and two pions through exchange of another meson. Since the real rescattering contributions are expected to be dominant in these processes, the difference between and dipion transitions can be explained mainly by the difference in available phase space for the decays. Although sharing the same quantum numbers and having similar leptonic widths, the and are dramatically different in their hadronic transitions. In the real rescattering process where the resonance is above the open bottom threshold, the amplitude is basically proportional to the probability of the corresponding open bottom decay, which is proportional to the P-wave phase space factor Meng-Y5S ; Simonov07-nSmS . Here, denotes the 3-momentum of or in the rest frame of . Note that the -value of the decay is about 3.84 times larger than that of , and this fact will mainly result in a huge difference, which is about a factor of 200-600 in magnitude Meng-Y5S , between the partial widths of dipion transitions of and . (Note that the factor would give an enhancement of about 3200 for the relative to but an effective form factor associated with the coupling constants will lower the enhancement factor by about an order of magnitude, see discussions in next sections.) As a result of the rescattering mechanism, it might be unnecessary to introduce an exotic interpretation of resonance or a state to account for the experimental data Belle07-5SmS .
To further clarify the issue mentioned above, it is useful to study other features of the final state rescattering mechanism. In this paper we will show that a distinct and important consequence of the final state rescattering mechanism is the peak shift effect, which is related to the unique energy dependence of the cross section of . As a result of the final state rescattering process , the energy distributions of the events will differ from that of . In particular, the observed resonance peak in is expected to be pushed up to higher energies markedly compared with that of . The physical reason for this peak shift is quite evident that at higher energies around the resonance peak the rescattering process will acquire more phase space and then get a larger rate. This peak shift effect is an inevitable result of the final state rescattering, and therefore it can serve as a crucial test for this mechanism. In the following, we will study this effect in a more quantitative way.
II The rescattering model
As in Ref. Meng-Y5S , we assume that in the dipion transitions the two pions are produced mainly via scalar resonances coupled to intermediate mesons due to the long-distance final state interactions. The typical rescattering diagrams for are shown in Fig. 1, and the others can be related to those in Fig. 1 by charge conjugation transformation and isospin transformation and . Here, denotes scalar resonance or (perhaps also ), which will decay to eventually.
In Fig. 1, the intermediate states can be real or virtual, which corresponds respectively to the imaginary part or the real part of the amplitude. In Ref. Meng-Y5S , we argued that in general it is the real rescattering process that is dominant unless the resonance is very close to the open flavor threshold. More quantitatively, we used the dispersion relation to estimate the virtual rescattering contributions and found that they are extremely small for because is far above the threshold, whereas for , they can be comparable to the real ones but with large uncertainties Meng-Y5S . Nevertheless, this does not affect the calculated large difference between the transition widths of and . (In contrast, in the case of Meng07_X3872_ReSC or Meng07_Z4430_ReSC , the virtual rescattering effects could be dominant due to the extreme closeness between the resonance mass and the open flavor threshold.)
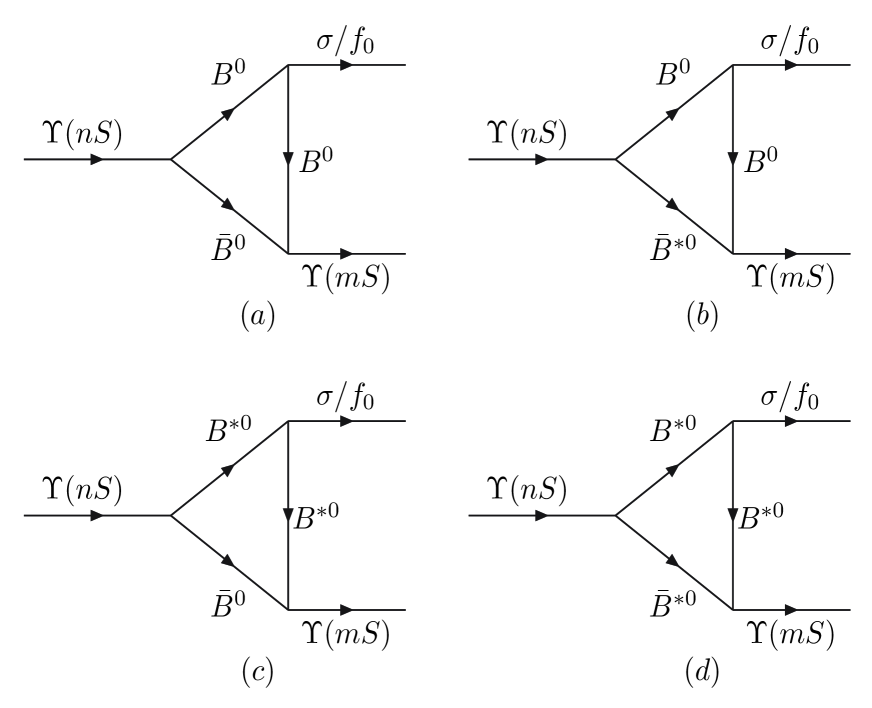
In the real rescattering processes, the amplitudes of Fig. 1(a,b,c,d) are dominated by their absorptive(imaginary) parts, which can be derived by the Cutkosky rule as Meng-Y5S :
| (1) | |||||
where , and and denote the solid angle of the on-shell system and the 3-momentum of the on-shell meson in the rest frame of , respectively.
The amplitudes and are determined by the effective Lagrangians Meng-Y5S
| (2a) | |||||
| (2b) | |||||
| (2c) | |||||
| (2d) | |||||
| (2e) | |||||
where . Here, the heavy quark symmetry and chiral symmetry in (2) are basically ensured by the kinematic conditions.
Following Ref. Meng-Y5S , we choose the on-shell coupling constants
| (3) | |||||
| (4) | |||||
| (5) | |||||
| (6) |
where the values in (3) and (4-6) are determined by the measured widths and , respectively. On the other hand, the coupling constants can be related to the well-known one Meng07_X3872_ReSC by heavy quark flavor symmetry and chiral symmetry, and we choose Meng-Y5S
To account for the off-shell effect of the exchanged meson in Fig. 1, one need introduce form factors, such as Cheng05_ReSC
| (7) |
to the vertexes and . We will fix the cutoff MeV Meng-Y5S in our numerical analysis in the next section.
We treat the scalar resonance as a narrow one and use the Breit-Wigner distribution
| (8) |
to describe the resonance in the calculation of cross sections, as the treatment of resonance in Ref. Meng07_X3872_ReSC . In (8), the variable denotes the momentum squared of , and the function is given by
| (9) | |||
The resonance parameters in (8) and the coupling constants in (9), which are listed in Tab. LABEL:Tab:Scalar-resonance, are chosen mostly from Ref. Komada01-scalar-contributions , except for from PDG2006 PDG06 .
Although the Breit-Wigner description (8) for the scalar resonance is somehow rough, especially for the , it is efficient enough to get the order of magnitude of the widths correctly Meng-Y5S . Moreover, since the final state phase space (FSPS) of is smeared by the large width of , one would not expect that this FSPS could bring on large energy dependence of the cross section, unless it happens to be near the threshold, such as the case of . We will discuss this further in the next section.
| (MeV) | (GeV) | (MeV) | (GeV) | (MeV) | |
|---|---|---|---|---|---|
| 3.06 | |||||
| 1.77 | 2.70 |
III Peak shifts in dipion transitions
In the absorptive part in (1), the amplitude is proportional to since it involves an on-shell P-wave vertex . Furthermore, a hidden factor will emerge after performing the integral in (1) explicitly. As a result, the amplitude is proportional to . As we have mentioned above, this brings on the strong -dependence of the cross section of , and may change the distribution of the signals significantly around the peak of resonance.
In general, neglecting radiative corrections and the beam-energy spread, the cross section for the process resonance hadronic final state at the center-of-mass energy can be approximately expressed by the Breit-Wigner form
| (10) |
where the resonance is parameterized by its mass , the total width , the electronic width , and the partial width for the decay channel . For the , in (10) we have neglected the weak -dependence of , . However, for the final states , the -dependence of is as strong as , and therefore can not be neglected at all.
As a first step, we will neglect the energy dependence of the total width of as well. Thus, for the final state, such as , the energy distribution of the cross section of will peak at exactly as that shown in Fig. 2 by the dashed line. We call this the naive Breit-Wigner distribution. In Fig. 2, the resonance parameters of have been chosen from PDG2006 PDG06 with the following central values of and :
| (11) |
Then, we can compare the naive Breit-Wigner distribution with the one where . For the intermediate state, the result is shown in Fig. 2 with the solid line. One can see that the strong -dependence of pushes the resonance peak up with a energy shift of about 15 MeV.

The two-body decay modes and , which are dominant ones of PDG06 , will bring on large energy dependence of and change the distributions in Fig. 2 consequently. For simplicity, we will choose the main decay mode to estimate the energy dependence of . That is,
| (12) |
which can be derived from the effective Lagrangian (2c) with being treated as a constant independent of . Here, is normalized to be 110 MeV, like that in (11).

Furthermore, one need introduce form factors for every vertexes in Fig. 1. Following Ref. Pennington , we choose the form factor
| (13) |
which is normalized to 1 at , since we have extracted the on-shell coupling constants in (4-6) at this energy point. This form factor, which is associated with the effective coupling, can be understood as the consequence of the overlap integral of the wave functions of and the two mesons, and the scale factor can be related to the effective radius of the interaction, , by Pennington . It is this form factor (or others of a similar form) that plays the role to naturally balance the otherwise over-increased decay rates with increased phase space. Namely, this form factor is a sort of ”cutoff” for the high momentum of the final state mesons. The momentum dependence of the effective couplings can partially explain why the coupling constants are smaller than the one , though for GeV-2 the suppression from the form factor is not strong enough to account for the large difference between the values in (3) and in (4-6). This suppression may be additionally due to the node structure of the wave function of highly excited Meng-Y5S .
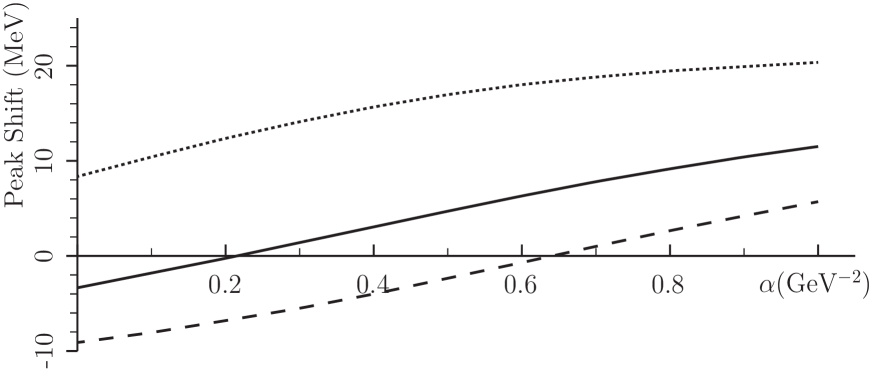
Needless to say, the form factor in (13) should also change the energy dependence of the width and the total width in (12) subsequently. Such dependence of is shown in Fig. 3. One can see that the energy dependence is significantly weakened when is about 0.6 GeV-2 (solid line in Fig. 3). As a result, the distribution of with and GeV-2, which is shown in Fig. 4 with the dashed line, is very close to the naive Breit-Wigner one.
With GeV-2 Pennington , the distributions for can be evaluated numerically. Since here we only focus on the line-shape and the peak shift, which are almost independent of the parameters except and , it is quite safe to choose the central values for other parameters introduced in the last section. The distribution for is illustrated in Fig. 4 with the solid line. Compared with the distribution for (the dashed line), the peak shift is about 7 MeV. If we choose the channel as the main hadronic channel, the peak shift can be as large as 11 MeV for the channel.

The energy distribution for has similar line-shape to that for within the energy region of 10780-10950 MeV. Furthermore, since the transition is also observed Belle07-5SmS with a large rate and quite high statistical significance (), we also evaluate its energy distribution in Fig. 4 with the dotted line. We find there is an additional peak shift of about 12 MeV relative to the distribution for . This is just because the role of the scalar resonance in Fig. 1. In our model Meng-Y5S , the final-state are assumed to be dominated by the scalar resonance (…) Komada01-scalar-contributions , which can be described by the Breit-Wigner distribution (8) at the cross-section level. If the mass of the resonance is chosen as MeV given in Tab. LABEL:Tab:Scalar-resonance, then one can easily find that the mass difference MeV happens to be in the center of the distribution in (8). As we have mentioned in the end of the last section, this brings on another strong -dependence to the cross section for . Thus, the distribution for is pushed up farther than those for . Similarly, there will be a long tail in the distribution for within the energy region of 10950-11100 MeV due to the emergence of the scalar resonance .
It is worth emphasizing that the scalar resonance dominance is just a simplification to study the effects of the final state rescattering mechanism in the transitions Meng-Y5S . Thus, the differences between the distributions for tend to disappear if the non-resonance contributions and their interference with the scalar resonances are important. Therefore, to detect the differences between the distributions for can provide useful information on the role of the scalar resonances in these transitions. More valuable information can also be given by the measurements on the spectrum and the distribution of the helicity angle Belle07-5SmS .
It is obvious that the position of the resonance peaks of in channels depend on the value of the scale factor in the form factor (13). However, the energy distributions of in other main hadronic decay channels (e.g., …) also depend on the same factor . So, it is essential to compare the line-shape for e.g. with those main hadronic decay channels with different choices of the value of the scale factor. For GeV-2, the results are shown in Fig. 5, where the channel is used to serve as one of the main hadronic channels again.
In Fig. 5, with a reasonable choice for the cutoff factor , say, 0.3-0.8 GeV-2, the relative peak shifts for are found to be almost independent of the cutoff. Thus, we incline to conclude that there should be a peak shift of about 7 MeV for the distribution of in the channel compared with that in the channel. Similar shift should be obtained in the channel. On the other hand, the shift in the channel could be 12 MeV larger than those in the channels, but this depends on the assumption that the scalar resonance dominates the transition. Furthermore, if the is chosen as the main hadronic channel, the peak shifts will be enlarged by MeV.
IV Summary
In summary, we study the energy distributions of dipion transitions to in the final state rescattering model. Since the is well above the open bottom thresholds, the dipion transitions can proceed through the real process and the subsequent process . This model can not only explain the observed unusually large rates of Meng-Y5S , but also predict a unique energy dependence of the cross sections of . We find that the energy distributions of markedly differ from that of , and in particular, the resonance peak will be pushed up by about 7-20 MeV for these dipion transitions relative to the main hadronic decay modes. These predictions can be used to test the final state rescattering mechanism in hadronic transitions for heavy quarkonia above the open flavor thresholds.
Acknowledgements.
We are grateful to K.F. Chen, Y. Sakai, C.Z. Yuan, Z.P. Zhang, and S.L. Zhu for useful discussions. One of us (K.T.C.) would like to thank the Belle Collaboration and Y. Sakai for the hospitality during his visit to KEK, Japan. This work was supported in part by the National Natural Science Foundation of China (No 10675003, No 10721063).References
- (1) Y. P. Kuang, Front. Phys. China 1, 19 (2006); M.B. Voloshin, arXiv:0711.4556[hep-ph], to appear in Prog. Part. Nucl. Phys.; E. Eichten, S. Godfrey, H. Mahlke, J.L. Rosner, arXiv:hep-ph/0701208.
- (2) S.L. Olsen, arXiv: 0801.1153 [hep-ex], to appear in Chin. Phys. C.
- (3) W.S. Hou, Phys.Rev. D74, 017504 (2006).
- (4) K.F. Chen et al. [Belle Collaboraion], arXiv: 0710.2577 [hep-ex].
- (5) C. Meng, K.T. Chao, Phys. Rev. D77, 074003 (2008) (arXiv: 0712.3595 [hep-ph]).
- (6) H.Y. Cheng, C.K. Chua and A. Soni, Phys. Rev. D71, 014030 (2005); P. Colangelo, F. De Fazio and T. N. Pham, Phys. Lett. B542 71 (2002); Phys. Rev. D69 054023 (2004); X. Liu, B. Zhang and S.L. Zhu, Phys. Lett. B645, 185 (2007).
- (7) Yu.A. Simonov, JETP Lett. 87 147 (2008) (arXiv: 0712.2197 [hep-ph]); arXiv: 0804.4635 [hep-ph].
- (8) C. Meng, K.T. Chao, Phys. Rev. D75, 114002 (2007).
- (9) C. Meng, K.T. Chao, arXiv:0708.4222[hep-ph].
- (10) W. M. Yao et al., J. Phys. G 33, 1 (2006); see also the Website: http://pdg.lbl.gov/.
- (11) T. Komada, M. Ishida and S. Ishida, Phys. Lett. B 508, 31 (2001); 518, 47 (2001).
- (12) M.R. Pennington and D.J. Wilson, Phys. Rev. D76, 077502 (2007).