The millimeter-wave continuum spectrum of Centaurus A and its nucleus
Abstract
Aims. We study the radio emission mechanism of the FR-I AGN NGC 5128 (Centaurus A)
Methods. We determine the centimeter and millimeter continuum spectrum of the whole Centaurus A radio source and measure at frequencies between 86 GHz (3.5 mm) and 345 GHz (0.85 mm) the continuum emission from the active radio galaxy nucleus at various times between 1989 and 2005.
Results. The integral radio source spectrum becomes steeper at frequencies above 5 GHz, where the spectral index changes from = -0.70 to = -0.82. The SW outer lobe has a steeper spectrum than the NE middle and outer lobes ( = -1.0 vs -0.6). Millimeter emission from the core of Centaurus A is variable, a variability that correlates appreciably better with the 20-200 keV X-ray variability than with 2 - 10 keV variability.
Conclusions. In its quiescent state, the core has a spectral index = -0.3, which steepens when the core brightens. The variability appears to be mostly associated with the inner nuclear jet components that have been detected in VLBI measurements. The densest nuclear components are optically thick below 45-80 GHz.
Key Words.:
Galaxies – individual: NGC 5128 – centers; radio continuum: Centaurus A – AGN1 Introduction


| Frequency | Flux Densities | Polarized Flux Densities | ||||
|---|---|---|---|---|---|---|
| Total | NE Lobes+Core | SW Lobes | Total | NE Lobes+Core | SW Lobes | |
| (GHz) | Jy | |||||
| 23 | 11213 | 769 | 294 | 6.80.5 | 5.00.3 | 1.80.2 |
| 33 | 8212 | 628 | 204 | 4.60.6 | 3.60.3 | 0.80.2 |
| 41 | 729 | 566 | 163 | 3.80.5 | 3.40.5 | 0.40.2 |
| 61 | 5615 | 4812 | 83 | 4.01 | 4.01 | — |
| 93 | 4118 | 4718 | -69 | 3.51 | 3.51 | — |
Centaurus A (NGC 5128) is the nearest (D = 3.4 Mpc) radio galaxy with an active nucleus. Because of this, it has been extensively studied at various wavelengths over a very wide range in the electromagnetic spectrum; much of the observational database was reviewed by Israel (1998). The radio source spans more than eight degrees on the sky and shows structure on all scales down to milliarcseconds where VLBI techniques (e.g. Horiuchi et al. 2006) reveal an extremely compact core and bright nuclear jets. Notwithstanding the prominence of Centaurus A, relatively few measurements of the total radio emission of the source exist. The first comprehensive study of its decimetric emission and polarization by Cooper et al (1965) has, in more recent times, been supplemented only by the measurements summarized by Alvarez et al. In particular, no measurements of the Centaurus A total flux density at frequencies above 5 GHz are found in the astronomical literature. In this paper, we extend that range by providing new determinations between 20 GHz and 100 GHz derived from the WMAP all-sky surveys.
On much smaller scales, the flux densities of the compact Centaurus A core are also of interest. The central region of Centaurus A has been imaged at very high resolution with (space) VLBI techniques (Meier et al. 1989; Tingay et al. 1998, Fujisawa et al, 2000, Tingay, Preston Jauncey 2001, Horiuchi et al. 2006) up to frequencies of 22 GHz, where both the selfabsorbed synchrotron emission from the core and the free-free absorbing foreground start to become optically thin (Tingay Murphy 2001). Although Kellerman, Zensus Cohen (1997) used the VLBA to observe Centaurus A at the significantly higher frequency 43 GHz, they did not actually measure nuclear flux densities. Hawarden et al. (1993) have provided the most recent systematic attempt to derive the core spectrum from single-dish measurements, and they conclude that it is essentially flat at millimeter wavelengths, a conclusion reiterated by Leeuw et al (2002).
Variability of the emission at frequencies of 22 and 43 GHz was explicitly noticed by Botti Abraham (1993), de Mello Abraham (1990), and Abraham et al. (2007). However, these results, as well as those by Tateyama Strauss (1992), generally suffered from low spatial resolutions of 2–4 arcmin that do not allow separate identification of emission from the nucleus, the jets, and their surroundings. In this paper, we provide new flux density measurements of the compact core in the 90–345 GHz (sub)millimeter range, at resolutions between 0.8 and 0.2 arcmin. As these measurements were collected over a time period spanning more than a decade, we are also in a position to study the variable behavior of this emission.
2 Observations and reduction
2.1 WMAP data
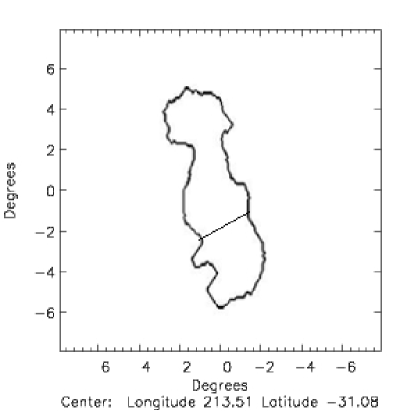
The WMAP mission and its data products have been described in detail by Bennett et al (2003a, b, c). In our analysis, we used the data products from the official WMAP 5-year release, specifically the fully reduced and calibrated Stokes I, Q, and U maps of the entire sky, in nested HEALPIX format (Hinshaw et al. 2008). The maps were observed at frequencies (assuming synchrotron spectra) = 22.5, 32.7, 40.6, 60.7, and 93.1 GHz with resolutions of 53, 40, 31, 21, and 13 arcmin respectively. As a first step, the HEALPIX data maps were converted with the use of standard software to flat maps in Zenithal Equal Area projection with pixel solid angles of and intensities in mK. We first attempted to determine integrated flux densities by fitting in each map two-dimensional Gaussians to the emission corresponding to Centaurus A. However, with increasing frequency, both the beamsize and the total flux density decrease, resulting in a steep decline in flux density per beam. Our fitting results, not surprisingly, suggests that we were systematically missing low-surface-brightness extended emission. For this reason, we also integrated over the full extent of the Centaurus A radio source as shown in the maps by Cooper et al. (1965) - the mask used is depicted in Fig. 2, bottom right. We derived the flux densities given in Table 1 from the summed values with the conversion factor Jy/mK = 30.7 . This yielded the flux densities given in Table 1, which correspond to the maps shown in Fig. 2. We verified the accuracy of this procedure by also applying it to the strongest WMAP point sources J0319+4131, J0322-3711, J0423-0120, J1229-0203, J1230+1223, and J1256-0547 (Wright et al. 2008). For polarization measurements, the Q and U maps were reduced using the same conversion factors as the I maps; the polarized intensity was computed as . Only at 23 GHz are signal-to-noise ratios high enough to yield practically identical results for the gaussian-fitting and integration methods. We consider the integrated flux densities at 23, 33, and 41 GHz to be quite reliable, whereas at 61 GHz and 93 GHz much of the integration was over areas with a surface brightness very close to the noise, especially in the southern lobe.
In the total-intensity (I) maps, the spatial resolution blends all components into the dominant emission of the NE and SW radio lobes, respectively. Even at the highest frequency, the compact core cannot be separated from the intense NE lobe. This is different in the polarized intensity (P) maps. In the 23, 33, and 41 GHz P-maps, the compact core can be seen separately. At the higher frequencies, the signal-to-noise ratio of the P-maps is too low to yield useful results. We note that the central 22 GHz flux densities of Cen A typically range between 16 and 29 Jy in a beam (Fogarty Schuch 1975; Botti Abraham 1993), i.e. roughly 15–25 of the 23 GHz WMAP flux densities. At the same frequency, the VLBI milli-arcsec core (Tingay et al. 2001) contributes only to the measured WMAP emission.
Figure 2 shows the presence of an extended diffuse emission feature to the east of the SW lobe. This feature can be seen at all frequencies and is undoubtedly real. However, we do not consider it to be related to Centaurus A. (1) Large-scale maps show significant foreground emission from the Milky Way reaching up to the Galactic latitude of Centaurus A (see Bennett et al. 2003b). (2) Inclusion of this feature in the flux densities of the SW lobe causes its emission to first decrease with frequency but then to make a surprising jump at 61 GHz, and at 93 GHz the weak SW lobe would have become as strong as the NE lobe + core emission. (3) The lobes of Centaurus A are clearly polarized, whereas the diffuse feature does not show polarization at any frequency (Fig. 2, bottom row), which also argues against the feature being an extension of the SW lobe. Finally, (4) there is a similar but more obviously unrelated feature at +2∘, 8∘.
2.2 SEST data
The SEST was a 15 m radio telescope located at La Silla, Chile. 111The Swedish-ESO Submillimeter Telescope was operated jointly by the European Southern Observatory (ESO) and the Swedish Science Research Council (NFR). The main purpose of our observing program with the SEST was to obtain high-resolution molecular-line absorption spectra against the continuum of the Centaurus A core, with integration times ranging from 30 minutes to 4 hours per molecular transition per session, obtained by co-adding individual samples usually of 5 minutes each.
| Day | Date | Frequency | Brightness | Flux Density | Day | Date | Frequency | Brightness | Flux Density |
|---|---|---|---|---|---|---|---|---|---|
| (GHz) | Tmb (mK) | Sν (Jy) | (GHz) | Tmb (mK) | Sν (Jy) | ||||
| 1989.29 | Apr 15 | 87 | 37345 | 7.20.9 | 1998.61 | Aug 15 | 90 | 28618 | 7.10.7 |
| 1989.50 | Jul 3 | 89 | 39115 | 7.30.7 | 230 | 13810 | 5.70.6 | ||
| 98 | 3937 | 7.50.8 | 1998.99 | Dec 30 | 90 | 32113 | 8.00.8 | ||
| 110 | 31320 | 5.90.6 | 150 | 22616 | 6.80.7 | ||||
| 113 | 3539 | 6.60.7 | 1999.10 | Feb 04 | 90 | 27716 | 6.90.7 | ||
| 220 | 22324 | 5.00.7 | 150 | 18420 | 5.50.6 | ||||
| 227 | 20844 | 4.30.8 | 1999.12 | Feb 11 | 90 | 30416 | 7.60.8 | ||
| 1991.03 | Nov 01 | 88 | 37120 | 7.10.8 | 150 | 28337 | 8.51.2 | ||
| 89 | 36921 | 7.00.8 | 1999.13 | Feb 18 | 90 | 33324 | 8.30.6 | ||
| 91 | 36120 | 6.90.8 | 150 | 28233 | 8.51.0 | ||||
| 114 | 36125 | 6.80.9 | 1999.38 | May 17 | 86 | 37245 | 7.00.9 | ||
| 1992.53 | Jul 13 | 89 | 51611 | 9.71.0 | 90 | 37345 | 7.10.9 | ||
| 91 | 5167 | 9.71.0 | 98 | 36245 | 6.90.7 | ||||
| 99 | 48831 | 9.21.2 | 110 | 37745 | 7.20.7 | ||||
| 218 | 26311 | 5.50.6 | 169 | 16845 | 5.50.6 | ||||
| 220 | 32660 | 6.81.3 | 226 | 27645 | 5.50.6 | ||||
| 226 | 28935 | 5.80.8 | 230 | 25045 | 5.10.5 | ||||
| 268 | 21013 | 4.80.7 | 267 | 19045 | 4.40.8 | ||||
| 1993.55 | Jul 20 | 218 | 38440 | 8.00.8 | 1999.49 | Jun 26 | 90 | 39414 | 9.81.0 |
| 226 | 35440 | 7.30.7 | 150 | 29716 | 8.90.9 | ||||
| 268 | 32937 | 7.60.8 | 1999.61 | Aug 12 | 90 | 29918 | 7.50.8 | ||
| 346 | 29230 | 7.60.8 | 115 | 28540 | 7.71.1 | ||||
| 357 | 23835 | 5.60.6 | 150 | 29918 | 9.00.9 | ||||
| 1996.67 | Aug 31 | 110 | 35317 | 6.70.7 | 1999.98 | Dec 25 | 90 | 29225 | 7.30.7 |
| 115 | 33331 | 6.30.6 | 150 | 25026 | 7.50.8 | ||||
| 145 | 27514 | 5.50.6 | 2000.37 | May 15 | 85 | 40821 | 7.80.8 | ||
| 1996.97 | Dec 19 | 90 | 41020 | 10.31.0 | 89 | 39719 | 7.40.8 | ||
| 229 | 20020 | 8.20.8 | 98 | 37424 | 7.20.7 | ||||
| 1996.99 | Dec 29 | 90 | 38020 | 9.51.0 | 111 | 37422 | 7.10.7 | ||
| 229 | 16020 | 6.61.6 | 219 | 23320 | 4.80.5 | ||||
| 1997.10 | Feb 06 | 90 | 35010 | 8.80.9 | 262 | 20568 | 4.70.5 | ||
| 150 | 25020 | 7.50.8 | 267 | 22730 | 5.20.6 | ||||
| 1997.15 | Feb 21 | 90 | 37010 | 9.30.9 | 2002.07 | Jan 25 | 87 | 52130 | 9.81.0 |
| 150 | 29010 | 8.70.9 | 91 | 49525 | 9.40.9 | ||||
| 1997.30 | Apr 19 | 90 | 36030 | 9.00.9 | 109 | 40650 | 8.61.0 | ||
| 1997.68 | Sep 05 | 87 | 44020 | 8.30.8 | 267 | 24370 | 5.51.6 | ||
| 89 | 42050 | 7.90.9 | 2002.36 | May 10 | 84 | 48211 | 8.90.9 | ||
| 113 | 35355 | 6.60.8 | 85 | 4775 | 9.00.9 | ||||
| 145 | 31830 | 6.30.6 | 87 | 47527 | 8.90.9 | ||||
| 150 | 39330 | 6.00.6 | 88 | 45923 | 8.60.9 | ||||
| 220 | 26550 | 5.41.0 | 89 | 47615 | 8.90.9 | ||||
| 1998.49 | Jun 28 | 90 | 26020 | 6.50.7 | 93 | 51114 | 9.51.0 | ||
| 150 | 30020 | 9.00.9 | 97 | 46115 | 8.80.9 | ||||
| 1998.50 | Jul 03 | 89 | 42420 | 8.00.8 | 109 | 43825 | 8,30.8 | ||
| 98 | 37020 | 7.00.7 | 147 | 37517 | 7.40.7 | ||||
| 218 | 33520 | 6.90.7 | 218 | 21317 | 4.40.5 | ||||
| 227 | 21220 | 4.00.8 | 220 | 30033 | 6.10.6 | ||||
| 1998.59 | Aug 08 | 90 | 29010 | 7.30.7 | 227 | 29014 | 5.90.6 | ||
| 150 | 24010 | 7.20.7 | 230 | 28028 | 5.70.6 | ||||
| 1998.60 | Aug 14 | 90 | 28020 | 7.00.7 | 262 | 20442 | 4.60.7 | ||
| 230 | 14020 | 5.70.9 | 2002.96 | Apr 15 | 89 | 38443 | 7.20.8 | ||
| 220 | 22745 | 4.60.9 | |||||||
| 2003.16 | Feb 26 | 85 | 42122 | 8.00.8 | 2003.21 | Mar 16 | 83 | 47825 | 9.10.9 |
| 87 | 43713 | 8.20.8 | 85 | 45516 | 8.70.9 | ||||
| 88 | 42016 | 7.90.8 | 86 | 53220 | 10.01.0 | ||||
| 89 | 41624 | 7.80.8 | 89 | 50841 | 9.51.0 | ||||
| 107 | 43217 | 8.10.8 | 91 | 47929 | 8.90.9 | ||||
| 218 | 29023 | 6.00.6 | 104 | 46717 | 8.80.9 | ||||
| 220 | 27845 | 5.70.9 | 110 | 43834 | 8.30.8 | ||||
| 227 | 28632 | 5.80.7 | 169 | 35319 | 7.20.7 | ||||
| 262 | 24138 | 5.40.8 | 220 | 22030 | 5.60.9 | ||||
| 226 | 29828 | 6.00.6 | |||||||
| 227 | 24430 | 6.10.7 |
| Day | Date | Frequency | Main-Beam | Flux Density | Day | Date | Frequency | Main-Beam | Flux Density |
|---|---|---|---|---|---|---|---|---|---|
| Brightness | Sν | Brightness | Sν | ||||||
| (GHz) | Tmb (mK) | (Jy) | (GHz) | Tmb (mK) | (Jy) | ||||
| 1997.09 | Feb 01 | 330 | 32722 | 5.80.6 | 2003.36 | May 05 | 265 | 5.40.7 | |
| 2002.28 | Apr 12 | 230 | 6.30.9 | 2003.50 | Jul 01 | 265 | 4.10.6 | ||
| 268 | 5.90.9 | 330 | 8.41.3 | ||||||
| 2002.47 | 268 | 6.20.9 | 2004.30 | Apr 17 | 345 | 7.21.1 | |||
| 2003.24 | Mar 30 | 268 | 6.10.9 | 2004.57 | Jul 26 | 330 | 6.30.9 | ||
| 330 | 7.91.2 | 2005.23 | Mar 23 | 330 | 4.40.7 | ||||
| 345 | 5.20.8 |
In the time period 1989-1993, observations were made with Schottky barrier diode receivers providing single-sideband (SSB) system temperatures, including the sky, of 500 K (3 mm band) and 1000 K (1.3 mm band). From 1996 onwards until the closure of the SEST in 2003, observations were made with Superconductor-Insulator-Superconductor (SIS) tunnel junction receivers operating simultaneously in either (i) the 3 mm and 2 mm bands, or (ii) the 3 mm and 1.3 mm bands. Typical system temperatures, including the sky, were 220 K in the 3 mm band and 330 K in the 1.3 mm bands. Continuum pointings were frequently performed on Centaurus A itself; monitoring the continuum level during the observations provided an additional and very valuable check on tracking accuracy. During the long integrations, the r.m.s. pointing was on average on the order of 5′′ or better. All observations were made in double-beamswitching mode, with a 6 Hz switching frequency and a throw of 12′ because this procedure yielded excellent and stable baselines. SEST beam sizes and main-beam efficiencies at the various observing frequencies were listed by Israel (1992); they were 41′′-57′′ and 0.70-0.75 in the 3 mm band, and 23′′ and 0.5 in the 1.3 mm band. Whenever feasible, we used the observatory high- and low- resolution acousto-optical spectrometers (AOS) in parallel.
For this paper, we extracted the continuum flux density from measurements with the low-resolution backend (bandwidth 500 MHz, resolution 1 MHz). To this end, we averaged, for each 5-minute sample, the continuum levels in the 0-300 km s-1 and 800-1100 km s-1 velocity intervals, straddling but avoiding the central line emission profiles. Individual sample continuum antenna temperatures were then converted to flux densities. The conversion typically ranged from 25 Jy/K at 86 GHz, 27 Jy/K at 115 GHz, 30 Jy/K at 147 GHz, to 41 Jy/K at 230 GHz. The flux densities listed in Table 2 for each observed frequency are the means of the individual samples observed at the frequency and run listed. Observing runs typically lasted four to eight days; the median date is given. In determining the means, we left out samples negatively affected by pointing drift, which were easily recognized by a slow but steadily decreasing continuum level.
From 1996 to 1999, the Centaurus A continuum intensity was also monitored every few months at frequencies of 90, 150, and 230 GHz in a dedicated program. The observations were performed in the dual beam switch mode with a 12′ throw, and the data were taken simultaneously at either 90/150 or 90/230 GHz. Individual exposures were kept short to minimize the effect of the atmosphere and to allow a filtering of spectra with poor quality. The r.m.s. values from the pointing runs were typically better than 3′′. For each of the individual spectra, the continuum flux level was determined by fitting a zeroth-order line. Finally, the average was determined by a least-square fit to the fitted continuum levels and error of all the individual measurements.
The quality of the data is a function of the stability of the sky (which determines the accuracy of the double-beamswitch signal subtractions) and the accuracy of the pointing. As the pointing depends on the proper evaluation of a series of boresight observations taken in sequence, it is itself a function of sky stability. In general, observations in the 3 and 2 mm windows profited from transparent sky conditions superior to those encountered in the 1 mm window. In addition, a particular r.m.s. pointing error has a greater effect on smaller beamsizes, i.e. at higher frequencies. For this reason, observations around e.g. 90 GHz have the highest quality, and those at 220/230 GHz are associated with larger relative errors.
2.3 JCMT data
From 2002 through 2005, similar molecular line observations were made with the 15m James Clerk Maxwell Telescope (JCMT) on Mauna Kea (Hawaii). 222The James Clerk Maxwell Telescope is operated on a joint basis by the United Kingdom Particle Physics and Astrophysics Council (PPARC), the Netherlands Organisation for Scientific Research (NWO), and the National Research Council of Canada (NRC).. They were made in beamswitching mode with a throw of in azimuth using the DAS digital autocorrelator system as a backend. As the low declination of Centaurus A brings the source to less than 30o above the horizon as seen from Hawaii, observations were performed in timeslots covering one hour at either side of transit. For all spectra, we scaled the observed continuum antenna temperature to flux densities by assuming aperture efficiencies = 0.57 at 230-270 GHz and = 0.49 at 330-345 GHz.

3 Results and analysis
3.1 The overall Centaurus A radio source spectrum
In Fig. 3 we show the spatially integrated radio spectrum of Centaurus A from 85 MHz to 90 GHz. The lower-frequency flux densities have all been taken from the literature as compiled, corrected, and discussed by Alvarez et al. (2000), who found a spectral index = -0.700.01 () corresponding to the solid line in Fig. 3. The higher-frequency points were taken from Table 1. A least-square fit indicates a slightly steeper spectrum with spectral index = -0.820.07 and a spectral turnover by somewhere between 5 and 20 GHz (see also Junkes et al. 1997). The more poorly defined spectrum of the SW lobe is steeper than that of the NE lobe with vs , but this difference is barely significant.
In these spectra and flux densities, we do not include the contribution by the extended emission feature east of the SW lobe discussed above. If we were to do so, its relatively strong presence at the higher frequencies would flatten the high-frequency spectrum to the one indicated by the open triangles in Fig. 3 (with ). The slope of that spectrum is very similar to that at the lower frequencies, but the spectrum itself is offset in flux density by about a factor of two and does not fit very well onto the lower-frequency spectrum. It is clear from Fig. 3 that the emission from the diffuse feature becomes negligible compared to the Centaurus A total at frequencies below frequencies 20 GHz. The low Galactic latitude of Centaurus A also has some effect at much lower frequencies. For instance, Cooper et al. (1965) briefly discuss the presence of a relatively weak spur of Galactic foreground synchrotron emission at the southeastern tip of Centaurus A. The location and extent of this spur is indicated in their Fig. 1. The WMAP diffuse feature is close to, but not coincident with, the spur and appears to be unrelated to it. Indeed, none of the radio continuum maps shown by Cooper et al. (1965) and Junkes et al. (1993) in the range of 0.4 to 4.8 GHz shows emission coincident with the WMAP feature.
There is some evidence that the ratio of the flux densities of the NE lobes (including the central core emission) and the SW lobes increases with frequency. At 0.4 and 1.4 GHz, = 1.5 (Cooper et al. 1965, Junkes et al. 1993), but this has increased to in the 23–41 GHz range (Table 1). Even if we were to add the suspected foreground emission to that of the SW lobe, we still would have a ratio in the well-determined 23–43 GHz range. We note that Alvarez et al. (2000) have found that, over the full 0.08–43 GHz range, at least the inner lobes also have a ratio = 1.5. For the giant outer lobes they find a lower ratio = 0.9, but this only applies to the limited 0.4–5.0 GHz range. The meaning of these apparent changes in ratio is not clear to us.
The fraction of polarized emission is well-defined between 23 GHz and 41 GHz. The lower-frequency, higher-resolution maps by Cooper et al. (1965) and Junkes et al. (1993) show overall polarization increasing from at 960 MHz to at 5 GHz/. We find much lower polarized fractions. The polarization of the entire source is within the errors constant over the 23–61 GHz range with . As Fig. 2 shows, the beam-averaged polarization direction is different for all three components. The low polarization fraction found by us most likely reflects the significant beam depolarization caused by the low resolution of the WMAP data.
3.2 Millimeter-wave emission of the Centaurus A core region

| Epoch | Flux Density (Jy) | Spectral | |||
|---|---|---|---|---|---|
| Index | |||||
| 1989.29 | 7.1 | — | — | — | — |
| 1989.50 | 7.3 | — | 4.5 | — | — |
| 1991.03 | 7.0 | 6.6 | — | — | — |
| 1992.53 | 9.8 | 7.3 | 5.7 | — | -0.58 |
| 1993.55 | — | — | 7.7 | 6.6 | — |
| 1996.67 | 7.6 | 5.4 | — | — | — |
| 1996.97 | 10.3 | — | 8.2 | — | — |
| 1996.99 | 9.5 | — | 6.65 | — | — |
| 1997.10 | 8.8 | 7.5 | — | 5.7 | -0.32 |
| 1997.15 | 9.3 | 8.7 | — | — | — |
| 1997.30 | 9.0 | — | — | — | — |
| 1997.68 | 7.8 | 6.2 | 5.1 | — | -0.45 |
| 1998.49 | 6.5 | 9.0 | — | — | — |
| 1998.50 | 7.7 | 6.2 | 5.1 | — | -0.43 |
| 1998.59 | 7.3 | 7.2 | — | — | — |
| 1998.60 | 7.0 | 6.3 | 5.7 | — | -0.22 |
| 1998.61 | 7.1 | 6.3 | 5.7 | — | -0.23 |
| 1998.99 | 8.0 | 6.8 | — | — | — |
| 1999.10 | 6.9 | 5.5 | — | — | — |
| 1999.12 | 7.6 | 8.5 | — | — | — |
| 1999.13 | 8.3 | 8.5 | — | — | — |
| 1999.38 | 7.2 | 6.1 | 5.3 | — | -0.33 |
| 1999.49 | 9.8 | 8.9 | — | — | — |
| 1999.61 | 7.5 | 9.0 | — | — | — |
| 1999.98 | 7.3 | 7.5 | — | — | — |
| 2000.37 | 7.5 | 6.0 | 4.9 | — | -0.44 |
| 2002.07 | 9.5 | 7.3 | 5.9 | — | -0.50 |
| 2002.28 | — | — | 6.3 | — | — |
| 2002.36 | 9.0 | 7.0 | 5.8 | — | -0.50 |
| 2002.47 | — | — | 6.6 | — | — |
| 2002.96 | 7.2 | 5.6 | 4.5 | — | — |
| 2003.16 | 7.9 | 6.6 | 5.7 | — | -0.35 |
| 2003.21 | 9.1 | 7.2 | 5.9 | — | -0.46 |
| 2003.24 | — | — | 6.5 | 6.6 | — |
| 2003.36 | — | — | 5.8 | — | — |
| 2004.30 | — | — | — | 7.2 | — |
| 2004.57 | — | — | — | 6.2 | — |
| 2005.23 | — | — | — | 4.3 | — |
| Means | 8.1 | 7.1 | 5.9 | (6.1) | -0.33 |


Although the extended radio emission from Centaurus A even at millimeter wavelengths significantly exceeds that of the core region, its surface brightness is low and declines rapidly with increasing frequency. Can it, however, be safely ignored in the flux density measurements of the core with the SEST beam? The highest frequency measured with WMAP, 93 GHz, corresponding to a wavelength of 3.2 mm, is in the lowest band that the SEST offered for ground based millimeter-wave molecular line observations. The measured gaussian-fitted flux density at this frequency is S93(tot) = 245 Jy, well above the flux density = 91 Jy that single-dish measurements suggest for the Centaurus A core region. Excluding the core, the mean surface brightness at 90 GHz of the extended synchrotron emission component is about 115 mJy/arcmin2. The contribution of the extended nonthermal component can thus safely be neglected in the relatively high-resolution observations of the core.
At very high frequencies, thermal emission from dust may also contribute to measured intensities, but this is not the case in the frequency range of interest to us. The continuum emission seen at resolutions of a few tenths of an arcminute by telescopes such as the SEST and the JCMT, effectively originates in a point source as can clearly be seen in the 850m (345 GHz) SCUBA images published by Mirabel et al. (1999) and Leeuw et al. (2002). From these and our own data, we deduce that the extended emission, after correction for 20 CO line contamination, contributes less than 4 to the central peak intensity at 345 GHz, and this contribution drops rapidly with decreasing frequency. In the next section we will return to this issue.
To study the temporal behavior of the mm-wave continuum spectrum of the core, we have reduced the measurements listed in Table 3 to standard frequencies of 90, 150, and 230 GHz. We performed a linear regression on all flux density/frequency pairs measured during a run, and for each run determined the best-fitting ‘standard’ flux densities by interpolation, as well as the effective spectral index between 90 and 230 GHz. As a consequence of this procedure, the results for each run, given in Table 4, are more robust than the individual measurements taken during that run. Typical uncertainties are about 0.3 Jy at 90 GHz and 0.6 at 230 GHz. Although the sampling in time was not uniform, we have given the mean flux density over the whole period for each frequency at the bottom of Table 4. If more detailed information is absent, these values are the best guess for the core flux densities at any time not covered by the monitor. We have also listed the rather flat spectral index defined by these ‘best’ points, with the important caveat that the three standard flux densities defining the means were not sampled at the same times.
3.3 Core variability at mm wavelengths
In Fig. 4 we have plotted all observed 90 GHz flux densities from Table 2 and added the available (SEST) values from the literature (Tornikoski et al., 1996; Wiklind Combes 1997) fortunately filling in much of the gap created by our lack of monitoring Centaurus A in the period 1993-1997. It was clear from the start that the core of Centaurus A is variable. In Fig. 4 we illustrate this variability of core flux density. Over the period monitored, the flux density never drops much below 7 Jy, but at times may be higher than 10 Jy. Sustained periods of relatively high flux densities appear to have occurred in 1993/1994, 1997, and 2001/2002. There is no doubt that this variability is real. The excursions exceed the uncertainty associated with individual plotted values, and the behavior is similar at all observed frequencies. At 90 GHz, the core flux density is seen to change by as much as 20 in a few weeks. This is illustrated in Fig. 5, which plots the percentage change from one observing date to another as a function of the elapsed time. Over the observed period, the greatest changes (more than 25) take place over time intervals typically between 2 and 4 months. The high-frequency variability observed here should be compared to the variability deduced from the lower frequency monitoring observations by Botti Abraham (1993) and Abraham (1996). Although there is, unfortunately, only limited temporal overlap, the pattern is very similar, with significant and sometimes rapid intensity changes. In particular, enhanced radio emission is seen in 1992 in both our sample and in the data by Abraham (1996). The 43 GHz variability has a large amplitude of 8 – 10 Jy (corresponding to factors of two change in brightness) and is about half as much (factor of 1.25) at 22 GHz. We note that those flux densities were determined with relatively large beams of 2.1′ and 4.2′, allowing significant contributions to the emission especially at 22 GHz, not related to the core.
The X-ray variability of the Centaurus A nucleus was monitored over the same period in the 20–200 keV band by the BATSE experiment onboard the Compton Gamma Ray Observatory from 1991 through 2000 and in the 2–10 keV band by the RXTE All Sky Monitor from 1996 onwards. We took the public data from the NASA Goddard SFC and MIT websites and constructed averages over 15-day bins. The results are plotted with the 90 GHz flux densities in Fig. 4. The correspondence between the SEST 90 GHz and the BATSE X-ray flux densities is quite good, suggesting closely related, perhaps even identical, radiative processes . The correlation between the millimeter-wave continuum and the relatively soft X ray emission sampled by the RXTE experiment is much poorer. Minor X-ray excursions (on the order of a factor of two) occurred in 1991/1992, during 1994, in late 1996 and early 1997, during 1999, and 2001. They correlate with radio maxima, although unfortunately we are lacking millimeter continuum coverage for 2001.
Although the behavior is the same at all frequencies observed by us, flux densities vary less at higher frequencies. As a result, the core spectral index changes with the degree of activity. In Table 4 we have calculated spectral index values () for the frequency range of 90 GHz to 230 GHz. To guarantee a reasonable accuracy (on the order of 0.10 or better in the index), we included only epochs at which measurements were available in three different frequency windows. In Fig. 6 we have plotted these spectral indexes as a function of the 90 GHz flux density. It is quite obvious that the mm-wave spectrum of the Centaurus A core becomes steeper (smaller spectral index) when the actual flux increases; i.e. increases are less in both absolute and relative senses at the higher frequencies. The points in Fig. 6, with their uncertainties of , can be fitted with a linear-regression line = -0.087 + 0.311. For the observed lower limit of 7 Jy to the Centaurus A core flux density, this fit implies a fairly flat spectral index = -0.3 (although the two actually measured values imply an even flatter spectrum with = -0.22). Spectral indices = -0.6 are approached at enhanced flux densities of 10 Jy.
Variations in the spectral index between 22 and 43 GHz were likewise deduced by Botti Abraham (1993) and plotted as a function of time in their Figure 2. If we plot their data again, now with the spectral index as a function of the relatively strongly varying 43 GHz flux density, we find a behavior opposite to that deduced by us for the 90 – 230 GHz range. With relatively little scatter, = + 0.11 - 2.2; i.e. the spectrum flattens when increases! We do not have a full explanation for this, but some remarks are in order. First, we note that the 43 GHz flux density appears to vary even more than the 90 GHz flux density. Although there is very little temporal overlap, this is nevertheless consistent with our conclusion that the spectrum steepens when flux densities increase. Second, the 22 GHz emission would be expected to vary even more, but obviously fails to do so. This could be explained by high optical depths of the variable emission component at this frequency.
3.4 Nature of the core emission
In the quiet state, the core of Centaurus A has a high-frequency spectral index = -0.3, but it must become optically thick around 80 GHz to allow flux densities to be a factor of two lower at 43 GHz than at 90 GHz. This implies that the emission at 22 GHz must arise almost entirely from non-core components. In the period covered by our observations, Centaurus A has not shown much activity, in any case less than in earlier decades (cf Abraham Botti 1993). Nevertheless, we did observe a few episodes with slightly enhanced activity. In these mildly ‘active’ states, flux densities increase, the high-frequency spectral index steepens to = -0.6, and the spectral turnover shifts to lower frequencies of about 45-50 GHz. In this state, there is a measurable 2–4 Jy contribution from the core to the total 22 GHz emission from the central 4 arcmin, such as the 4 Jy seen in the VLBI measurements by Tingay et al. during the 1995 episode, but most of the 22 GHz emission still represents non-core components.
Recent (April 2006) observations with the Smithsonian Millimeter Array (SMA) at a resolution of show a point source with a continuum flux density = 6 Jy (Espada et al. 2007). Although we do not have a single-dish measurement at the same epoch, a glance at Table 4 will show that this is, in effect, the total flux to be expected at this frequency.
What does the observed core emission represent, and what is the meaning of the variability? Although our observing beams were much larger, essentially all observed emission arises from a region with a size of a few arcsec at most, as indicated by the SMA observations just mentioned, as well as the measurements described below. VLBI images at frequencies of 5 and 8 GHz (Tingay et al. 1998, 2001; Tingay Murphy 2001; Horiuchi et al. 2006) show very considerable source structure concentrated within about 60 milliarcsec. We note that the submillimeter core itself suffers from both free-free absorption and synchrotron selfabsorption at these frequencies (see e.g. Tingay Murphy 2001). Nevertheless, the images suggest that the emission observed by us arises from a nuclear source, as well as from bright nuclear jets extending over the better part of a parsec. This complicates the interpretation of the observed variability, since we have no means of determining where precisely it originates. The time sequences registered by Tingay et al. (1998, 2001) strongly suggest that nuclear jet evolution is a major source of variability in the emission, as total 8 GHz flux densities vary between 4 and 10 Jy, Their maps also show movement and variability of individual components in the nuclear jets. The 8 GHz ‘core’ component varies much less (between 1.8 and 3.3 Jy with a median of 2.4 Jy over the period 1991-2000) and the 8 GHz and 22 GHz core flux densities are almost identical at the only two epochs (1995.88 and 1997.23) for which a reliable measurement exists (Tingay et al. 1998, 2001). However, in the much higher resolution (1.20.6 mas) maps by Horiuchi et al. (2006) this ‘core’ breaks up into at least four separate components. These extend over 7 milliarcsec (0.13 pc) and should presumably be considered as inner nuclear jet components. It is thus unclear whether the actual nuclear source (if any) itself is variable or not.
Abraham et al. (2007) have interpreted rapid, day-to-day variations with amplitudes of 20 in the 43 GHz emission observed over a three-month period in 2003 as evidence of free-free absorption of the nuclear source by clouds in the center of NGC 5128. It is, however, by no means clear that such an explanation could also apply to longer term variations, or indeed to the pattern of variability at higher frequencies.
Figure 6 shows that the core spectrum steepens when it brightens, implying rapid energy loss of any electrons injected during active periods. We might assume that the emission from the Cen A core consists of a variable component and a component of constant emission. In that case, the spectral index of the variable emission is reasonably well-constrained with = -1.6, especially if the 43 GHz peak excursions of about 9 Jy (Abraham 1996) correspond to the 3 Jy peak excursions at 90 GHz, which we do not know for certain. The relative flux densities of the two components and the spectral index of the constant component need an additional constraining assumption. The lowest flux densities measured at 43 GHz are 3-4 Jy, which puts an upper limit on the constant component. For instance, if we assume a flat spectrum for the latter ( = 0.0), the minimum flux density of the variable component is = 3 Jy. However, there does not seem to be a consistent model for the variation at all three frequencies without additional and ad-hoc assumptions. It appears that millimeter-wave VLBI monitoring is needed to provide the definitive answer to the question of the Centaurus A nuclear source properties. In particular, it would be quite interesting to compare the results of such monitoring with the results for the core of Centaurus A extracted by Meisenheimer et al. (2007) from mid-infrared interferometry at the ESO-VLT. After completion, the maximum resolution of the Atacama Large Millimeter Array (ALMA) will be about 50 mas at 100 GHz. This will close the gap between the centimeter-wavelength synthesis array resolutions and the centimeter-wavelength VLBI fields of view noted by Israel (1998, Sect. 5.4), and thus be invaluable for studies of the evolution of the nuclear and inner jets. The resolution falls far short, however, of those needed to separate processes occurring in the nuclear jets and in the core components. If THz imaging is feasible at the longest baselines, the resulting ALMA resolution of 5 mas is better suited to such studies. ALMA sensitivities will be amply sufficient to show the core, but it remains to be seen how much of the subparsec jet structure will be discernible.
4 Conclusions
We have extended the spatially integrated continuum spectrum of the Centaurus A radio source by using WMAP results between 23 and 93 GHz. The spectrum has now been explored over four frequency decades, from 10 MHz to 93 GHz. Between 10 MHz and 5 GHz, the spectral index , as determined in the literature. Longwards of 5 GHz the spectrum appears to steepen, with . The flux density ratio of the NE lobes (including the core) and the SW lobes increases with frequency from at 0.4–1.4 GHz to in the 23–61 GHz range.
We monitored the emission from the Centaurus A core component at frequencies between 90 and 230 GHz over more than ten years. The core is variable in emission, but over the period 1989–2003, the 90 GHz flux density from the compact core was never below 7 Jy. The spectrum of the quiescent core is relatively flat with = -0.3. Variability was less at higher frequencies, implying steepening of the continuum spectrum simultaneous with core brightening. During active periods, the emitted flux increases, but the spectral turnover frequency decreases. The nuclear component is optically thick below 45–80 GHz.
It appears that most if not all of the variability is associated with the inner nuclear jet components that have been detected in VLBI measurements, but the mechanism of variability is not yet clear.
Acknowledgements.
It is a pleasure to thank C.L. Bennett for communicating Centaurus A WMAP fluxes at an early stage, N. Odegard for insightful advice on the extraction of fluxes from WMAP data products, M.P.H. Israel for valuable assistance in data handling, an anonymous referee for comments leading to improvements in the paper, and H. Steinle’s website (http://www.gamma.mpe-garching.mpg.de/ hcs/Cen-A/) for its very useful information.References
- (1) Abraham Z., 1996 in: Extragalactic Radio Sources, IAU Symposium 175, R. Ekers et als (eds), p. 25
- (2) Abraham Z., Barres de Almeida U., Dominici T.P., Caproni A., 2007 MNRAS 375, 171
- (3) Alvarez H., Aparici J., May J., & Reich P., 2000 A&A 355, 863
- (4) Bennett C. L., Bay M., Halpern M., and 12 coauthors, 2003a, ApJ 583, 1
- (5) Bennett C. L., Halpern M., Hinshaw G., and 18 coauthors, 2003b, ApJS 148, 1
- (6) Bennett C. L., Hill R. S., Hinshaw G., and 13 coauthors, 2003c ApJS 148, 97
- (7) Bolton J.G., Clark B.G., 1960 PASP 72, 29
- (8) Botti L.C.L., Abraham Z., 1993 MNRAS 264, 807
- (9) Burns J.O., Feigelson E.D., Schreier E.J., 1983ApJ 273, 128
- (10) Cooper B.F.C., Price R.M, Cole D.J., 1965 Aust. J. Phys. 18, 589
- (11) Combi J.A., Romero G.E., 1997 A&AS 121, 11
- (12) de Mello D.F., Abraham Z., 1990 Rev. Mex. Astr. Ap. 21, 155
- (13) Fogarty W.G., Schuch N.J., 1975 Nature, 254, 124
- (14) Fujisawa K., Inoue M., Kobayashi H., and 10 coauthors, 2000 PASJ 52, 1021
- (15) Hawarden T.G., Sanell G., Matthews H.E., et al. 1993 MNRAS 260, 844
- (16) Horiuchi S., Meier D.L., Preston R.A., Tingay S.J., 2006, PASJ 58, 211
- (17) Israel F.P., 1998 A&A Rev. 8, 237
- (18) Hinshaw G., Weiland J.L., Hill R.S., and 18 coauthors, 2008, ApJS in press, (arXiv:0803.0732)
- (19) Junkes N, Haynes R.F., Harnett J.I., Jauncey D.L, 1993 A&A 269, 29 (erratum 1993 A&A 274, 1009)
- (20) Junkes N., Haynes R. F., Mack K.-H., 1997 Astron. Ges., Abstr. Ser., No. 13, p. 67
- (21) Kellerman K.I., Zensus J.A., Cohen M.H., 1997, ApJL 475, L93
- (22) Leeuw L.L., Hawarden H.G., Matthews H.E., Robson E.I., Eckart A., 2002 ApJ 565, 131
- (23) Meier D.L., Jauncey D.L., Prestion R.A., and 20 coauthors, 1989 AJ 98, 27
- (24) Meisenheimer K., Tristram K.R.W., Jaffe W., and 11 coauthors, 2007 A&A 471, 453
- (25) Mirabel I.F., Laurent O., Sauvage M., 1999 A&A 341, 667
- (26) Sheridan K.V., 1958 Austral. J. Phys. 11, 400
- (27) Tateyama C.E., Strauss F.M., 1992 MNRAS 256, 8
- (28) Tingay S.J., Jauncey D.L., Reynolds, J.E., and 23 coauthors, 1998 AJ 115, 960
- (29) Tingay S.J., Murphy D.W., 2001 ApJ 546, 210
- (30) Tingay S.J., Preston R.A., Jauncey D.L., 2001 AJ 122, 1697
- (31) Tornikoski M., Valtaoja E., Teräsranta H., et al, 1996 A&AS 116, 157
- (32) Wiklind T., Combes F., 1997 A&A 324, 51
- (33) Wright E.L., Chen X., Odegard N, and 18 coauthors, 2008, ApJS , submitted (arXiv:0803.0577)