Photometric and Spectroscopic study of a highly reddened type Ia supernova SN 2003hx in NGC 2076
Abstract
We present CCD photometry and optical spectra of the type Ia supernova SN 2003hx which appeared in the galaxy NGC 2076, obtained till 146 days after the epoch of band maximum. The supernova reached at maximum brightness in band on JD 245 2893 1.0 with an apparent magnitude of 14.92 0.01 mag which was estimated by making template fits to the light curves. SN 2003hx is an example of a highly reddened supernova with = 0.56 0.23. We estimate = 1.97 0.54 which indicates the small size of dust particles as compared to their galactic counterparts. The luminosity decline rate is = 1.17 0.12 mag and the absolute band magnitude obtained from the luminosity versus decline rate relation (Phillips et al. 1999) is = -19.20 0.18 mag. The peak bolometric luminosity indicates that 0.66 mass of 56 Ni was ejected by the supernova. The spectral evolution indicates the supernova to be a normal type Ia event.
keywords:
supernovae: general - supernovae: individual: SN 2003hx - galaxies: individual: NGC 20761 INTRODUCTION
Type Ia supernovae, being one of the most luminous stellar outburst, form a fairly homogeneous class of objects and are considered as standard candles for determining extragalactic distances and cosmological parameters. Type Ia supernovae are produced by thermonuclear explosions of white dwarfs (Hoyle & Fowler 1960) primarily composed of Carbon and Oxygen nuclei. The probable explosion scenario involves a binary system in which a white dwarf accretes matter from its companion star until it reaches the Chandrasekhar mass limit of 1.4 M⊙. Though type Ia supernovae show homogeneity in both their photometric as well as spectroscopic properties (Höflich et al. 1996) but many SNe show significant deviations. Li et al. (2001) studied a sample of type Ia supernovae and conclude that 64 percent of them belong to the normal group, almost 20 percent belong to the over luminous group of events such as SN 1991T whereas about 16 percent belong to the sub luminous type such as SN 1991bg.
The last few decades have witnessed a large number of diverse data sets for SNe Ia. Nevertheless, type Ia supernovae seem to follow a few common patterns. One of these is the correlation between the peak luminosity and the linear decline rate (Phillips 1993). The color evolution, spectral appearance and the host galaxy morphology are the other correlations. The peak absolute magnitude of type Ia SNe is correlated with the Hubble type of the parent galaxy. SNe Ia hosted by elliptical galaxies are comparatively fainter than SNe Ia in spirals (Della Valle & Panagia 1992, Howell 2001). Even amongst the normal group of type Ia SNe significant photometric and spectroscopic uncertainties exist. Nugent et al. (1995) saw that the spectral variations in type Ia SNe correlate with the expansion velocity, the effective temperature and the peak luminosity. Thus, it is not sufficient to describe SNe Ia by a single parameter such as the early light curve decline rather the diversity noticed is multi-dimensional (Hatano et al. 2000, Benetti et al. 2004). It is therefore, necessary to study the photometric and spectroscopic evolution of individual type Ia SNe.
The integrated flux in optical bands provides a meaningful estimate of the bolometric luminosity which is directly related to the amount of radioactive 56Ni synthesised and ejected in the explosion (Arnett 1982, Höflich et al. 1996, Pinto & Eastman 2000a) which can later be used to test various explosion models of type Ia supernovae.
We present in this paper the optical photometric and spectroscopic observations of highly reddened type Ia supernova SN 2003hx. SN 2003hx was discovered on unfiltered KAIT images on 2003 September 12.5 UT (magnitude 14.3) and 13.5 UT (magnitude 14.4) by Burket, Papenkova & Li (2003). A KAIT image of the same region taken on 2003 March 7.2 UT shows nothing at the location of the supernova to a limiting magnitude of 18.5. SN 2003hx is located at = , = (J2000) which is 5.2 West and 2.6 South of the nucleus of the galaxy NGC 2076. A spectrum of SN 2003hx taken on 2003 September 13.78 UT at the Australian National University (ANU) 2.3-m telescope shows it to be a type Ia supernova around maximum light (Salvo, Norris & Schmidt, 2003). The Si II 635.5 nm line gives an expansion velocity of 12000 km/sec if the NED recession velocity for the host is adopted as 2142 km/sec (Salvo, Norris & Schmidt, 2003). It was confirmed to be a type Ia supernova around 10 days past maximum light with the spectropolarimetric observations using the ESO very large telescope on 2003 September 15.4 UT (Wang & Baade, 2003). The interstellar Na I D line has an equivalent width of 4.86 Åwhich indicates significant dust extinction. The observed degree of polarization is 2 percent (Wang & Baade, 2003). If this polarization is due to the dust in the host galaxy, then it implies that the dust particles are significantly smaller in size than their Galactic counterparts. These observations yield a value of 2.2 for the ratio of total to selective extinction, (Wang & Baade, 2003).
We have carried out the optical photometric and spectroscopic observations of the type Ia supernova SN 2003hx. A brief description of the observations and data analysis is given in section 2, whereas the development of the light curves and color curves are presented in section 3. Section 4 discusses about the reddening estimate. The description about the absolute magnitude, the bolometric luminosity and the estimation of 56Ni ejected are discussed in section 5. Spectral evolution has been studied with a comparison to other type Ia supernovae in section 6. Conclusion forms section 7 of the paper.
2 OBSERVATIONS AND DATA REDUCTION
The observations of SN 2003hx were carried out with the 2-m Himalayan Chandra Telescope (HCT) at Indian Astronomical Observatory (IAO), Hanle during 2003 September 18 to 2004 February 03 which was six days after the discovery on 2003 September 12. The Himalayan Faint Object Spectrograph Camera (HFOSC) equipped with the SITe 2 K 4 K pixel CCD was used. The central 2 K 2 K region was used for imaging covering a field of 10 ′ 10 ′on the sky corresponding to a plate scale 0.296 arcsec pixel -1. The gain and read out noise of the CCD camera are 1.22 e-/ADU and 4.87 e- respectively.
2.1 Photometry
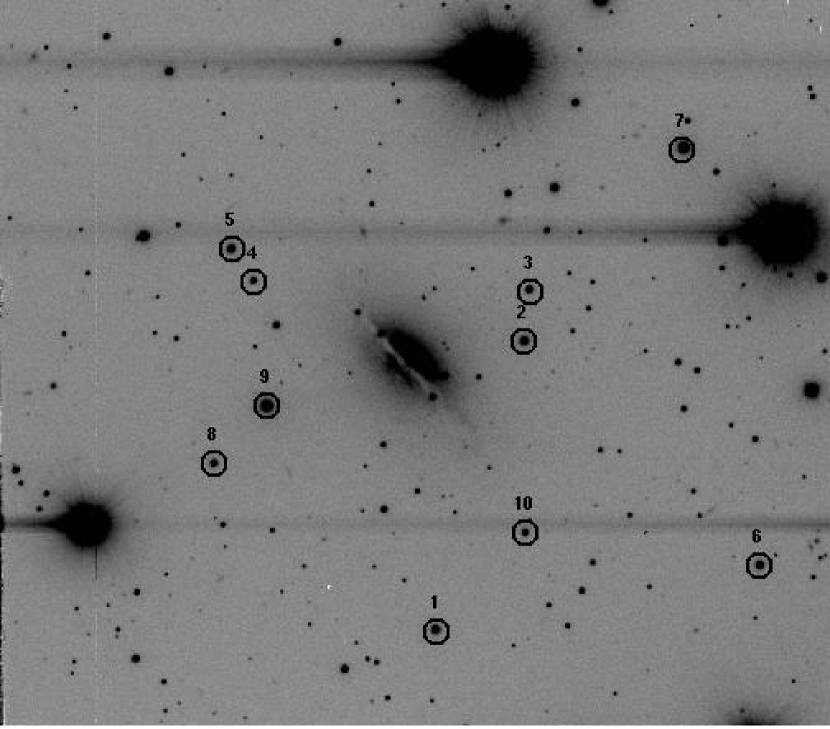
The broad band photometric observations of SN 2003hx were carried out at 16 epochs during 18 September 2003 to 03 February 2003. All the images were bias subtracted, flat fielded and cosmic ray removed in the standard fashion using various tasks in IRAF. Landolt (1992) standard region PG 0231+051 was imaged along with the supernova field in filters on 26 October 2005 under good photometric sky conditions. The values of atmospheric extinction on the night of 26/27 October 2005 determined from the observations of PG 0231+051 bright stars are 0.30 0.01, 0.20 0.009, 0.12 0.007, 0.08 0.004 and 0.04 0.003 in and filters respectively. The observations of PG 0231+051 were used to generate secondary standards in the supernova field. The magnitudes of 10 secondary stars using the transformation equations obtained are listed in Table 1 and are marked in Figure 1. These magnitudes were used to calibrate the data obtained on other nights. The sequence photometry of SN 2003hx field was carried out by the American Association of Variable Star Observers (AAVSO). We compared our field calibration with that of AAVSO and found it to be consistent. Thus, our calibration of SN 2003hx field is secure.
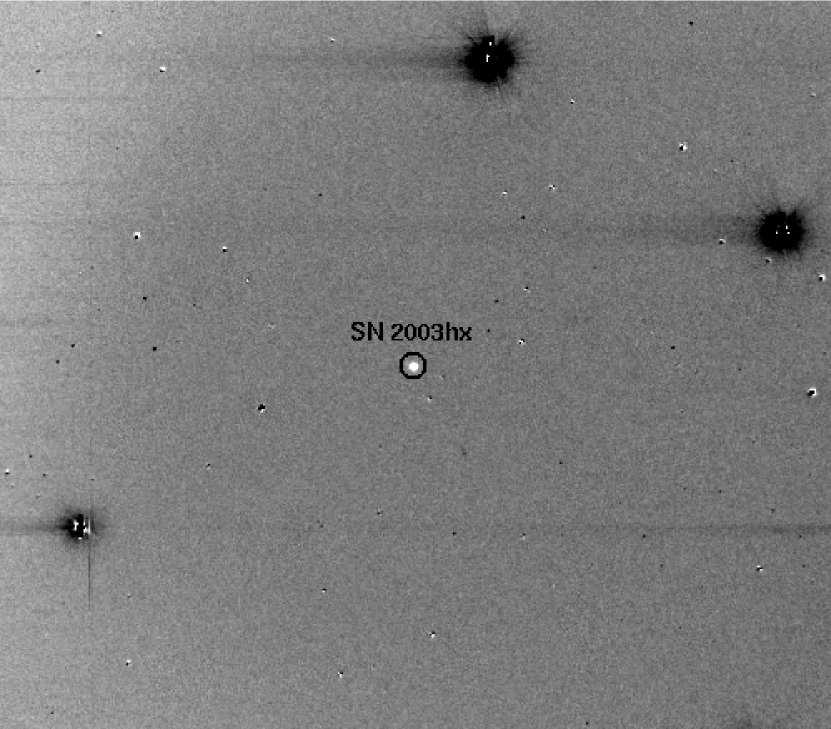
We performed aperture photometry on the local standards using an aperture of 3 - 4 times the of the seeing profile that was determined on the basis of an aperture growth curve. Accurate estimate of sky and its subtraction plays a crucial role in the photometry when the object falls on the varying background. The supernova was just next to the nucleus of the galaxy, we therefore had to perform template subtraction to get a better estimate of the underlying background. The template observations were taken with the same instrumental setup, on 26 October 2005, nearly two years after the supernova discovery, when the supernova had faded. These templates were subtracted from the images of SN obtained during 2003 - 2004. One such subtracted image, showing only the supernova SN 2003hx, is shown in Figure 2. When the seeing was not very good, the template subtraction was not perfect and showed signature of the galaxy. Here, the supernova magnitudes were determined by using the profile-fitting method with a fitting radius equal to that of the of the seeing profile. The difference between the aperture and profile-fitting magnitudes was obtained using standards and was applied to the supernova magnitudes. Thus, the supernova magnitudes were obtained by differentially calibrating with respect to the secondary standards listed in Table 1. The supernova magnitudes derived in this way are given in Table 2.
| ID | |||||
|---|---|---|---|---|---|
| 1 | 17.17 0.07 | 16.22 0.01 | 15.20 0.01 | 14.65 0.02 | 14.12 0.01 |
| 2 | 15.43 0.07 | 15.60 0.01 | 15.09 0.01 | 14.74 0.02 | 14.36 0.01 |
| 3 | 16.58 0.07 | 16.51 0.01 | 15.88 0.01 | 15.48 0.02 | 15.07 0.01 |
| 4 | 16.52 0.07 | 16.74 0.01 | 16.29 0.01 | 15.96 0.02 | 15.63 0.01 |
| 5 | 16.09 0.07 | 15.95 0.01 | 15.32 0.01 | 14.91 0.02 | 14.51 0.01 |
| 6 | 16.29 0.07 | 16.13 0.01 | 15.47 0.01 | 15.08 0.02 | 14.63 0.01 |
| 7 | 14.66 0.07 | 14.65 0.01 | 14.14 0.01 | 13.81 0.02 | 13.48 0.01 |
| 8 | 16.58 0.07 | 16.10 0.01 | 15.81 0.01 | 15.42 0.02 | 15.02 0.01 |
| 9 | 15.10 0.07 | 14.70 0.01 | 13.96 0.01 | 13.52 0.02 | 13.13 0.01 |
| 10 | 17.29 0.07 | 16.92 0.01 | 16.24 0.01 | 15.84 0.02 | 15.42 0.01 |
| Date | JD | Phase∗ | |||||
|---|---|---|---|---|---|---|---|
| 2,400,000+ | (days) | ||||||
| 18/09/03 | 52901.4769 | 8.47 | 16.20 0.03 | 15.07 0.03 | 15.07 0.03 | 14.98 0.03 | 14.89 0.02 |
| 20/09/03 | 52903.4866 | 10.46 | 15.24 0.03 | 15.19 0.05 | 14.93 0.04 | ||
| 21/09/03 | 52904.4847 | 11.48 | 15.34 0.04 | 15.22 0.05 | 14.94 0.05 | 14.73 0.04 | |
| 22/09/03 | 52905.4805 | 12.48 | 15.46 0.03 | 15.12 0.03 | 14.89 0.02 | 14.53 0.02 | |
| 27/09/03 | 52910.4865 | 17.48 | 16.09 0.22 | 15.46 0.05 | 14.87 0.04 | 14.40 0.03 | |
| 28/09/03 | 52911.4870 | 18.48 | 16.23 0.06 | 15.63 0.05 | 14.90 0.04 | 14.30 0.06 | |
| 06/10/03 | 52919.4786 | 26.47 | 17.11 0.21 | 16.17 0.02 | 15.51 0.01 | 15.17 0.03 | |
| 18/10/03 | 52931.4155 | 38.41 | 18.06 0.03 | 16.65 0.03 | 16.34 0.02 | 15.99 0.05 | |
| 27/10/03 | 52940.3899 | 47.38 | 18.23 0.02 | 16.93 0.03 | 16.68 0.03 | 16.44 0.04 | |
| 01/11/03 | 52945.4695 | 52.46 | 18.28 0.01 | 17.09 0.02 | 16.81 0.04 | 16.64 0.05 | |
| 02/11/03 | 52946.4872 | 53.48 | 17.12 0.04 | 16.85 0.03 | 16.71 0.06 | ||
| 07/11/03 | 52951.2987 | 58.29 | 18.07 0.10 | 18.30 0.03 | 17.18 0.02 | 16.73 0.04 | |
| 18/11/03 | 52962.4231 | 69.42 | 17.45 0.02 | 17.27 0.02 | |||
| 04/01/04 | 53009.2533 | 116.25 | 18.56 0.04 | 18.52 0.06 | 18.12 0.11 | ||
| 27/01/04 | 53031.1773 | 138.17 | 19.41 0.05 | 18.85 0.08 | 18.17 0.08 | ||
| 03/02/04 | 53039.1489 | 146.14 | 19.24 0.06 | 19.23 0.10 |
* Relative to the epoch of B maximum (this work) JD = 2452 893.0
2.2 Spectroscopy
Spectroscopic observations of SN 2003hx were carried out on four nights starting 19 September 2003 which was 7 days after the discovery on 12 September 2003. The log of spectroscopic observations is given in Table 3. All the spectra were obtained at a resolution of 7 Å in the wavelength range 3300–6000 Å, 3500–7000 Å, 5200–9200 Åand 5200–10300 Å. Spectroscopic data were reduced using the standard routines within IRAF. The data were bias corrected, flat-fielded and the one dimensional spectra were extracted using the optimal extraction method. FeAr and FeNe sources were used for wavelength calibration. The wavelength calibrated spectra were corrected for instrumental response using spectra of spectrophotometric standards observed on the same night and brought to the same flux scale. The final spectrum on a relative flux scale were obtained by combining the flux calibrated spectra in the two different regions scaled to a weighted mean.
| Date | JD | Phase∗ | Range |
|---|---|---|---|
| 2,400,000+ | (days) | Å | |
| 19/09/03 | 2452902.4769 | 9.47 | 3300-6000; 5200-10300 |
| 22/09/03 | 2452905.4805 | 12.48 | 3500-7000; 5200-9200 |
| 24/09/03 | 2452907.1805 | 14.18 | 3500-7000; 5200-9200 |
| 02/11/03 | 2452946.4872 | 53.48 | 3500-7000; 5200-9200 |
* Relative to the epoch of B maximum JD = 2452 893.0
3 Light Curves and Color Curves
In this section we study the multi band light curve and color curve evolution of SN 2003hx and compare it with other type Ia supernovae.
3.1 light curves
We present the light curves of SN 2003hx in Figure 3. Since our observations started 6 days after the discovery, we do not have observations around the peak brightness. The peak brightness and the JD corresponding to the peak brightness in different bands was estimated by making template fits to the observations. Our observations span a period of 150 days. The frequency distribution of our data is = (3, 11, 16, 14, 13). In order to determine peak brightness in different bands we have adopted the template fitting method. We attempted to fit the different template sets in bands given by Hamuy et al. (1996). We adopted a minimizing technique which solved simultaneously for the peak magnitude and the peak time in different bands. We see that the band fits best with the template of SN 1992al whereas the lowest value of is attained in the case of SN 1992A for and bands. Since Hamuy et al. (1996) does not present the band template, we have taken the band template for type Ia supernova from Schlegel (1995). The band template was similarly fit to the observations to determine the peak magnitude and the peak time in band. Figure 4 shows the light curves in bands including the template fits to the data.


The main parameters of SN 2003hx as estimated from template fits are listed in Table 4. Leibundgut (1988) showed that for a normal type Ia supernova, a 2 day difference is seen between the time of maxima in the and bands. We see from the template fits that SN 2003hx reached maximum brightness in the , and bands earlier than in the band. An excellent match of the SN 1992al template with that of SN 2003hx indicates that the peak in the band occurred at JD 245 2893 1.0. These peak magnitudes obtained using template fitting are further used to calculate the peak luminosity in section 5.
In Figure 4 we see a pronounced secondary maximum for SN 2003hx in the band. This secondary maximum was seen 21 days after the maximum and was 0.32 magnitude fainter than the first maximum. The magnitude of the secondary maxima is listed in Table 4. band also shows a noticeable rise similar to the band at similar epochs. This secondary maxima in the band is a remarkable feature of type Ia SNe and becomes more pronounced in the near-IR band. Such behaviour has been seen for many type Ia SNe. Elias et al. (1981) and Pinto & Eastman (2000b) pointed out that this secondary maxima is due to a temporary increase in absorption, which reduces with the fall in the degree of ionization several weeks after maximum light.
, the number of magnitudes in the band by which the SN declines in the first 15 days after maximum, is a characteristic feature of the type Ia SNe. The fitted template of SN 1992al has a = 1.11. We calculate = 1.17 0.12 by taking the band peak magnitude obtained by the template fit and the observed band magnitude 15 days after the maximum. The average decline rate in different bands is also estimated, and listed in Table 4, from our observations using a time baseline of 20 days.
3.2 Color Curves
Supernovae of type Ia show significant uniformity in their intrinsic colors in late epochs after maximum light. The dereddened , and color curves of SN 2003hx are shown in Figures 5, 6 and 7. The color curves of SN 2003hx are dereddened using the total extinction values listed in Table 4 and discussed in section 4. For a comparison, we show here the color curves of other type Ia supernovae which were reddening corrected using Cardelli extinction law (Cardelli, Clayton & Mathis 1989) and the values of = 0.026 (galactic reddening only using Schlegel, Finkbeiner & Davis 1998) for SN 1990N, = 0.13 for SN 1991T (Phillips et al. 1992), = 0.04 for SN 1994D (Richmond et al. 1995), = 0.32 for SN 1998bu (Hernandez et al. 2000), = 0.032 for SN 1999aw (Strolger et al. 2002), = 0.5 for SN 2000E (Valentini et al. 2003), = 0.044 for SN 2002hu (Sahu et al. 2006), = 0.02 for SN 2003du (Anupama et al. 2005) and = 0.18 for SN 2004S (Misra et al. 2005).
The evolution of color of SN 2003hx is significantly different than other type Ia supernovae, however the overall trend 40 days past maximum is the same as other type Ia supernovae. At the epoch of band maximum, = 0.02 mag which is consistent with the intrinsic colors at maximum observed for other type Ia supernovae usually in the range of -0.1 to +0.1 mag. Type Ia supernovae attain = 1 mag 30 days after maximum. We do not have color estimate at 30 days post band maximum, however = 0.85 at 38 days after maximum. After this epoch the color gets bluer as also seen for other supernovae of type Ia. The overall color evolution of SN 2003hx is not bluer as seen in Figure 5 for other supernovae.
The color curves of SN 2003hx also evolves in a manner similar to other SNe Ia. However, the colors of SN 2003hx are quite similar to SN 1999aw till 20 days after band maximum. The early color is bluest at -0.16 mag 8 days past band maximum although bluer color is observed after 80 days after maximum. reaches 0.48 mag after 18 days after maximum which is quite different as compared to other typical type Ia supernovae (Figure 6).
The color evolution of SN 2003hx follows the similar trend as seen for other type Ia supernovae compared here. The evolution of color of SN 2003hx till 30 days after maximum is similar to other type Ia supernovae, but after 30 days the colors are generally bluer than the other supernovae. The color reaches its bluest value of -0.23 mag around 8 days after maximum and subsequently gets redder after that.
Comparing , and colors of different type Ia supernovae, we see that the and color evolution of SN 2003hx is quite close to the respective colors of SN 1999aw.


We also compare the colors of SN 2003hx with those obtained using the intrinsic color curves of the SNe Ia population given by Nobili et al. (2003). Nobili et al. (2003) present the intrinsic color curves of 48 type Ia SNe till 40 days after band maximum. The total selective extinction was estimated,taking it as a fit parameter,by comparing the observed colors of SN 2003hx with the intrinsic colors given by Nobili et al. (2003). The overall shape of the observed and color curves are similar to the intrinsic color curves (Figure 8), except for systematic shifts in individual colors due to selective extinction. Best fitting value of selective extinction obtained are and . Reddening estimates from other methods are discussed in section 4 and listed in Table 4.

3.3 Comparison of the light curves
In Figures 9, 10, 11 and 12 we compare the light curves respectively of SN 2003hx with other normal type Ia SNe: SN 1990N ( = 1.03, Lira et al. 1998), SN 1991T ( = 0.95, Lira et al. 1998), SN 1994D ( = 1.26, Richmond et al. 1995), SN 1998bu ( = 1.01, Suntzeff et al. 1999), SN 1999aw ( = 0.81, Strolger et al. 2002) SN 2000E ( = 0.94, Valentini et al. 2003), SN 2002hu ( = 1.00, Sahu et al., 2006), SN 2003du ( = 1.04, Anupama et al. 2005) and SN 2004S ( = 1.26, Misra et al. 2005). All the light curves have been plotted by normalizing to the epoch of band maximum for each supernova and the respective peak magnitudes in different bands. Comparison of the light curves of SN 2003hx shows that they are quite similar to other type Ia SNe till 20 days after band maximum whereas at a later epoch they are fainter than other SNe Ia. The band light curve is similar to SN 2004S 20 days after band maximum. Post 20 days after maximum, the light curves of SN 2003hx are very similar to those of SN 1994D which is a normal type Ia SNe with a decline rate of = 1.26 mag. 80 days after maximum SN 2003hx compares well with the light curves of SN 2003du. Both Sn 2003hx and SN 1994D were hosted by lenticular galaxies NGC 2076 and NGC 4256 respectively. The light curve parameter for different type Ia SNe is listed in Table 5.


| Discovery date | 2003 September 12.5 UT |
|---|---|
| Host galaxy | NGC 2076 |
| Galaxy type | Morphological type S0-a |
| RA (2000) | |
| Dec. (2000) | |
| Offset from the nucleus | 5.2 arcsec W and 2.6 arcsec S |
| Spectrum | Type Ia |
| Radial velocity from galaxy redshift (km sec-1) | 2142 5 (NED) |
| 2137 7 (LEDA) | |
| Radial velocity corrected for LG infall on to Virgo (km sec-1) | 1967 (LEDA) |
| Expansion velocity of the SN | 12000 km sec-1 |
| Distance modulus | 32.456 mag |
| (H0 = 65 km sec) | |
| Epoch of maximum (from template fitting) | band 245 2893.0 1.0 |
| band 245 2888.3 0.5 | |
| band 245 2886.7 1.0 | |
| band 245 2889.6 0.6 | |
| Magnitude at maximum | = 14.92 0.01 |
| = 14.34 0.03 | |
| = 14.40 0.06 | |
| = 14.30 0.03 | |
| Colors at maximum | = 0.58 0.03 |
| = -0.06 0.06 | |
| = 0.10 0.06 | |
| Absolute magnitudes at maximum | = -19.20 0.18 |
| = -19.22 0.15 | |
| = -18.91 0.22 | |
| = -18.70 0.17 | |
| Reddening estimate: Using and intrinsic luminosity Phillip’s relation | E(B-V) = 0.56 0.23 |
| Phillip’s relation | E(B-V) = 0.64 0.12 |
| E(V-I) = 0.35 0.12 | |
| Lira’s relation | E(B-V) = 0.43 0.04 |
| Using intrinsic colors of Nobili et al. (2003) at maximum | E(B-V) = 0.69 0.03 |
| E(V-I) = 0.47 0.04 | |
| = 1.97 0.54 | |
| Adopted total extinction (mag) | = 1.664 |
| = 1.104 | |
| = 0.858 | |
| = 0.543 | |
| Magnitude of secondary maximum (from template fitting) | 14.62 |
| in B from template | 1.11 |
| in B from observations | 1.17 0.12 |
| Decline rate per day | band 0.092 0.06 |
| band 0.051 0.05 | |
| band 0.072 0.04 | |
| band 0.059 0.07 |
| SN | Galaxy | log | Reference | |||
|---|---|---|---|---|---|---|
| (mag) | (mag) | (erg s-1) | M⊙ | |||
| 1990N | NGC 4639 | 1.03 | 1 | |||
| 1991T | NGC 4527 | -20.06 | 0.95 0.05 | 43.36 | 1.14 | 2,3 |
| 1994D | NGC 4526 | -18.95 0.18 | 1.31 0.08 | 42.91 | 0.41 | 2,4 |
| 1998bu | NGC 3368 | -19.67 0.20 | 1.01 0.05 | 43.18 | 0.77 | 2,5 |
| 1999aw | Anonymous | -19.48 0.11 | 0.81 0.03 | 43.18 | 0.76 | 6 |
| 2000E | NGC 6951 | -19.45 | 0.94 0.05 | 43.29 | 0.90 0.20 | 7 |
| 2002hu | MCG+6-6-12 | -19.38 0.30 | 1.00 0.05 | 43.25 0.07 | 8 | |
| 2003du | UGC 9391 | -19.34 0.30 | 1.04 0.04 | 43.14 | 0.88 | 9 |
| 2004S | MCG-05-16-021 | -19.05 0.23 | 1.26 0.06 | 42.94 | 0.41 | 10 |
| 2003hx | NGC 2076 | -19.20 0.18 | 1.17 0.12 | 43.01 | 0.66 | 11 |
References: 1-Lira et al. 1998, 2-Contardo, Leibundgut & Vacca 2000, 3-Lira et al. 1998, 4-Richmond et al. 1995, 5-Suntzeff et al. 1999, 6-Strolger et al. 2002, 7-Valentini et al. 2003, 8-Sahu et al. 2006, 9-Anupama et al. 2005, 10-Misra et al. 2006, 11-Present work
4 Reddening estimate
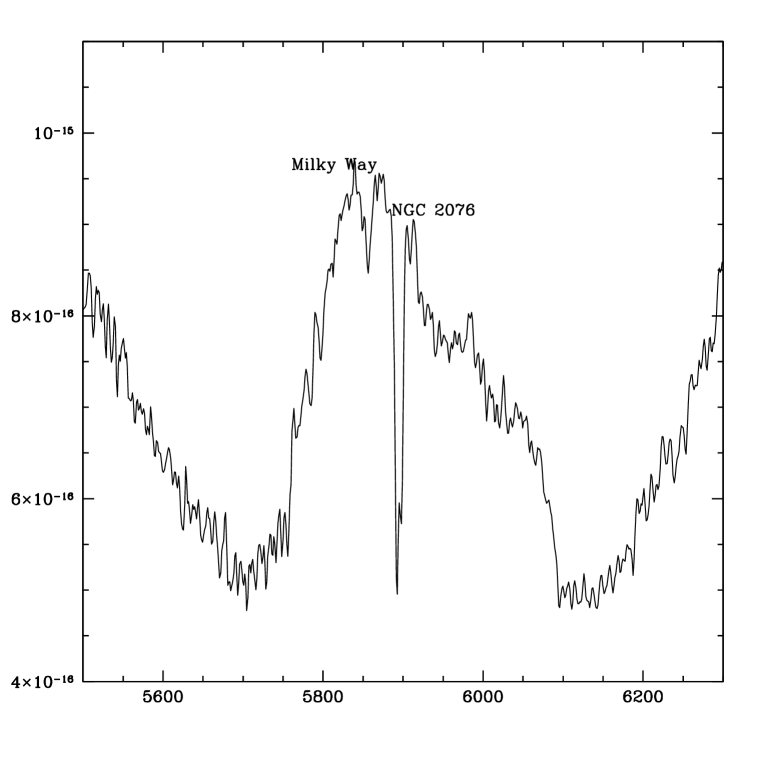
The estimated reddening in the direction of SN 2003hx due to our own galaxy from Schlegel, Finkbeiner & Davis (1998) is E(B-V) = 0.084 mag. The supernova occurred very close to the nucleus of the galaxy NGC 2076, we therefore expect substantial reddening due to the host galaxy. The optical spectra demonstrates that SN 2003hx is a highly reddened supernova (refer Section 6). Figure 13 shows the strong interstellar NaID lines at the rest wavelength of the host galaxy and relatively weak absorption line due to the extinction in the Milky Way. The average equivalent width of the Galactic component of the NaID absorption is 0.540.11 Å, whereas the equivalent width of NaI D absorption due to the host galaxy is 5.020.26 Å. Using the two relations between equivalent width of NaID line and (Turatto, Benetti & Cappellaro 2003) the measured equivalent width implies as 0.09 and 0.28 for the Milky Way, the lower value being close to the estimate of Schlegel, Finkbeiner & Davis (1998). The values due to the host galaxy is estimated as 0.80 and 2.56. The sum of the lower values of for Milky Way and host galaxy gives total reddening as 0.89.
Further, we calculate at the time of maximum using intrinsic color at the epoch of maximum given by Nobili et al. (2003) which is listed in Table 4. We also estimate the total extinction following the photometric methods of Phillips et al. (1999) and the Lira’s method (1995). However, the best estimate of reddening comes from a good measurement of from where we deduce the intrinsic luminosity. This relationship between and intrinsic luminosity is much more exhaustively tested than the extinction law. We obtain, using this method, our independent measure of towards SN 2003hx. The value of is listed is listed in Table 4. The values of total selective extinction obtained from different methods is listed in Table 4. Wang & Baade (2003) based on the spectropolarimetric observations inferred an equivalent width of 4.86 Åfor the interstellar Na I D line, indicating significant dust extinction and a polarization of 2 percent. If this polarization is due to dust in the host galaxy, it implies that the dust particles are smaller in size than their galactic counterparts. A similar conclusion about the dust particle size was arrived at by Sahu et al. (1998), in their study of dust property of the host galaxy NGC 2076. Our independent estimates of also indicates the small size of dust particles as compared to their galactic counterparts. Wand & Baade (2003) based on these observations, found the ratio of total to selective extinction to be 2.2. We adopt = 0.56 0.23 (using the value obtained from the relation between and intrinsic luminosity) and = 1.97 0.54 to estimate the total extinction in different filters, the values of which are listed in Table 4. We see that the reddening due to our own galaxy is very small in comparison to the total reddening. Thus, a large amount of extinction could arise in the host galaxy of SN 2003hx.
5 Absolute luminosity and Bolometric Light Curve
Assuming = 70 km sec-1 Mpc and the radial velocity of NGC 2076 as = 2142 5 km sec-1, we find a distance modulus of 32.456 mag. The total extinction estimated is mentioned in Table 4. From these the absolute magnitudes estimated in different bands are MB = -19.20 0.18, = -19.22 0.15, = -18.91 0.22 and = -18.70 0.17. Altavilla et al. (2004) suggest another method for estimating absolute magnitude using a relation between Mmax and . Adopting the values of linear fit coefficients as given by Altavilla et al. (2004) for = 2.2, we obtain = -19.38 0.10. The values of the absolute magnitude in band obtained by the above two methods are in good agreement with each other.
The bolometric light curve of SN 2003hx is estimated using the optical observations presented here. During the early phase most of the flux emerges in the optical from a type Ia supernova (Suntzeff 1996), thus the integrated flux in bands gives a good estimate of the bolometric luminosity. The peak bolometric luminosity is directly related to the radioactive Nickel ejected in the explosion. The dereddened magnitudes were converted to flux using calibrations by Fukugita, Shimasaku & Ichikawa (1995). Since we have very few band observations, we corrected for the missing passband flux in the optical for a contribution of 10 percent as shown by Contardo et al. (2000). Also, to construct the full bolometric light curve we should combine the ultraviolet and the near-IR data with the optical data. Suntzeff (1996) constructed the full bolometric light curve for SN 1992A by integrating the flux in wavelength range of 2000 to 2.2 m. This shows that both the ultraviolet and the near-IR contribution is 10 percent each of the total luminosity for 80 days since the time of band maximum. Thus, a correction for the missing flux is required and has to be applied to the bolometric luminosity which is estimated using the optical data alone. We correct for a total contribution of 20 percent from both ultraviolet and near-IR regions. In Figure 14 we show the bolometric light curve as dots. The dash line in Figure 14 shows the contribution derived from the bands alone, as obtained from fitted templates from -5 to 80 days with reference to the time of band maximum. The luminosity estimated indicates a peak luminosity of logL = 43.01. The light curves are powered by radioactivity and the amount of 56Ni mass ejected may be estimated using the peak luminosity (Arnett 1982). Assuming a rise-time of 18 days for SN 2003hx and the peak bolometric luminosity determined, the amount of 56Ni is estimated to be = 0.50 . Using the corrected bolometric luminosity, the 56Ni mass estimate is 0.66 .

We see that the peak bolometric luminosity and the ejected 56Ni mass of SN 2003hx is comparable to that of SN 1998bu and SN 1999aw though the amount of 56Ni ejected in the other two cases is slightly higher than SN 2003hx. Table 5 lists the parameters of different type Ia supernovae including SN 2003hx. We present plots of two simple parameters: absolute magnitude versus (Figure 15) and log(Lbol) versus 56Ni (Figure 16). We see that MB and as well as log(Lbol) and 56Ni for type Ia supernovae follow a linear relation and the location of SN 2003hx in both these plots agrees well with the rest of the sample.


6 Spectral Evolution

Optical spectra of SN 2003hx were obtained on four different epochs during +10 days – +53 days past the maximum. Figures 17 and 18 show the spectral evolution of SN 2003hx. All the spectra show a deep absorption around 6100Å due to SiII, indicating the supernova to be a normal type Ia event. The NaI D lines are clearly visible and strong, suggesting a high value of reddening, consistent with the estimates in Section 4.

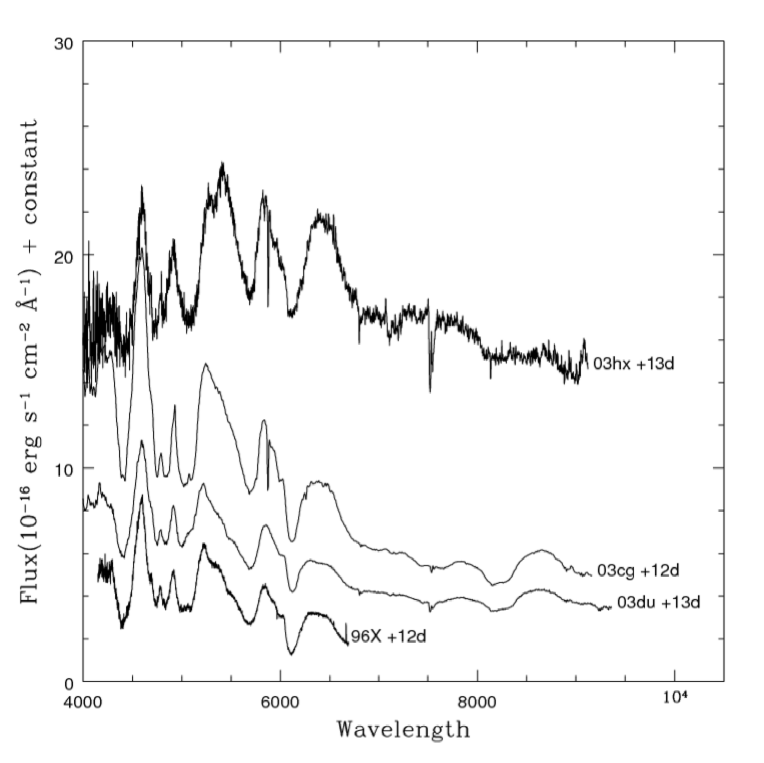
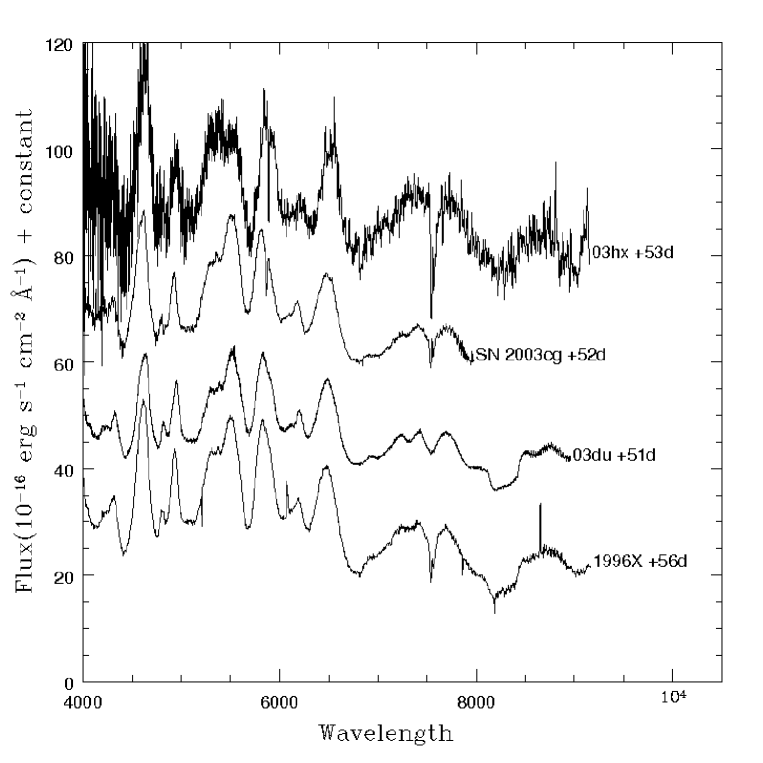
A comparison of the spectra of SN 2003hx with those of other normal type Ia events, namely, SN 2003cg (Elias-Rosa et al. 2006), SN 2003du (Anupama et al. 2005), and SN 1996X (Salvo et al. 2001) indicates an overall similarity in the spectra. However, there are a few discrepancies. The +13d spectrum (Figure 19 indicates very weak or no Ca II IR triplet in SN 2003hx, while it is present, but weak compared to the other SNe at later phases (Figure 20). Further, the S II features at 5300–5600 Å appear to be stronger in SN 2003hx.
The expansion velocity is measured for the first three epochs, based on the absorption minimum of Si II 6355 Å line, and is found to be km sec-1. As our spectroscopic coverage is rather sparse, not much can be inferred about the velocity evolution in SN 2003hx. However, as seen in Figure 21, the velocity estimated for the first three epochs compares well with the estimates for other type Ia events, SN 2003cg (Elias-Rosa et al. 2006), SN 2003du (Anupama et al. 2005), SN 2002er (Kotak et al. 2005), SN 2002bo (Benetti et al. 2004), SN 1996X (Salvo et al. 2001) and SN 1994D (Patat et al. 1996).

7 Conclusions
We present here the photometric observations of SN 2003hx over a period of 146 days after maximum obtained using the 2.01-m Himalayan Chandra Telescope (HCT). We also present the optical spectra of SN 2003hx at four epochs. We study the light curve evolution in bands and estimate the peak magnitudes and the time of maximum in different bands using the template fitting method. The light curve of SN 2003hx in the band is approximated well with the template of SN 1992al whereas the and bands fit best with the template of SN 1992A. The light curve parameter is estimated to be 1.17 0.12 which shows SN 2003hx as a mid-decliner. The colors of SN 2003hx are quite close to the color estimates of SN 1999aw whereas the light curve evolution matches very well with that of SN 1994D. Both SN 2003hx and SN 1994D occurred in lenticular galaxies. We infer from both photometric and spectroscopic studies that SN 2003hx is a highly reddened supernova with = 0.56 0.23. We estimate = 1.97 0.54 which indicates the small size of dust particles as compared to their galactic counterparts. A comparison of the absolute magnitude = -19.20 0.18 with that of other normal type Ia SNe shows that SN 2003hx is comparable in brightness to SN 1999aw. SN 2003hx matches well with the rest of the SNe Ia sample and shows a typical linear behaviour in vs relation. The bolometric light curve indicates the decay of total luminosity of the SNe. The peak bolometric luminosity logL = 43.01 yields a value of 56Ni mass ejected to be 0.66 . Comparing the Nickel masses ejected for different SNe Table 5 we see that the ejected mass of 56Ni for SN 2003hx is slightly the higher side. The spectral evolution indicates SN 2003hx to be a normal type Ia event.
Acknowledgement
We thank the observing staff in HCT for the observations. We are thankful to an anonymous referee for helpful comments and suggestions. This research has made use of data obtained through the High Energy Astrophysics Science Archive Research Center Online Service, provided by the NASA/Goddard Space Flight Center. IRAF is distributed by the National Optical Astronomy Observatories, which are operated by the Association of Universities for Research in Astronomy, Inc., under contract to the National Science Foundation.
References
- (1) Altavilla G. et al., 2004, MNRAS, 349, 1344-1352
- (2) Anupama G. C., Sahu D. K. & Jose J., 2005, A&A, 429, 667
- (3) Arnett W. D., 1982, ApJ, 253, 785
- (4) Benetti S., Meikle P., Stehle M. et al., 2004, MNRAS, 348, 261
- (5) Burket J., Papenkova M. & Li W., 2003, IAUC 8199
- (6) Cardelli J. A., Clayton G. C., Mathis J. S., 1989, ApJ, 345, 245
- (7) Contardo G., Leibundgut B. & Vacca W. D., 2000, A&A, 359, 876
- (8) Della Valle M. & Panagia N., 1992, AJ, 104, 696
- (9) Elias J. H., Frogel J. A., Hackwell J. A. et al., 1981, ApJ, 251, L13
- (10) Elias-Rosa N., Benetti S., Cappellaro E., Turatto M., Mazzali P. A., Patat F., Meikle W. P. S., Stehle, M. et al., 2006, MNRAS, 369, 1880
- (11) Fukugita M., Shimasaku K., Ichikawa T., 1995, PASP, 107, 945
- (12) Hamuy M., Phillips M. M., Suntzeff N. B. et al., 1996, AJ, 112, 2438
- (13) Hatano K., Branch D., Lentz E. J. et al., 2000, ApJ, L49
- (14) Hernandez M., Meikle W. P. S., Aparicio A. et al., 2000, MNRAS, 319, 223
- (15) Höflich P., Khokhlov A., Wheeler J. C. et al., 1996, ApJ, 472, L81-L84
- (16) Howell D. A., 2001, ApJ, 554, L193
- (17) Hoyle F. & Fowler W. A., 1960, ApJ, 132, 565
- (18) Kotak R., Meikle W. P. S., Pignata G., Stehle M., Smartt S. J., Benetti S., Hillebrandt W., Lennon D. J. et al., 2005, A&A, 436, 1021
- (19) Landolt A. U., 1992, AJ, 104, 340
- (20) Leibundgut B., 1988, PhD thesis, Univ. of Basel, Basel
- (21) Li W., Filippenko A., Treffers R. R. et al., 2001, ApJ, 546, 734
- (22) Lira P. et al., 1998, AJ, 115, 234
- (23) Misra K., Kamble A. P., Bhattacharya D. & Sagar R., 2005, MNRAS, 360, 662
- (24) Nobili S., Goobar A., Knop R., Nugent P., 2003, A&A, 404, 901
- (25) Nugent P., Phillips M., Baron E. et al., 1995, ApJ, 455, L147
- (26) Patat F., Benetti S., Cappellaro E., Danziger I. J., della Valle M., Mazzali P. A., Turatto M., 1996, MNRAS, 278, 111
- (27) Pinto P. A. & Eastman R. G., 2000a, ApJ, 530, 744
- (28) Pinto P. A. & Eastman R. G., 2000b, ApJ, 530, 757
- (29) Phillips M. M., Wells L. A., Suntzeff N. B. et al., 1992, AJ, 103, 1632
- (30) Phillips M. M., 1993, ApJ, 413, L105
- (31) Phillips M. M., Lira P., Suntzeff N. B. et al., 1999, AJ, 118, 1766
- (32) Richmond M. W. et al., 1995, AJ, 109, 2121
- (33) Sahu D. K., Anupama G. C. & Prabhu T. P., 2006, MNRAS, 366, 682
- (34) Sahu D. K., Pandey, S.K. & Kembhavi, Ajit, 1998, A&A, 333, 803
- (35) Salvo M. E., Cappellaro E., Mazzali P. A., Benetti S., Danziger I. J., Patat F., Turatto M., 2001, MNRAS, 321, 254
- (36) Salvo M., Norris J. & Schmidt B., 2003, IAUC 8200
- (37) Schlegel E. M., 1995, AJ, 109, 2620
- (38) Schlegel D. J., Finkbeiner D. P., Davis M., 1998, ApJ, 500, 525
- (39) Strolger L. G., Smith R. C., Suntzeff N. B. et al., 2002, AJ, 124, 2905
- (40) Suntzeff L. J., 1996, in Supernova and Supernova Remnants, eds. R. McCray and Z. Wang, Cambridge Universiry Press, Cambridge, 41
- (41) Turatto M., Benetti S. & Cappellaro E., 2003, in From Twilight to Highlight: The Physics of Supernovae, ESO Astrophysics Symposia, Springer, 200-209
- (42) Suntzeff N. B., Phillips M. M., Covarrubias R. et al., 1999, AJ, 117, 1175
- (43) Valentini G. et al., 2003, ApJ, 595, 779
- (44) Wang L. & Baade D., 2003, IAUC 8201