The chemical composition of red giant stars in four intermediate-age clusters of the Large Magellanic Cloud 111Based on observations obtained at Paranal ESO Observatory under proposal 072.D-0337(A), 072.D-0342(A) and 074.D-0369(A).
Abstract
This paper presents the chemical abundance analysis of a sample of 27
red giant stars located in 4 popolous intermediate-age globular
clusters in the Large Magellanic Cloud,
namely NGC 1651, 1783, 1978 and 2173. This analysis is based
on high-resolution (R47000) spectra obtained with the
UVES@VLT spectrograph.
For each cluster we derived up to 20 abundance ratios sampling
the main chemical elemental groups, namely light odd-Z,
, iron-peak and neutron-capture elements.
All the analysed abundance patterns behave similarly in the 4 clusters and
also show negligible star-to-star scatter within each cluster.
We find [Fe/H]=-0.300.03, -0.350.02, -0.380.02 and
-0.510.03 dex for NGC 1651, 1783, 1978 and 2173, respectively.
The measurement of light odd-Z nuclei gives slightly subsolar [Na/Fe] and
a more significant [Al/Fe] depletion (-0.50 dex).
The [/Fe] abundance ratios are nearly solar, while
the iron-peak elements well trace that one of the iron.
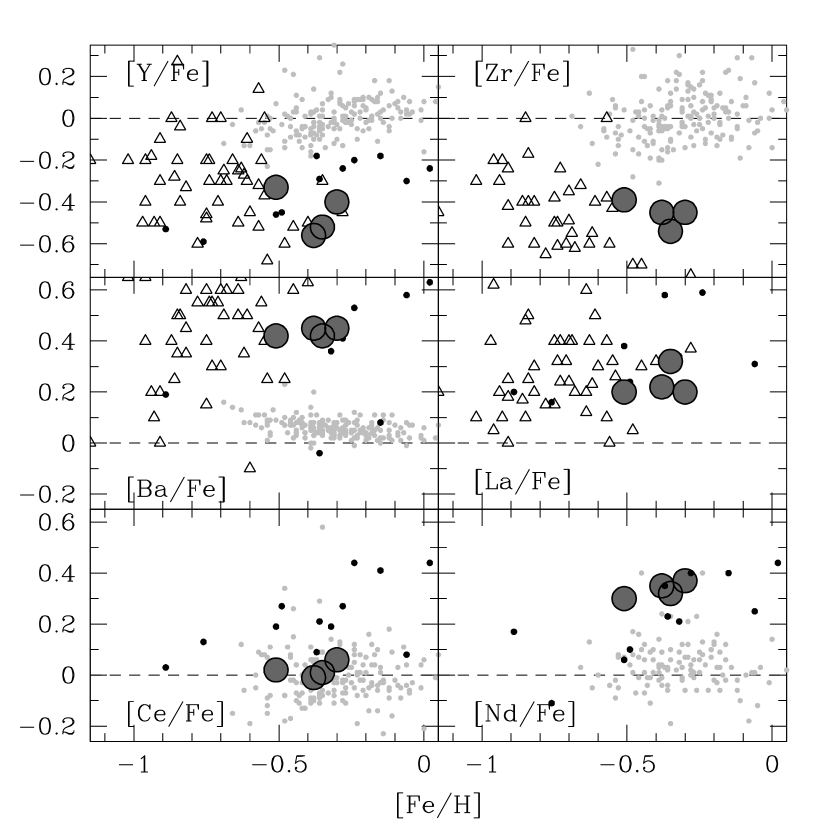
s-process elements behave in a peculiar way:
light s-elements give subsolar [Y/Fe] and [Zr/Fe] abundance ratios,
while heavy s-elements give
enhanced [Ba/Fe], [La/Fe] and [Nd/Fe] with respect to the solar values.
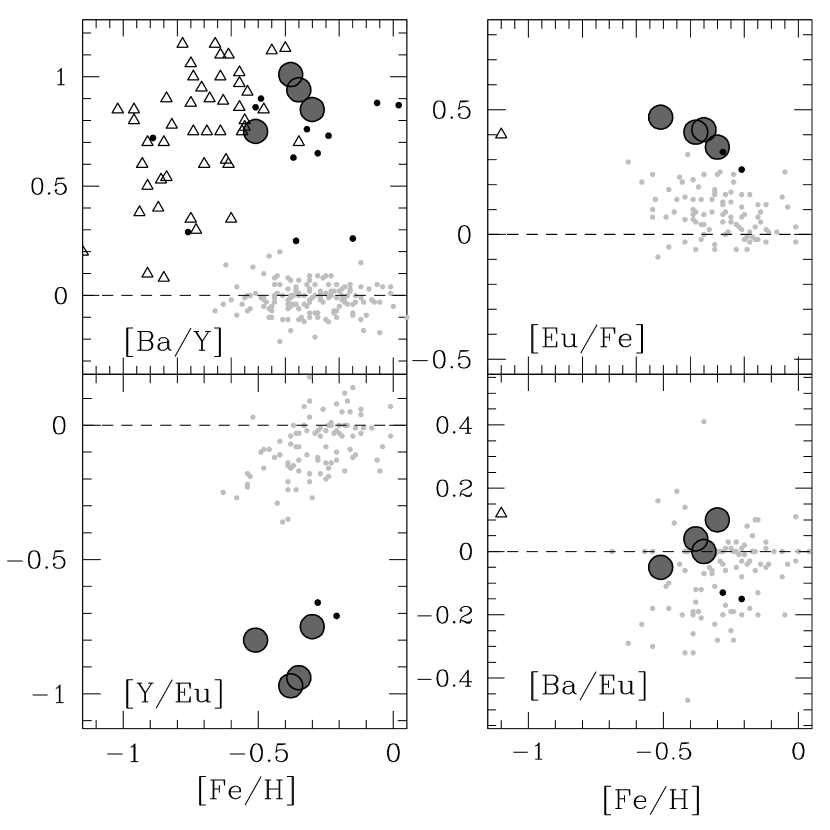
Also, the [Eu/Fe] abundance ratio turns out to be enhanced (0.4 dex).
1 Introduction
The Large Magellanic Cloud (LMC) is the nearest galaxy with a present-day star-formation activity and it represents a formidable laboratory for the study of stellar populations. Its globular cluster (GC) system shows a wide distribution of ages (Searle, Wilkinson, & Bagnuolo, 1980; Elson & Fall, 1988; Geisler et al., 1997), metallicities (Sagar & Pandey, 1989; Olszewski et al., 1991) and integrated colors (van den Bergh, 1981; Persson et al., 1983). In particular, we can distinguish three main stellar populations: an old and metal poor population (13 Gyr, see e.g. Brocato et al., 1996; Olsen et al., 1998), the analogous of the Galactic halo GCs, an intermediate-age population (1-3 Gyr, Gallart et al., 2003; Ferraro et al., 2004; Mucciarelli et al., 2006, 2007a) and a young population, with clusters younger than 1 Gyr (Fischer et al., 1998; Brocato et al., 2003). The lack of objects with ages in the 3-10 Gyr range, the so-called Age Gap (Rich et al., 2001; Bekki et al., 2004; Mackey et al., 2006) represents one of the long-standing problems related to the clusters formation history of the LMC (a similar Age Gap is not seen in the Small Magellanic Cloud (SMC) clusters). Bekki & Chiba (2005) discussed three possible scenarios to solve this problem: (1) after the initial burst of clusters at the epoch of the galaxy formation (13 Gyr ago) the cluster formation has been interrupted until 3 Gyr ago; (2) the cluster formation has been not suspended after the initial burst. The cluster with ages between 13 and 3 Gyr have been tidally stripped, or (3) preferentially destroyed by the LMC tidal field. The most recent theoretical investigations (Bekki et al., 2004; Bekki & Chiba, 2005) have shown that the main episodes of star formation in the LMC can be related to the close encounters with the SMC. These latter events could be also responsible for the formation of the off-center Bar and the age distribution of the LMC GC system. In particular, the first, very close encounter between the LMC and SMC (4 Gyr ago) was able to re-ignite the cluster formation, with a rapid chemical enrichment due to this very efficient star formation activity (see also Pagel & Tautvaisiene, 1998). Moreover, a possible infall of metal-poor material from the SMC could be the origin of some metal-poor, young LMC clusters, observed by Olszewski et al. (1991) and Grocholski et al. (2006).
The LMC GCs are ideal tracers of the chemical evolution of their host galaxy, recording in their abundance patterns the level of enrichment in the galactic environment at the time of their formation. However, our knowledge of the chemical abundances of the LMC GCs is still very sparse and uncertain. Most of the information still rely on photometry (Jasniewicz & Thevenin, 1994; De Freitas Pacheco et al., 1998; Dirsch et al., 2000) or low-resolution spectroscopy (see e.g., Olszewski et al. (1991) and Grocholski et al. (2006)). Recently, Grocholski et al. (2006) derived a new, homogeneous metallicity scale for 23 intermediate-age and 5 old LMC clusters based on the Ca II triplet lines, observed with FORS2@VLT. The derived mean metallicities are [Fe/H]222We adopt the usual spectroscopic notation: [A]=log-log for each element abundance A; log(A) is the abundance by number of the element A in the standard scale where log(H)=12.=-0.48 dex (with rms=0.09) and [Fe/H]=-1.66 dex (with rms=0.27) for the intermediate-age and old clusters, respectively.
Despite the new generation of 8-meter class telescopes,
detailed chemical information
about the LMC clusters from high-resolution spectra are limited to
a few stars in a few clusters and they are insufficient to draw
a global picture of the chemical
properties of these objects and to constrain the timescales of the
chemical enrichment.
Several studies have concerned 3 young, populous clusters, namely NGC 1818
(Richtler et al., 1989; Korn et al., 2000), NGC 2004 (Korn et al., 2000, 2002)
and NGC 2203 (Smith et al., 2002), indicating a high metallicity
([Fe/H]-0.6 dex) and a mild deficiency of -elements.
Hill et al. (2000) presented chemical abundances of Fe, O and Al
from high-resolution spectra of 10 red giant stars in 4
LMC globular clusters, namely NGC 1866, NGC 1978, ESO 121 and NGC 2210,
spanning the entire age range of the LMC clusters system.
They found
[Fe/H]=-0.50, -0.96, -0.91 and -1.75 dex, respectively and
slightly enhanced [O/Fe] and slightly depleted [Al/Fe] with
respect to the solar ratios.
Johnson et al. (2006) presented detailed abundances for 10 giant stars in
4 old globular clusters, namely NGC 1898, NGC 2005, NGC 2019 and Hodge 11,
finding [Fe/H]= -1.23, -1.47, -1.37 and -2.21 dex, respectively.
They generally found abundance ratios comparable to
those of the Galactic GCs. Exceptions are the [Ca/Fe] and
[Ti/Fe] ratios, similar to the solar values, and
[V/Fe] and [Ni/Fe] which are significantly underabundant
(by a factor of 2-3) with respect to the solar ratio.
Finally, Ferraro et al. (2006) reported the iron content of the
intermediate-age cluster NGC 1978 based on the analysis of eleven
giant stars observed with the high resolution
spectrograph FLAMES@VLT. For this cluster a large metallicity
dispersion has been claimed by Hill et al. (2000) based on 2 stars only,
but Ferraro et al. (2006) new analysis shows no significant dispersion
of the iron content.
On the other hand, several works have been addressed to investigate
the metallicity of the LMC field. Abundances from mid-high
resolution spectroscopy are available for few samples of giant
and supergiant stars (Russell & Bessell, 1989; McWilliam & Williams, 1991; Hill et al., 1995; Smith et al., 2002)
and variables (Luck et al., 1998).
Furthermore, Cole et al. (2005) presented a spectroscopical survey
for 373 red giants in the LMC
bar, based on Ca II triplet analysis. The derived metallicity
distribution function is peaked at the median value of
[Fe/H]=-0.37 dex and only a small number of stars shows a
metallicity [Fe/H]-2.10 dex.
Pompeia et al. (2006) reported abundance ratios for 62 giant stars
located in the inner disk of the LMC, finding an average
[Fe/H]=–0.80 dex (rms=0.29 dex),
roughly solar and [iron-peak/Fe] abundance ratios.
They also measured s-process elements, finding a depletion
of [light-s/Fe] and an enhancement of [heavy-s/Fe] with respect to solar.
Very recently, Carrera et al. (2007) analysed 500 giant stars
at different distance from the LMC center; their analysis,
based on Ca II triplet, confirms the previous surveys, with a
mean metallicity constant until to from the
LMC center ([Fe/H]-0.5 dex) and a weak decrease in
the outermost field ([Fe/H]-0.8 dex).
The present study is the second (after Ferraro et al., 2006) of
a long-term project devoted to obtain a complete screening
of the chemical abundances and abundance patterns of a
sample of pillar LMC GCs. In this paper we describe the
chemical abundance analysis of 27 red giant stars members of 4
LMC clusters, belonging to the intermediate-age population.
Future
papers will be devoted to study the chemical properties
of the young and old cluster populations.
The overall goal of this project is twofold:
(1) the definition of
a new and homogeneous
metallicity scale for the LMC GC system based on high
resolution spectra of giant stars, members of a representative
number of pillar clusters, sampling
different ages.
This scale, combined with high-quality optical
photometric datasets, will be crucial to obtain precise ages
for these clusters (see the recent results in Mucciarelli et al., 2007a);
(2) a detailed comparison of the cluster populations and their
chemical abundance patterns with those in the LMC fields and
in other galactic environments. This is crucial to constrain
the age-metallicity relation and the overall star formation
and chemical enrichment of the LMC.
In particular, the chemical signatures of the intermediate-age LMC GCs (a class of objects still poorly studied, especially at high spectral resolution) provide information about the global metallicity of the LMC (these clusters represent the majority of the entire LMC cluster population, as discussed by Olszewski et al. (1991)) and to test the level of chemical enrichment in the last 3 Gyr, after the restart of the cluster formation, according to the scenario drawn by Bekki & Chiba (2005). Moreover, a detailed knowledge of the whole chemistry of the GC system (both young and old clusters) is fundamental to understand the formation of the dwarf irregulars (like LMC and SMC) in the framework of the hierarchical models (see the accurate review by Geisler et al., 2007).
This paper is organized as follows: Sect. 2 describes the observational dataset, Sect. 3 the computation of the atmospheric parameters, the measurements of the line equivalent widths (EW) and the error budget. Sect. 4 presents the results of our abundance analysis for the most important chemical elements. Finally, Sect. 5 and 6 report our discussion and conclusions.
2 Observational data
The observations were performed by using the multi-object spectrograph FLAMES
(Pasquini et al., 2002), mounted at the Kueyen 8 m-telescope (UT2) of the ESO Very
Large Telescope on Cerro Paranal (Chile).
We used FLAMES in the UVES+GIRAFFE/MEDUSA combined mode for a total of
8 UVES and 132 MEDUSA fibres.
Here we present the results of the UVES Red Arm survey which provides
high resolution (R) spectra in the 4800-6800
wavelength range of 6-7 stars in one shot.
The spectra were acquired during 3 nights allocated
to the ESO Program 072.D-0342(A).
Additional observations were performed as back-up programmes
in two Visitors Mode runs (ESO Program 072.D-0337(A) and
ESO Program 074.D-0369(A)).
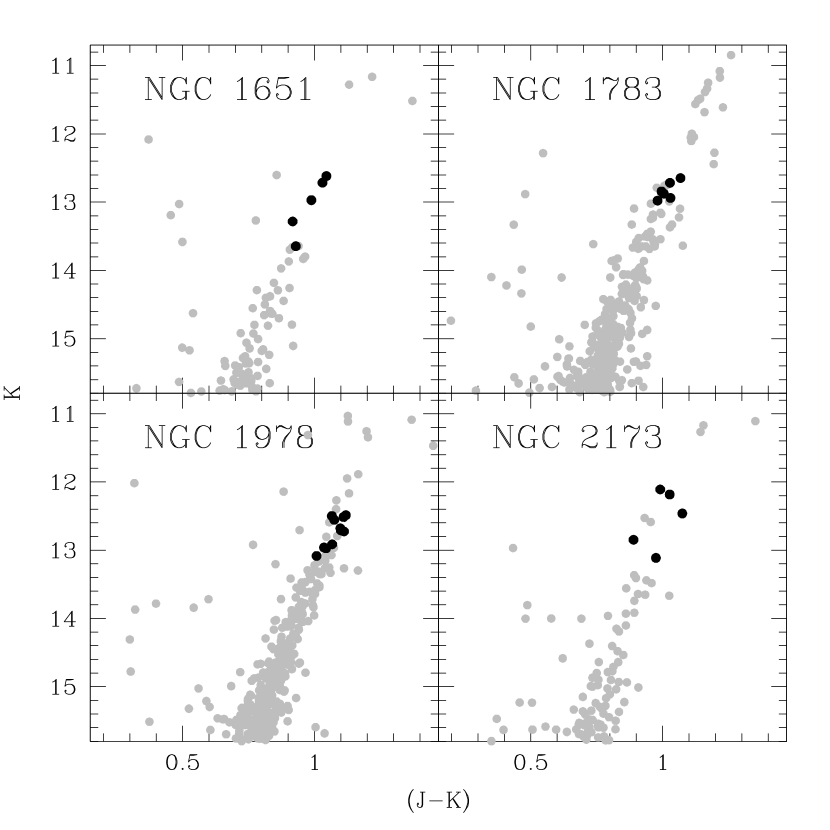
The selection of the target stars is based on our high quality near-infrared
(J, H and K filters) photometric catalogs of a large sample of LMC clusters, as
secured by our group (Ferraro et al., 2004; Mucciarelli et al., 2006).
These catalogs have been astrometrized onto the 2MASS system.
The selected stars for the spectroscopic survey belong
to the brightest portion of the RGB (K14), whose tip is located at
12.1 (Cioni et al., 2000), in order to minimize the
possible contamination by AGB stars.
Fig. 1 shows the (K, J-K) CMDs of the 4 clusters
with marked the spectroscopic targets.
The spectra have been acquired in series of 4-6 exposures of 45min each:
the pre-reduction procedure has been performed by
using the UVES ESO-MIDAS pipeline (Mulas et al., 2002),
which includes bias subtraction, flat-field correction
and wavelength calibration with a reference Th-Ar calibration lamp.
All the exposures relative to a given star have been sky-subtracted, corrected for radial velocity (by using several tens of metallic lines) and average-combined together, providing a final, equivalent spectrum of total exposure time of 3-5 hrs, with a typical S/N30-40 at about 6000 ). The radial velocities included heliocentric corrections, calculated by using the IRAF task RVCORRECT. We find 233.11.8 km/s (rms=3.6 km/s), 277.61.0 km/s (rms=2.3 km/s), 236.80.4 km/s (rms=1.2 km/s), 293.11.5 km/s (rms=3.1 km/s) for NGC 1651, NGC 1783, NGC 1978 and NGC 2173, respectively. These values are in excellent agreement with previous determinations by Olszewski et al. (1991) and Grocholski et al. (2006). Tab. 1 lists the main data for each observed star: S/N, heliocentric radial velocity, near-infrared magnitude and color , right ascension and declination (from the catalog by Mucciarelli et al., 2006).
3 Analysis of the observed spectra
This section describes the analysis of the observed spectra and the computation of the stellar parameters, providing measurements of line EWs, stellar temperatures (Teff), gravities (log g) and microturbulence () and the corresponding error budget.
3.1 Equivalent widths
The analysis of the observed spectra and the computation of the
chemical abundances (for Fe and other elements) was performed by
using the ROSA package (Gratton, 1988).
The line EWs from the observed spectra have been measured by
Gaussian fitting of the line profiles, adopting a relationship
between EW and FWHM
(see e.g. Bragaglia et al., 2001).
The local continuum has been derived by applying an iterative
clipping average over the points with highest counts
around each line.
An empirical estimate of the internal error in the measurement of EWs
can be obtained by comparing a large sample of line EWs in pairs of
stars with similar physical parameters. We derived an average rms of
13.3, 8.5, 10.3 and 10.5 m for NGC 1651, NGC 1783, NGC 1978 and
NGC 2173, respectively.
Such rms estimates should be divided by , since
they are distributed in equal proportion to the two stars
in each pair, thus giving final values of
9.4, 6.0, 7.3 and 7.4 m for the 4 clusters, respectively.
These errors are larger than those obtained
from the Cayrel (1988) formula (which yields a typical uncertainty
of 4.2 m), since the latter neglects
for example the
uncertainty in the continuum location,
which is the dominant source of error in
metal-rich, crowded spectra of rather cool giants.
Table 2 lists some measured EWs, the complete set being
available in electronic form.
3.2 Stellar parameters
Stellar were obtained from the near-infrared color (J-K), corrected for reddening by using the E(B-V) values from Persson et al. (1983), and the extinction law defined by Rieke & Lebofsky (1985). We adopted two different color- transformations, namely by Montegriffo et al. (1998) and Alonso et al. (1999, 2001). Since the derived temperatures are well in agreement within 50 K, we used the average of the two values.
Gravities were estimated by using the relation between , stellar mass and luminosity:
by adopting the solar references log =4.437, =5770 K and =4.75, according to the IAU recommendations (Andersen, 1999). For each target star has been estimated from the K magnitude, and using =18.5 (van den Bergh, 1998; Alves, 2004) and bolometric corrections by Montegriffo et al. (1998). Stellar masses have been estimated by using suitable isochrones (Castellani et al., 2003; Cariulo et al., 2004), adopting ages derived from the s-parameter (Elson & Fall, 1988; Girardi et al., 1995) calibration, and an average metallicity of Z=0.008 (Cole et al., 2005), typical of the LMC. All the program stars have similar (3600-4000 K), and gravities log g (0.5-1.2 dex).
Microturbulent velocities were estimated by eliminating the trend of abundances with the expected line strengths, accordingly to the prescription of Magain (1984) and by using a large number (80-90) of Fe I lines for each star.
The model overall metallicity [A/H] was chosen as that of the model atmosphere extracted from the grid of ATLAS models by Kurucz (1993), with the overshooting option switched on, whose abundance matches the one derived from Fe I lines when adopting the appropriate atmospheric parameters for each star. The atomic parameters, line list and solar reference abundances adopted in this analysis are described in Gratton et al. (2003) and Carretta et al. (2004).
Fig. 2 shows, as an example of consistency check, the iron abundance log n(Fe) from the Fe I lines as a function of the excitation potential , expected line strength and wavelength for one of the star in our sample, together with the linear fit to each distribution (dashed lines). The log n(Fe)- relationship for each target star shows only a marginal slope ( -0.02 dex/eV and reported in Fig. 3 as a function of the ), confirming that the adopted photometric well reproduce the excitation equilibrium. The lack of significant trends in the relationship between iron abundance and the expected line strength (Fig. 2, middle panel) supports the validity of the adopted values. The derived iron abundances show no trend with the wavelength (Fig. 2, lower panel); this represents a good sanity check regarding the continuum placement.
3.3 Error budget
We computed the total uncertainty in the derived abundances, according to the treatment discussed by McWilliam et al. (1995). The variance of a generic abundance ratio [X] is estimated by using the following formula:
where is the abundance uncertainty due to the error in the EW measurement, is the internal error related to the atmospheric parameter i and indicates the differential variation of the derived abundance [X] with respect to the atmospheric parameter i. These latter terms have been computed for all the elements analysed in this work by re-iterating the analysis varying each time only one parameter, by assuming variations of =100K, =0.2 dex, =0.1 dex and =0.2 km/s. Tab. 3 reports the results of such an analysis for the star NGC 1783-29. The terms of covariance that measure the correlation between the atmospheric parameters are not included in the above formula.
The main error sources in the determination of are the photometric error related to (J-K) color and reddening E(B-V). All the program stars are brighter than K14 and the typical photometric error for the (J-K) color is mag; for the reddening we assumed a conservative uncertainty of %. These terms translate into a 60 K temperature uncertainty. In computing the uncertainty due to the stellar gravity, we took into account four main error sources: the error in , in mass (10%), in distance modulus (0.1 mag) and in bolometric correction (0.05 mag). From the quadratic sum of these uncertainties, a total error in of 0.08 dex has been obtained. To estimate the error in the microturbolent velocity we repeated the analysis by changing the value until the 1 value for the slope of the abundance - expected line strength relation has been reached. The internal error associated to is typically 0.10-0.17 km/s.
An estimate of the error in the derived abundances due to the uncertainty in the measurement of EWs has been estimated by weighting the average Fe I line-to-line scatter (0.18 dex) with the square root of the mean number of measured lines for each i element:
Finally, we assumed an additional 0.1 dex uncertainty due to the choice of the best-fit model atmosphere.
4 Chemical abundances
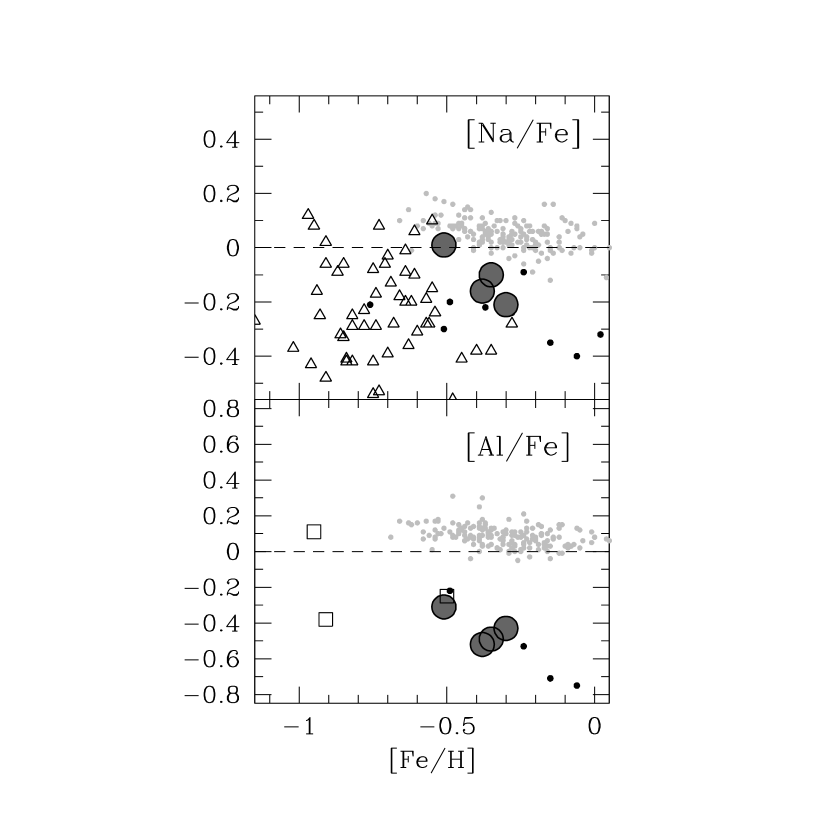
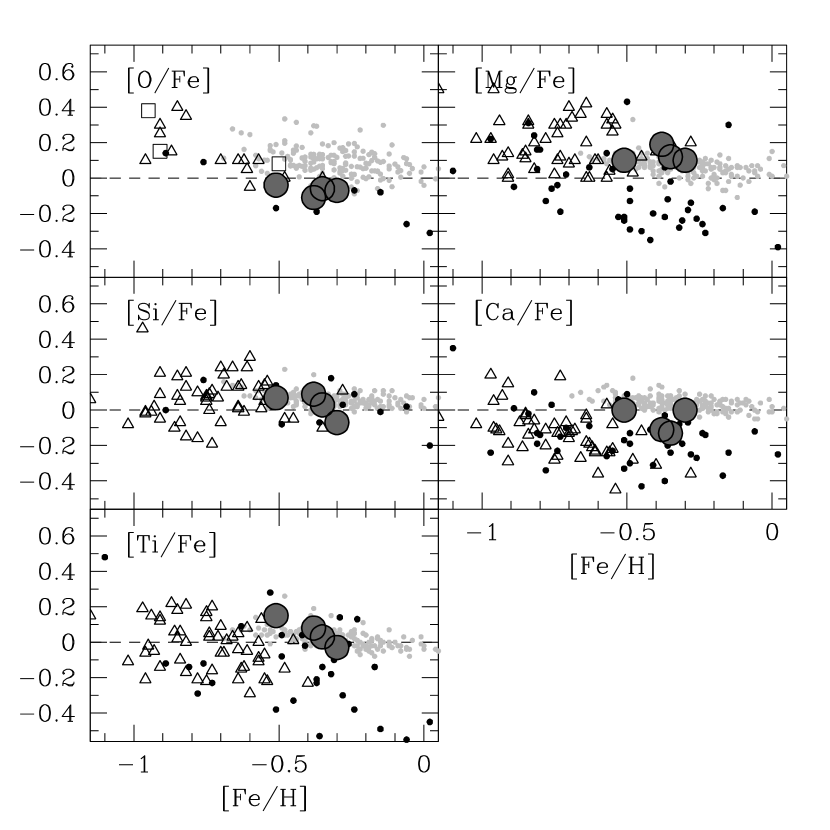
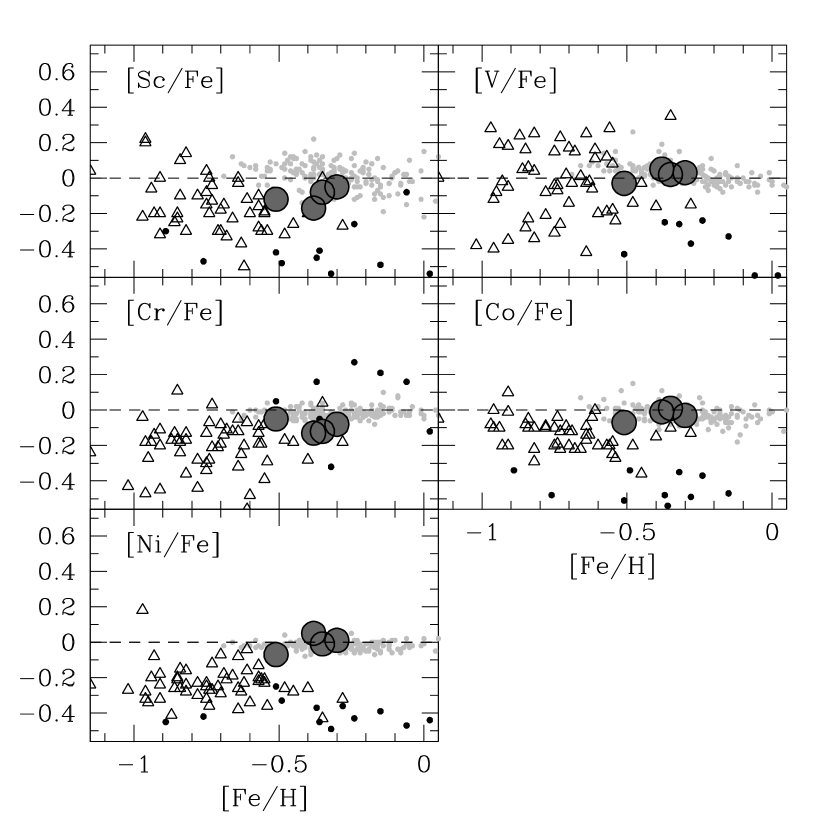
Tab. 4-9 report the abundances of all analysed elements (with the number of measured spectral lines and the corresponding line-to-line scatter) for the target stars and Tab. 10 and 11 summarize the average ratios for the 4 LMC clusters with the number of used stars, the observed star-to-star scatter () and the expected error () computed accordingly to the procedure described in Sec. 3.3. For each cluster, Fig. 4-8 plot the average values of the derived abundance ratios (big grey points). For comparison, the corresponding abundance ratios of other intermediate-age stellar populations are reported, namely LMC disk giant stars by Pompeia et al. (2006) (empty triangles), intermediate-age LMC cluster giants by Hill et al. (2000) (empty squares), Galactic thin disk dwarfs by Reddy et al. (2003) (small grey points) and Sgr giant stars by Bonifacio et al. (2000); Monaco et al. (2005, 2007); Sbordone et al. (2007) (small black points).
4.1 Iron and Iron-peak elements
The mean iron abundance of the cluster NGC 1651 results
[Fe/H]=-0.300.03 dex with rms=0.07 dex, whereas Olszewski et al. (1991)
derived [Fe/H]=-0.370.20 dex.
Photometric determinations have been presented by
Dirsch et al. (2000, from Stromgreen photometry)
and Sarajedini et al. (2002, from isochrones fitting), suggesting
[Fe/H]=-0.65 dex and [Fe/H]=-0.070.10 dex, respectively.
Recently, Grocholski et al. (2006) estimated [Fe/H]=-0.530.03 dex,
by using the Ca II triplet of 9 giant stars.
NGC 1783 shows a mean iron abundance of [Fe/H]=-0.350.02
dex with rms=0.06 dex. For this cluster only photometric
determinations are available :
Sagar & Pandey (1989) found [Fe/H]=-0.45 dex and De Freitas Pacheco et al. (1998)
found [Fe/H]=-0.75 dex.
The results about the iron abundance of NGC 1978
([Fe/H]=-0.380.02 dex with rms=0.07 dex)
have been discussed by Ferraro et al. (2006).
The iron content of NGC 2173 turns out to be
[Fe/H]=-0.510.03 with rms=0.07 dex.
Olszewski et al. (1991) give [Fe/H]=-0.240.20 dex,
De Freitas Pacheco et al. (1998) found [Fe/H]=-0.50 dex
and
Grocholski et al. (2006) found [Fe/H]=-0.420.03 dex,
by using the Lick index
and the Ca II triplet, respectively.
We also measured lines of several elements of the Fe-group, namely Sc, V, Cr, Co and Ni. Corrections for the hyperfine structure (HFS) due to non-zero nuclear magnetic moment, were applied to the ScII, V and Co lines, as in Gratton et al. (2003, and references therein). The abundance ratios between these elements and Fe is roughly solar in all the 4 clusters. In order to cross-check the abundances derived from the EW measurements, we performed a synthetic spectrum fitting for some lines of these elements, finding a negligible difference between these two determinations.
4.2 Light odd-Z elements
Na abundances were derived from the 5682-88
and 6154-60
doublets and they include non-LTE corrections computed accordingly to Gratton et al. (1999).
The differences between LTE and non-LTE derived abundances are generally as
large as 0.2 dex, with a maximum discrepancy of 0.35 dex in the coolest
star of the sample. Three clusters (NGC 1651, NGC 1783 and NGC 1978) exhibit
mild depletion of [Na/Fe]-0.1 dex while this ratio is solar in NGC 2173,
without appreciable intrinsic star-to-star scatter.
Al abundances were derived from the 6696-98 doublet.
These lines do not include non-LTE corrections, following the extensive
discussion by Baumueller & Gehren (1996).
All the target clusters are characterized by a significant depletion of [Al/Fe],
typically -0.3 dex. Also for this ratio,
the intrinsic star-to-star scatter is negligible.
NGC 1978 was previously observed by Hill et al. (2000) who found
[Al/Fe]=0.10 dex from the analysis of 2 giants, only.
This value turns out to be 0.6 dex higher than that found here
([Al/Fe]=-0.52 dex), the discrepancy is likely due to the
strong difference (0.6 dex) in the iron content derived from the two
analysis (see Ferraro et al., 2006). Indeed, their [Al/H] abundance is consistent with our estimate
within the errors.
4.3 -elements
A number of lines for those elements formed through -capture,
namely O, Mg, Si, Ca and Ti, were measured. For all these elements we note
a high level of homogeneity, with the star-to-star scatter consistent
with the measured errors and without significant trends with .
The O analysis is based on the forbidden lines at 6300.31 and
6363.79 .
These lines are not blended with
telluric features, with the only exception of the line at 6300.31
in the NGC 1978 spectra, which is blended with the telluric absorption line.
For these stars this spurious contribution was removed by using the IRAF
task TELLURIC and adopting as template spectrum an early type star.
At the UVES resolution, the 6300.31 feature is well separated
from the ScII line at 6300.69 but contaminated by the very close
Ni transition at 6300.34 . In order to measure the correct
oxygen abundance we used spectrum synthesis convolved with a Gaussian instrumental profile.
To model the Ni line we used the measured abundance (see Sect. 4.1), while to model the various CN lines we needed to assume C and N abundances ([C/Fe]=-0.5 dex and [N/Fe]=+0.5 dex) since not directly measurable. However, it must be noted that the assumed C and N abundances in the typical range shown by RGB stars (e.g. -1[C/Fe]0.0 and 0.0[N/Fe]+1) have only a marginal impact on the derived O abundance. For the other -elements we cross-checked the results derived by the EW measurements, by performing a synthetic spectrum fitting for some test lines. This sanity check confirms the reliability of the derived abundances for these elements. Furthermore, the spectral region between 6155 and 6167 (used to test the Ca abundances) includes the Ca line at 6162.17 with strong damping wings, that are very sensitive to the electronic pressure and to the gravity but not sensitive to , and non-LTE effects (see discussion in Mishenina et al., 2006). We are able to well-reproduce the wings shape of this line, confirming the reliability of the adopted gravities.
All 4 clusters show mildly subsolar [O/Fe] ratios (-0.04 — -0.11 dex),
with star-to-star scatter less than 0.10 dex.
For NGC 1978
Hill et al. (2000) measured
[O/Fe]=0.37 dex with a star-to-star scatter of 0.10 dex,
clearly in disagreement with our determination ([O/Fe]=-0.11 dex),
but this discrepancy can be again manly ascribed to the different
iron content.
For the other elements, the [/Fe] turns out to be roughly solar,
with a mild enhancement of [Mg/Fe] (0.10-0.19 dex) and
[Ti/Fe] in NGC 2173 (0.15 dex).
4.4 s and r-process elements
Several s-process elements, namely the light Y and Zr and the heavy Ba, La, Ce and Nd have been measured, together with Eu, a r-process element.
The Ba abundance was derived by measuring the EWs of three lines. We tested the possible impact of the HFS by performing a spectral synthesis using both the single component line and the separated HFS components taken from the linelist by Prochaska (2000). The inclusion of the HFS has a negligible (0.5%) effect on the derived Ba abundance, due to the strong intensity of these lines, in which all the hyperfine components in the line core are completely saturated, reducing the HFS effects (see the discussion in McWilliam et al., 1995). This finding results in agreement with the analysis of the Ba line at 6496.91 by Norris (1997a). This was also verified by mean of spectrum synthesis simulations of the three lines, using both the single component line and the separated HFS components taken from the linelist by Prochaska (2000). In Tab. 12 we report the comparison between the EWs measured on synthetic spectra of Ba lines computed both with and without HFS, for some target stars with different atmospheric parameters. HFS components are from Prochaska (2000). The very small differences confirm that the effect of inclusion of HFS is negligible for these lines. Ce has an even atomic number Z=58 and all of the isotopes have even neutron number N, hence there is no HFS. However, an isotopic splitting is possible but we did not consider it since the calculations of Aoki et al. (2001) show that it has a negligible impact on the derived abundance. The Nd line HFS can be neglected, because the only isotopes (the odd and ) that show it account for 20% (Den Hartog et al., 2003) of the total abundance, only. The LaII line at 6390.46 exhibits in all the target stars EWs small enough (70 m) to safely ignore the HFS. Finally, Eu abundances have been derived by performing a spectrum synthesis fitting, by using the HFS parameters for the Eu at 6645.11 line by Lawler et al. (2001). We noted as the average values of [Eu/Fe] in each cluster result very similar to the ones obtained by using the EW measurements (and ignoring possible HFS effects) but with a reduced star-to-star scatter, in agreement with the results obtained only from EWs by Gratton et al. (2006) and Carretta et al. (2007) for the Galactic GCs NGC 6441 and NGC 6338, respectively (whose metallicity is very similar to the mean metal abundance of the present sample, although based on higher S/N spectra).
In all the target clusters [Y/Fe] and [Zr/Fe] ratios result significantly depleted (-0.30 dex) with respect to the solar value. Heavy-s elements show enhanced (0.20-0.45 dex) [Ba/Fe], [La/Fe] and [Nd/Fe] ratios but [Ce/Fe] which turns out to be solar. Finally, all the clusters display an enhanced (0.30 dex) [Eu/Fe] abundance ratio.
5 Discussion
All the 4 LMC globulars analysed here, belonging to the same age population but located in different regions of the LMC disk, result to be metal-rich, with a mean metallicity of [Fe/H]=-0.38 dex (rms=0.09 dex). This finding confirms the previous low-resolution analysis based on the Ca II triplet by Olszewski et al. (1991) and Grocholski et al. (2006), that showed as the young and intermediate-age LMC clusters exhibit a very narrow metallicity distribution (Grocholski et al., 2006, estimated a mean metallicity of -0.48 dex with a rms=0.09 dex from 23 intermediate-age clusters). Our metallicities are also consistent with the mean metallicity of the LMC Bar ([Fe/H]=-0.37 dex) by Cole et al. (2005) and of the LMC disk ([Fe/H]-0.5 dex) by Carrera et al. (2007). The theoretical scenario for the formation of the LMC and its GCs drawn by Bekki et al. (2004) indicates as the efficient GC formation does not occur until the LMC and the SMC start to interact violently and closely (3 Gyr ago). Moreover, also the formation of the Bar is predicted to occur in the last 5 Gyr. The similar iron content between the LMC GC system and the LMC Bar seems to confirm this hypothesis.
Our chemical analysis also evidences a high degree of homogeneity for all the elements. Even the abundances of Na and Al show a low dispersion, at variance with Galactic GCs which show strong O-Na and Mg-Al anticorrelations (see e.g. Gratton, Sneden & Carretta, 2004, for an extensive review).
The depletion (by a factor of 2-3) of [Na/Fe] and [Al/Fe] abundance ratios with respect to the solar and Galactic thin disk values, is consistent with the one observed in the LMC and Sgr fields. These two elements are likely connected to the SNII, because their main production sites are C and Ne burning (see Pagel, 1997; Matteucci, 2003), respectively. Another possible channel to produce Na and Al are the p-captures in the intermediate-mass AGB stars (NeNa and MgAl cycles). However, the high degree of homogeneity of their abundance in the LMC clusters and the lack of clear Na-O and Mg-Al anti-correlations seem to favor the SNII channel for their production. Also, since the Na and Al yields depend on the neutron excess and increase with metallicity (Pagel, 1997), under-abundant [Al/Fe] and [Na/Fe] ratios suggest that the gas from which the LMC clusters formed, should have been enriched by relatively low-metallicity SNII.
Also the -elements are produced mainly by high-mass stars which end their short life exploding as SN II, but at variance with Na and Al, their production factors are poorly sensitive to metallicity. The [/Fe] ratio represents a powerful diagnostics to clarify the relative role played by SNII (producers of -elements) and SNIa (main producers of Fe) in the chemical enrichment process. Indeed, there is time delay (Tinsley, 1979) between the explosion of SNII, occurring since the onset of the star formation event, and SNIa, which happen later on (Greggio, 2005a). The roughly solar [/Fe] abundance ratios measured in the LMC GCs well match those found in the LMC field and MW thin disk intermediate-age populations and are consistent with a standard scenario, where SNIa had enough time to significantly enrich the gas with iron. Some depletion of [Mg/Fe], [Ca/Fe] and [Ti/Fe] is observed in the Sgr stars.
The bulk of the iron-peak elements are produced by the SNIa, from stars with intermediate-mass progenitors and located in single-degenerate binary systems (Iwamoto et al., 1999), or from double-degenerate binary systems (Iben & Tutukov, 1984). Our derived abundances for these elements well trace iron, as do the LMC field and MW thin disk stars. We only note a mild discrepancy between our [Ni/Fe] solar ratio and the slightly underabundant ([Ni/Fe]-0.2 dex) values by Pompeia et al. (2006), also observed in the Sgr stars that show a significant depletion (by a factor of 2-3) of iron-peak elements. It is interesting to note that the old LMC clusters analysed by Johnson et al. (2006) show a general depletion of the [iron-peak/Fe] ratios (in particular [V/Fe] and [Ni/Fe]): actually, an explanation for such a depletion for the iron-peak elements is still lacking.
The elements heavier than the iron-peak group are not built up from thermonuclear burning but via a sequences of neutron captures on seed Fe or Ni nuclei. If the time-scale of the neutron capture sequence is longer than the typical time-scale of the -decay, the resulting elements are called slow or s-process elements, while in case of fast neutron capture, the elements are called rapid or r-process elements. The s-process elements are mainly produced by low-mass (1-4 ) AGB stars during the thermal instabilities developing above the quiescent He-burning shell (the so-called main-component), with a minor contribution by the high mass stars (the so-called weak-component) (see Busso, Gallino & Wasserburg, 1999; Travaglio et al., 2004). The bulk of these neutron captures are connected to the and reactions, which are major sources of neutrons.
The behaviour of the s-process elements in the LMC clusters appears to be dichotomic, with a deficiency of light s-elements (Y and Zr) and an enhancement of heavy ones (Ba, La and Nd), with the only exception of Ce, that shows a solar [Ce/Fe] abundance ratio. The [Ba/Y] abundance ratio represents a powerful diagnostic of the relative contribution of the heavy to the light s-process elements (see Venn et al., 2004). In our LMC clusters [Ba/Y] is enhanced by 0.9-1 dex (see Fig. 8): similar values have been observed also in the LMC field (Hill et al., 1995; Pompeia et al., 2006) and in Sgr (Sbordone et al., 2007), but not in the MW, where the [Ba/Y] ratio is solar at most. The interpretation of these abundance patterns is complicated by the complexity (and uncertainty) of the involved nucleosynthesis. Theoretical models (Busso, Gallino & Wasserburg, 1999; Travaglio et al., 2004) indicate that the AGB yields could be metallicity-dependent. In particular, the heavy-s elements have their maximum production factor at lower metallicities than the light-s ones. Hence, a high [Ba/Y] ratio could suggest a major pollution of the gas by low-metallicity AGB stars. Moreover, abundance patterns for [Y/Fe] and [Ba/Fe] consistent with the Galactic values have been observed in the old LMC cluster by Johnson et al. (2006). Being these objects the first ones formed in the LMC, these clusters have been not contaminated by the AGB stars, because the low-mass AGB stars had no time to evolve and incorporate completely their yields in the interstellar medium (differently to the intermediate-age clusters).
The [Eu/Fe] abundance ratio (see Fig. 8) measured in the LMC clusters and Sgr stars is enhanced by a factor of two with respect to the Galactic thin disk value. This is somewhat puzzling and inconsistent with the solar measured in all the three environments. Indeed, Eu is a typical r-process element (Arlandini et al., 1999; Burris et al., 2000), whose most promising site of nucleosynthesis are SNII (SNII with low (M11 , Cowan & Sneden, 2004) mass progenitors are interesting candidates), although other alternative sites are possible (see e.g. Cowan & Sneden, 2004). Such an anomalous high [Eu/Fe] abundance ratio seems to suggest that in the LMC clusters and Sgr the Eu is not or not only synthesized in a similar fashion as the -elements.
Finally, the ratio between the s-process elements (which are predominantly formed through slow neutron captures, with a minor contribution from rapid neutron captures) and Eu (a pure r-process element) represents a powerful diagnostics to estimate the relative contribution of the different neutron-capture processes. The theoretical solar [Ba/Eu] in case of pure rapid neutron captures turns out to be -0.70 dex (Arlandini et al., 1999). The [Ba/Eu]0.0 dex abundance ratios measured in the LMC clusters as well as in the Galactic thin disk and Sgr stars, suggest that s-process elements should be mainly produced by AGB stars through slow neutron captures, with a minor (if any) contribution from massive SNII through rapid neutron captures.
At variance, the strong [Y/Eu] (-0.7 dex) depletion measured in the LMC clusters and Sgr stars is very different from the higher values ([Y/Eu]-0.20 dex at [Fe/H]=-0.40 dex, see Fig. 8) observed in the thin disk stars. This may suggest that rapid neutron captures can also have a different role in the production of light and heavy s-process elements, (as suggested by Venn et al. (2004) in order to explain similar patterns in the dSphs) but this seems to be environment-dependent. Alternatively, galactic winds could have been more effective in removing these elements from the LMC and Sgr (see e.g. Matteucci & Chiosi, 1983).
6 Conclusions
We performed a detailed abundance analysis of the most important chemical elements of 27 giant stars members of 4 LMC intermediate-age clusters. We compared the inferred abundance patterns with those of other intermediate age populations in different galactic environments, namely the LMC field, the Galactic thin disk and the Sgr dwarf spheroidal. Such an analysis allows us to obtain important information about the chemical properties of the intermediate-age population of the LMC:
(1) As unequivocally traced by both field and cluster stars, the intermediate-age population of the LMC is metal-rich, with an average iron content between 1/3 and half solar.
(2) The interstellar medium from which these stars formed had the time to be significantly enriched by SNIa and AGB star ejecta, as traced by the [/Fe] and [s-process/Fe] abundance patterns.
(3) An enhanced pollution of the gas (from which these clusters formed) by SNII and AGB stars with low metallicity could explain either the depletion of [Al/Fe] and [Na/Fe] and the enhancement of the [Ba/Y] abundance ratios with respect to the values measured in the Galactic thin disk stars.
(4) The lack of clear O-Na and Mg-Al anti-correlations seems to indicate that the studied LMC clusters did not undergo appreciable self-enrichment, as likely did the old Galactic GCs, but this has to be proven on a better statistical ground.
(5) The enhanced [Eu/Fe] ratios appear to be in contradiction with the solar [/Fe] ratio, despite the same nucleosinthetic site (massive stars). This decoupling between r- and -elements seems to be a distinctive feature of several extragalactic environments (LMC, SMC, Sgr, dSphs).
The chemical analysis of these clusters provides an overall picture of the metal-rich, intermediate-age component of the LMC cluster system, remarkably different with respect to the Galactic field populations of similar ages and metallicities. We found similar [/Fe] and [iron-peak/Fe] ratios and discrepant light Z-odd and neutron-capture elements. Moreover, the comparison with the Sgr dSph evidences some likeness ([Na/Fe], [Al/Fe] and the neutron capture elements pattern) but also several differences (as the average value of the [/Fe] and [iron-peak/Fe] ratios). Our results point toward a scenario of chemical evolution dominated by previous generations of low-metallicity stars, able to produce the observed depletion of light Z-odd elements as well as the behaviour of the s-process elements. The extension of our study to additional younger and older LMC clusters will provide new insight towards the understanding of the LMC formation and chemical enrichment history.
References
- Alonso et al. (1999) Alonso, A., Arribas, S., & Martinez-Roger, C., 1999, A&AS, 140, 261
- Alonso et al. (2001) Alonso, A., Arribas, S., & Martinez-Roger, C., 2001, A&A, 376, 1039
- Alves (2004) Alves, D. R., 2004, New Astronomy Review, 48, 659
- Andersen (1999) Andersen, J, 1999, Transactions of the IAU, Vol. XXIVA, p.36, 24, A36
- Aoki et al. (2001) Aoki, W., Ryan, S. G., Norris, J. E., Beers, T. C., Ando, H., Iwamoto N., Kajino, T., Mathews, G. J., & Fujimoto, M. Y., 2001, ApJ561, 346
- Arlandini et al. (1999) Arlandini, C., Kappeler, F., Wisshak, K., Gallino, R., Lugaro, M., Busso, M., & Straniero, O., 1999, ApJ, 525, 886
- Baumueller & Gehren (1996) Baumueller, D. & Gehren, T., 1996, A&A, 307, 961
- Bekki et al. (2004) Bekki, K., Couch, W. J., Beasley, M. A., Forbes, D. A., Chiba, M., & Da Costa, G. S., 2004, ApJ, 610, L93
- Bekki & Chiba (2005) Bekki, K., & Chiba, M., 2005, MNRAS, 356, 680
- Bonifacio et al. (2000) Bonifacio, P., Hill, V., Molaro, P., Pasquini, L., Di Marcantonio, P., & Santin, P., 2000, A&A, 359, 663
- Bragaglia et al. (2001) Bragaglia, A., Carretta, E., Gratton, R. G., Tosi, M., Bonanno, G., Bruno, P., Calí, A., Claudi, R., Cosentino, R., Desidera, S., Farisato, G., Rebeschini, M., & Scuderi, S., 2001, AJ, 121, 327
- Brocato et al. (1996) Brocato, E., Castellani, V., Ferraro, F. R., Piersimoni, A. M.,& Testa, V., 1996, MNRAS, 282, 614
- Brocato et al. (2003) Brocato, E., Castellani, V., Di Carlo, E., Raimondo, G., & Walker, A. R., 2003, AJ, 125, 3111
- Burris et al. (2000) Burris, D. L., Pilachowski, C. A., Armandroff, T. E., Sneden, C., Cowan, J. J., & Roe, H., 2000, ApJ, 544, 302
- Busso, Gallino & Wasserburg (1999) Busso, M., Gallino, R., & Wasserburg, G. J., 1999, ARA&A, 37, 239
- Cayrel (1988) Cayrel, R., 1988, in IAU Symp. 132, ”The Impact of Very High S/N Spectroscopy on Stellar Physics”, ed. G. Cayrel de Strobel & M. Spite, Dordrecht, Kluwer, 345
- Cariulo et al. (2004) Cariulo, P., Degl’Innocenti, S., & Castellani, V., 2004, A&A, 421, 1121
- Carrera et al. (2007) Carrera, R., Gallart, C., Hardy, E., Aparicio, A., & Zinn, R., 2007, astro-ph/0710.3076
- Carretta et al. (2004) Carretta, E., Gratton, R. G., Bragaglia, A., Bonifacio, P., & Pasquini, L., 2004. A&A, 416, 925
- Carretta et al. (2007) Carretta, E., Bragaglia, A., Gratton, R. G., Momany, Y., Recio-Blanco, A., Cassisi, S., Francois, P., James, G., Lucatello, S., & Moehler, S., 2007, A&A, 464, 953
- Castellani et al. (2003) Castellani, V., Degl’Innocenti, S., Marconi, M., Prada Moroni, P.G., Sestito, P., 2003, A&A, 404, 645
- Cioni et al. (2000) Cioni, M. R. L., van der Marel, R. P., Loup, C., & Habing, H. J., 2000, A&A, 359, 601
- Cole et al. (2005) Cole, A. A., Tolstoy, E., Gallagher III, J. S., & Smecker-Hane, T. A., 2005, AJ, 129, 1465
- Cowan & Sneden (2004) Cowan, J. J., & Sneden, C., 2004, Carnegie Observatories Astrophysics Series, Vol. 4, ed. A. McWilliam and M. Rauch, Cambridge Univ. Press
- De Freitas Pacheco et al. (1998) De Freitas Pacheco, J. A., Barbuy, B., & Idiart, T., 1998, A&A, 332, 19
- Den Hartog et al. (2003) Den Hartog, E. A., Lawler, J. E., Sneden, C., & Cowan, J. J., 2003, ApJS, 148, 543
- Dirsch et al. (2000) Dirsch, B., Richtler, T., Gieren, W. P., & Hilker, M., 2000, A&A, 360, 133
- Elson & Fall (1988) Elson, R. A., & Fall, S. M. 1988, AJ, 96, 1383
- Ferraro et al. (2004) Ferraro, F. R., Origlia, L., Testa, V. & Maraston, C., 2004, ApJ, 608, 772
- Ferraro et al. (2006) Ferraro, F. R., Mucciarelli, A., Carretta, E., & Origlia, L., 2006, ApJ, 133, L3
- Fischer et al. (1998) Fischer, P., Pryor, C., Murray, S., Mateo, M., & Richtler , T., 1998, AJ, 115, 592
- Gallart et al. (2003) Gallart, C., Zoccali, M., Bertelli, G., Chiosi, C., Demarque, P., Girardi, L., Nasi, E., Woo, J., & Yi, S., 2003, AJ, 125, 742
- Geisler et al. (1997) Geisler, D., Bica, E., Dottori, H., Claria, J. J., Piatti, A. E., & Santos, J. F. C. Jr., 1997, AJ, 114, 1920
- Geisler et al. (2007) Geisler, D., Wallerstein, G., Smith, V. V., & Casetti-Dinescu, D. I., 2007, PASP, 119, 939
- Girardi et al. (1995) Girardi, L., Chiosi, C., Bertelli, G., & Bressan, A., 1995, A&A, 298, 87
- Gratton (1988) Gratton, R. G., 1988, Rome Obs. Preprint, 29
- Gratton et al. (1999) Gratton, R. G., Carretta, E., Eriksson, K., & Gustafsson, B., 1999, A&A, 350, 955
- Gratton et al. (2003) Gratton, R. G., Carretta, E., Claudi, R., Lucatello, S., & Barbieri, M., 2003, A&A, 404, 187
- Gratton, Sneden & Carretta (2004) Gratton, R. G., Sneden, C., & Carretta, E., 2004, ARA&A, 42, 385
- Gratton et al. (2006) Gratton, R. G., Lucatello, S., Bragaglia, A., Carretta, E., Momany, Y., Pancino, E., & Valenti, E., 2006, A&A, 455, 271
- Greggio (2005a) Greggio, L., 2005a, A&A, 441, 1055
- Grocholski et al. (2006) Grocholski, A. J., Cole, A. A., Sarajedini, A., Geisler, D., & Smith, V. V., 2006, AJ, 132, 1630
- Hill et al. (1995) Hill, V., Andrievsky, S., & Spite, M., 1995, A&A, 293, 347
- Hill et al. (2000) Hill, V., Francois, P., Spite, M., Primas, F., & Spite, F., 2000, A&AS, 364, 19
- Iben & Tutukov (1984) Iben, I. Jr, & Tutukov, A. V., 1984, ApJS, 54, 335
- Iwamoto et al. (1999) Iwamoto, K., Brachwitz, F., Nomoto, K., Kishmoto, N., Umeda, H., Hix, W. R., & Thielemann, F.-K., 1999, ApJS, 125, 439
- Jasniewicz & Thevenin (1994) Jasniewicz, G., & Thevenin, F., 1994, A&A, 282, 717
- Johnson et al. (2006) Johnson, J. A., Ivans, I. I.,& Stetson, P. B., 2006,ApJ, 640, 801
- Korn et al. (2000) Korn, A. J., Becker, S. R., Gummersbach, C. A., & Wolf, B., 2000, A&A, 353, 655
- Korn et al. (2002) Korn, A. J., Keller, S. C., Kaufer, A., Langer, N., Przybilla, N., Stahl, O., & Wolf, B., 2002, A&A, 385, 143
- Kurucz (1993) Kurucz, R. L., 1993, CD-ROM 13, Smithsonian Astrophysical Observatory, Cambridge
- Lawler et al. (2001) Lawler, J. E., Wickliffe, M. E., den Hartog, E. A., & Sneden, C., 2001, ApJ, 563, 1075
- Luck et al. (1998) Luck, R. E., Moffett, T. J., Barnes III, T. G., & Gieren, W. P., 1998, AJ, 115, 605
- Mackey et al. (2006) Mackey, A. D., Payne, M. J., & Gilmore, G. F., 2006, MNRAS, 369, 921
- Magain (1984) Magain, P. 1984, A&A, 134, 189
- Matteucci & Chiosi (1983) Matteucci, F.,& Chiosi, C., 1983, A&A, 123, 121
- Matteucci (2003) Matteucci, F., ” The Chemical Evolution of the Galaxy”, 2003, Astrophysic and Space Science Library, VOl. 253, Kluwer Academic Publishers, Dordrecht
- McWilliam & Williams (1991) McWilliam, A., & Williams, R. E., 1991, IAUS, 148, 391
- McWilliam et al. (1995) Mc William, A., Preston, G. W., Sneden, C., & Searle, L., 1995, AJ, 109,2757
- Mishenina et al. (2006) Mishenina, T. V., Bienaymé, O., Gorbaneva, T. I., Charbonnel, C., Soubiran, C., Korotin, S. A., & Kovtyukh, V. V., 2006, A&A, 456, 1109
- Monaco et al. (2005) Monaco, L., Bellazzini, M., Bonifacio, P., Ferraro, F. R., Marconi, G., Pancino, E., Sbordone, L., & Zaggia, S., 2005, A&A, 441, 141
- Monaco et al. (2007) Monaco, L., Bellazzini, M., Bonifacio, Buzzoni, A., Ferraro, F. R., Marconi, G., Sbordone, L., & Zaggia, S., 2007, A&A, 464, 201
- Montegriffo et al. (1998) Montegriffo, P., Ferraro, F. R., Fusi Pecci, F., & Origlia, L., 1998, MNRAS, 297, 872
- Mucciarelli et al. (2006) Mucciarelli, A., Origlia, L., Ferraro, F. R., Testa, V., & Maraston, C., 2006, ApJ, 646, 939
- Mucciarelli et al. (2007a) Mucciarelli, A., Ferraro, F. R., Origlia, L., & Fusi Pecci, F., 2007, AJ, 133, 2053
- Mulas et al. (2002) Mulas, G., Modigliani, A., Porceddu, I., & Damiani, F., 2002, Spie, 4844, 310
- Norris (1997a) Norris, J. E., Ryan, S. G., & Beers, T. C., 1997a, ApJ, 488, 350
- Olsen et al. (1998) Olsen, K. A. G., Hodge, P. W., Mateo, M., Olszewski, E. W., Schommer, R. A., Suntzeff, N. B., & Walker, A. R., MNRAS, 300, 665
- Olszewski et al. (1991) Olszewski, E. W., Schommer, R. A., Suntzeff, N. B. & Harris, H. C., 1991, AJ, 101, 515
- Pagel (1997) Pagel, B., E., J., ”Nucleosynthesis and chemical evolution of galaxies”, 1997, Cambridge University Press
- Pagel & Tautvaisiene (1998) Pagel, B. E. J., & Tautvaisiene, G., 1998, MNRAS, 299, 535
- Pasquini et al. (2002) Pasquini, L. et al., Messenger, 110, 1
- Persson et al. (1983) Persson, S. E., Aaronson, M., Cohen, J. G., Frogel, J. A., & Matthews, K.,1983, ApJ, 266, 105
- Pompeia et al. (2006) Pompeia, L., Hill, V., Spite, M., Cole, A., Primas, F., Romaniello, M., Pasquini, L., Cioni, M-R., & Smecker Hane, T., 2006, arXiv:astro-ph/0604009v2
- Prochaska (2000) Prochaska, J. X., Naumov, S. O., Carney, B. W., McWilliam, A., & Wolfe, A., 2000, AJ, 120, 2513
- Reddy et al. (2003) Reddy, B. E., Tomkin, J., Lambert, D. L., & Allende Prieto, C., 2003, MNRAS, 340, 304
- Rich et al. (2001) Rich, M. R., Shara, M. M., & Zurek, D., 2001, AJ, 122, 842
- Richtler et al. (1989) Richtler, T., Spite, M., & SPite, F., 1989, A&A, 225, 351
- Rieke & Lebofsky (1985) Rieke, G. H., & Lebofsky, M. J. 1985, ApJ, 288, 618
- Russell & Bessell (1989) Russell, S. C., & Bessell, M. S., 1989, ApJS, 70, 865
- Sagar & Pandey (1989) Sagar, R., & Pandey, A. K., 1989, A&AS, 79, 407
- Sarajedini et al. (2002) Sarajedini, A., Grocholski, A. J., Levine, J., & Lada, E., 2002, AJ, 124, 2625
- Sbordone et al. (2007) Sbordone, L., Bonifacio, P., Buonanno, R., Marconi, G., Monaco, L., & Zaggia, S., 2007, A&A, 465, 815
- Searle, Wilkinson, & Bagnuolo (1980) Searle, L., Wilkinson, A., & Bagnuolo, W. G. 1980, ApJ, 239, 803
- Smith et al. (2002) Smith, V. V., et al., 2002, AJ, 124, 3241
- Tinsley (1979) Tinsley, B. M., 1979, ApJ, 229, 1046
- Travaglio et al. (2004) Travaglio, C., Gallino, R., Arnone, E., Cowan, J., Jordan, F., & Sneden, C., 2004, ApJ, 601, 864
- van den Bergh (1981) van den Bergh, S., 1981, A&AS, 46, 79
- van den Bergh (1998) van den Bergh, S., 1998,PASP, 110, 1377
- Venn et al. (2004) Venn, K. A., Irwin, M. Shetrone, M. D., Tout, C. A., Hill, V., & Tolstoy, E., 2004, AJ, 128, 1177


| Star ID | RA(J2000) | Dec(J2000) | ||||
|---|---|---|---|---|---|---|
| (km/s) | ||||||
| 1651-6 | 35 | 234.3 | 13.58 | 0.99 | 69.3880040 | -70.6012635 |
| 1651-8 | 30 | 227.3 | 13.66 | 0.98 | 69.3799588 | -70.5734344 |
| 1651-10 | 30 | 232.1 | 13.87 | 0.94 | 69.3844841 | -70.5838366 |
| 1651-12 | 30 | 235.7 | 14.11 | 0.86 | 69.3573261 | -70.5738910 |
| 1651-16 | 25 | 236.2 | 14.49 | 0.88 | 69.3824681 | -70.5959887 |
| 1783-22 | 35 | 277.4 | 13.63 | 1.02 | 74.7264895 | -65.9723560 |
| 1783-23 | 30 | 275.1 | 13.66 | 0.98 | 74.7793127 | -65.9862323 |
| 1783-29 | 30 | 275.2 | 13.75 | 0.94 | 74.7830715 | -65.9957701 |
| 1783-30 | 30 | 281.2 | 13.79 | 0.95 | 74.8010628 | -65.9629302 |
| 1783-32 | 30 | 277.9 | 13.87 | 0.93 | 74.7707871 | -65.9799639 |
| 1783-33 | 35 | 278.8 | 13.88 | 0.98 | 74.8011665 | -65.9906700 |
| 1978-21 | 35 | 295.5 | 13.52 | 1.07 | 82.1515305 | -66.2322134 |
| 1978-22 | 40 | 290.6 | 13.48 | 1.01 | 82.2014424 | -66.2339097 |
| 1978-23 | 35 | 288.7 | 13.54 | 1.06 | 82.2092677 | -66.2568186 |
| 1978-24 | 30 | 291.5 | 13.54 | 1.02 | 82.1915173 | -66.2387280 |
| 1978-26 | 30 | 296.3 | 13.69 | 1.05 | 82.1751055 | -66.2325960 |
| 1978-28 | 35 | 292.3 | 13.72 | 1.05 | 82.1774043 | -66.2079169 |
| 1978-29 | 35 | 298.4 | 13.75 | 1.06 | 82.1906198 | -66.2420488 |
| 1978-32 | 30 | 290.5 | 13.89 | 1.01 | 82.1764751 | -66.2351731 |
| 1978-34 | 20 | 292.1 | 13.91 | 0.98 | 82.2041703 | -66.2277628 |
| 1978-38 | 30 | 297.1 | 13.93 | 0.99 | 82.2221112 | -66.2352105 |
| 1978-42 | 35 | 291.5 | 14.00 | 0.96 | 82.1706985 | -66.2461504 |
| 2173-4 | 50 | 237.6 | 12.95 | 0.86 | 89.4861621 | -72.9749781 |
| 2173-5 | 50 | 234.8 | 13.15 | 0.99 | 89.4910121 | -72.9652585 |
| 2173-6 | 40 | 237.3 | 13.47 | 1.04 | 89.5475844 | -72.9757905 |
| 2173-8 | 55 | 237.9 | 13.68 | 0.85 | 89.4955156 | -72.9785015 |
| 2173-10 | 40 | 236.3 | 14.03 | 0.94 | 89.4816674 | -72.9815157 |
Note. — The adopted E(B-V) reddening values (Persson et al., 1983) are 0.1 for NGC 1651, NGC 1783 and NGC 1978, and 0.07 for NGC 2173.
| El. | E.P. | log gf | 1651-6 | 1651-8 | 1651-10 | 1651-12 | 1651-16 | 1783-22 | |
|---|---|---|---|---|---|---|---|---|---|
| () | (eV) | (m) | (m) | (m) | (m) | (m) | (m) | ||
| O I | 6300.31 | 0.00 | -9.75 | syn | syn | syn | syn | syn | syn |
| O I | 6363.79 | 0.02 | -10.25 | syn | syn | syn | syn | syn | syn |
| Na I | 5682.65 | 2.10 | -0.67 | 0.0 | 102.7 | 129.9 | 146.0 | 119.7 | 119.1 |
| Na I | 5688.22 | 2.10 | -0.37 | 142.0 | 130.7 | 144.8 | 159.8 | 145.1 | 142.1 |
| Na I | 6154.23 | 2.10 | -1.57 | 74.1 | 41.0 | 69.7 | 74.5 | 45.2 | 80.4 |
| Na I | 6160.75 | 2.10 | -1.26 | 88.0 | 73.5 | 88.7 | 87.7 | 88.6 | 102.1 |
| Mg I | 5528.42 | 4.34 | -0.52 | 257.2 | 247.7 | 252.2 | 270.5 | 254.1 | 227.6 |
| Mg I | 5528.42 | 4.34 | -0.52 | 0.0 | 0.0 | 0.0 | 0.0 | 0.0 | 131.9 |
| Mg I | 6318.71 | 5.11 | -1.94 | 69.1 | 55.9 | 63.5 | 65.3 | 77.3 | 0.0 |
| Mg I | 6319.24 | 5.11 | -2.16 | 44.0 | 0.0 | 0.0 | 46.4 | 43.8 | 43.7 |
| Ratio | logg | [A/H] | ||||
|---|---|---|---|---|---|---|
| (+100 K) | (+0.2 dex) | (+0.1 dex) | (+0.2 km/s) | |||
| 0.028 | 0.042 | 0.040 | -0.016 | 2 | 0.127 | |
| 0.085 | -0.010 | 0.006 | -0.075 | 4 | 0.090 | |
| 0.004 | 0.001 | 0.027 | -0.059 | 4 | 0.090 | |
| 0.069 | 0.003 | 0.005 | -0.047 | 2 | 0.127 | |
| -0.113 | 0.027 | 0.025 | -0.047 | 4 | 0.090 | |
| 0.063 | -0.060 | -0.032 | -0.185 | 13 | 0.050 | |
| II | 0.018 | 0.101 | 0.093 | -0.091 | 5 | 0.080 |
| 0.168 | 0.016 | 0.031 | -0.167 | 13 | 0.050 | |
| 0.156 | 0.004 | 0.024 | -0.195 | 7 | 0.068 | |
| 0.138 | 0.047 | 0.058 | -0.073 | 14 | 0.048 | |
| I | -0.016 | 0.019 | 0.028 | -0.114 | 86 | 0.019 |
| II | -0.210 | 0.068 | 0.043 | -0.063 | 2 | 0.127 |
| -0.033 | 0.024 | 0.026 | -0.117 | 3 | 0.104 | |
| -0.040 | 0.028 | 0.028 | -0.099 | 25 | 0.036 | |
| II | -0.016 | 0.081 | 0.034 | -0.160 | 3 | 0.104 |
| 0.160 | 0.038 | 0.021 | -0.154 | 3 | 0.104 | |
| II | 0.019 | 0.056 | 0.050 | -0.090 | 3 | 0.104 |
| II | 0.018 | 0.087 | 0.037 | -0.113 | 1 | 0.180 |
| II | 0.013 | 0.082 | 0.038 | -0.062 | 1 | 0.180 |
| II | 0.019 | 0.079 | 0.038 | -0.166 | 2 | 0.127 |
| II | -0.014 | 0.083 | 0.036 | -0.053 | 1 | 0.180 |
| Star ID | [A/H] | n | [Fe/H]I | rms | n | [Fe/H]II | rms | |||
|---|---|---|---|---|---|---|---|---|---|---|
| (K) | (dex) | (dex) | (km/s) | (dex) | (dex) | (dex) | (dex) | |||
| 1651-6 | 3780 | 0.76 | -0.25 | 1.48 | 79 | -0.27 | 0.19 | — | — | — |
| 1651-8 | 3810 | 0.81 | -0.40 | 1.52 | 81 | -0.41 | 0.20 | 2 | -0.18 | 0.01 |
| 1651-10 | 3890 | 0.92 | -0.32 | 1.55 | 69 | -0.32 | 0.19 | 2 | -0.22 | 0.16 |
| 1651-12 | 4035 | 1.07 | -0.31 | 1.70 | 89 | -0.31 | 0.19 | 2 | -0.20 | 0.10 |
| 1651-16 | 4010 | 1.20 | -0.20 | 1.49 | 74 | -0.21 | 0.15 | 2 | -0.15 | 0.15 |
| 1783-22 | 3730 | 0.80 | -0.27 | 1.35 | 79 | -0.26 | 0.19 | 3 | -0.35 | 0.05 |
| 1783-23 | 3810 | 0.85 | -0.35 | 1.38 | 86 | -0.34 | 0.17 | — | — | — |
| 1783-29 | 3870 | 0.91 | -0.37 | 1.32 | 101 | -0.38 | 0.20 | 2 | -0.25 | 0.13 |
| 1783-30 | 3850 | 0.92 | -0.36 | 1.37 | 79 | -0.36 | 0.20 | 1 | -0.27 | — |
| 1783-32 | 3800 | 0.92 | -0.30 | 1.22 | 95 | -0.31 | 0.19 | 3 | -0.33 | 0.11 |
| 1783-33 | 3800 | 0.93 | -0.41 | 1.32 | 75 | -0.44 | 0.13 | 1 | -0.40 | — |
| 1978-21 | 3790 | 0.64 | -0.43 | 1.54 | 74 | -0.43 | 0.16 | — | — | — |
| 1978-22 | 3700 | 0.55 | -0.37 | 1.50 | 78 | -0.39 | 0.17 | 7 | -0.27 | 0.19 |
| 1978-23 | 3630 | 0.57 | -0.24 | 1.35 | 70 | -0.25 | 0.21 | — | — | — |
| 1978-24 | 3750 | 0.62 | -0.30 | 1.40 | 59 | -0.30 | 0.17 | 1 | -0.17 | — |
| 1978-26 | 3820 | 0.71 | -0.43 | 1.53 | 83 | -0.42 | 0.17 | 1 | -0.28 | — |
| 1978-28 | 3740 | 0.69 | -0.33 | 1.28 | 85 | -0.33 | 0.18 | 2 | -0.17 | 0.01 |
| 1978-29 | 3750 | 0.71 | -0.44 | 1.58 | 89 | -0.44 | 0.21 | 4 | -0.30 | 0.06 |
| 1978-32 | 3700 | 0.73 | -0.40 | 1.39 | 84 | -0.41 | 0.19 | 2 | -0.30 | 0.18 |
| 1978-34 | 3900 | 0.83 | -0.32 | 1.49 | 84 | -0.32 | 0.20 | — | — | — |
| 1978-38 | 3840 | 0.81 | -0.43 | 1.59 | 72 | -0.44 | 0.14 | 2 | -0.37 | 0.11 |
| 1978-42 | 3880 | 0.86 | -0.43 | 1.55 | 92 | -0.43 | 0.18 | 2 | -0.26 | 0.17 |
| 2173-4 | 3850 | 0.51 | -0.49 | 1.75 | 97 | -0.50 | 0.18 | 9 | -0.49 | 0.11 |
| 2173-5 | 3780 | 0.52 | -0.47 | 1.73 | 101 | -0.47 | 0.22 | 3 | -0.37 | 0.13 |
| 2173-6 | 3680 | 0.62 | -0.57 | 1.65 | 77 | -0.57 | 0.21 | — | — | — |
| 2173-8 | 4060 | 0.83 | -0.57 | 1.72 | 106 | -0.58 | 0.14 | 17 | -0.44 | 0.16 |
| 2173-10 | 3880 | 0.91 | -0.42 | 1.65 | 97 | -0.41 | 0.18 | 2 | -0.35 | 0.12 |
| Star ID | n | [O/Fe] | rms | n | [Na/Fe] | rms | n | [Mg/Fe] | rms | n | [Al/Fe] | rms |
|---|---|---|---|---|---|---|---|---|---|---|---|---|
| (dex) | (dex) | (dex) | (dex) | (dex) | (dex) | (dex) | (dex) | |||||
| 8.79 | 6.21 | 7.43 | 6.23 | |||||||||
| 1651-6 | 2 | -0.12 | 0.05 | 4 | -0.14 | 0.12 | 3 | +0.16 | 0.13 | 2 | -0.42 | 0.08 |
| 1651-8 | 2 | -0.07 | 0.08 | 4 | -0.41 | 0.07 | 2 | +0.18 | 0.11 | 2 | -0.69 | 0.13 |
| 1651-10 | 2 | -0.05 | 0.06 | 4 | -0.16 | 0.05 | 2 | +0.16 | 0.07 | 2 | -0.18 | 0.07 |
| 1651-12 | 2 | -0.05 | 0.06 | 4 | -0.03 | 0.10 | 3 | +0.12 | 0.14 | 2 | -0.28 | 0.06 |
| 1651-16 | 2 | -0.10 | 0.08 | 4 | -0.31 | 0.12 | 3 | +0.10 | 0.16 | 2 | -0.59 | 0.02 |
| 1783-22 | 2 | -0.04 | 0.06 | 4 | -0.13 | 0.13 | 3 | +0.09 | 0.05 | 2 | -0.45 | 0.12 |
| 1783-23 | 2 | -0.12 | 0.11 | 4 | -0.12 | 0.09 | 3 | +0.12 | 0.05 | 2 | -0.43 | 0.07 |
| 1783-29 | 2 | 0.00 | 0.04 | 4 | -0.21 | 0.13 | 4 | +0.09 | 0.09 | 2 | -0.45 | 0.06 |
| 1783-30 | 2 | -0.12 | 0.07 | 4 | -0.20 | 0.13 | 4 | +0.19 | 0.15 | 2 | -0.36 | 0.08 |
| 1783-32 | 2 | -0.04 | 0.10 | 4 | +0.03 | 0.08 | 3 | +0.09 | 0.08 | 2 | -0.73 | 0.07 |
| 1783-33 | 2 | +0.01 | 0.09 | 4 | +0.00 | 0.11 | 4 | +0.17 | 0.14 | 2 | -0.55 | 0.09 |
| 1978-21 | 2 | -0.03 | 0.06 | 4 | -0.35 | 0.07 | 4 | +0.17 | 0.16 | 2 | -0.53 | 0.08 |
| 1978-22 | 2 | -0.20 | 0.08 | 4 | -0.05 | 0.13 | 4 | +0.12 | 0.12 | 2 | -0.50 | 0.01 |
| 1978-23 | 2 | -0.15 | 0.07 | 4 | +0.10 | 0.11 | 4 | +0.21 | 0.09 | 2 | -0.55 | 0.18 |
| 1978-24 | 2 | -0.14 | 0.11 | 4 | -0.24 | 0.14 | 4 | +0.19 | 0.15 | 2 | -0.41 | 0.11 |
| 1978-26 | 2 | +0.02 | 0.08 | 4 | -0.25 | 0.11 | 4 | +0.23 | 0.07 | 2 | -0.61 | 0.02 |
| 1978-28 | 2 | -0.05 | 0.05 | 4 | -0.06 | 0.15 | 4 | +0.22 | 0.12 | 2 | -0.55 | 0.02 |
| 1978-29 | 2 | -0.06 | 0.08 | 4 | -0.09 | 0.09 | 4 | +0.22 | 0.10 | 2 | -0.57 | 0.05 |
| 1978-32 | 2 | -0.08 | 0.07 | 4 | -0.19 | 0.09 | 4 | +0.19 | 0.07 | 2 | -0.39 | 0.08 |
| 1978-34 | 1 | 0.02 | — | 3 | -0.36 | 0.09 | 3 | +0.19 | 0.11 | 2 | -0.56 | 0.05 |
| 1978-38 | 2 | -0.02 | 0.08 | 4 | -0.24 | 0.13 | 4 | +0.20 | 0.10 | 2 | -0.54 | 0.08 |
| 1978-42 | 2 | -0.10 | 0.10 | 4 | -0.21 | 0.11 | 4 | +0.11 | 0.15 | 2 | -0.55 | 0.02 |
| 2173-4 | 2 | -0.04 | 0.12 | 4 | +0.27 | 0.11 | 4 | +0.15 | 0.08 | 2 | -0.32 | 0.03 |
| 2173-5 | 2 | -0.11 | 0.10 | 4 | +0.04 | 0.09 | 4 | +0.07 | 0.13 | 2 | -0.35 | 0.07 |
| 2173-6 | 2 | -0.07 | 0.07 | 4 | -0.29 | 0.09 | 3 | +0.09 | 0.05 | 2 | -0.40 | 0.01 |
| 2173-8 | 2 | -0.08 | 0.07 | 4 | +0.18 | 0.12 | 4 | +0.15 | 0.08 | 2 | -0.14 | 0.09 |
| 2173-10 | 2 | -0.05 | 0.08 | 4 | -0.23 | 0.11 | 4 | +0.04 | 0.16 | 2 | -0.36 | 0.07 |
Note. — Oxygen abundances are derived from spectral synthesis. Sodium abundances are corrected for departures from LTE.
| Star ID | n | [Si/Fe] | rms | n | [Ca/Fe] | rms | n | [Sc/Fe]II | rms | n | [Ti/Fe] | rms |
|---|---|---|---|---|---|---|---|---|---|---|---|---|
| (dex) | (dex) | (dex) | (dex) | (dex) | (dex) | (dex) | (dex) | |||||
| 7.53 | 6.27 | 3.13 | 5.00 | |||||||||
| 1651-6 | 4 | -0.12 | 0.10 | 12 | +0.04 | 0.16 | 5 | -0.06 | 0.12 | 15 | +0.11 | 0.14 |
| 1651-8 | 3 | +0.00 | 0.04 | 12 | +0.00 | 0.17 | 5 | -0.11 | 0.10 | 13 | +0.11 | 0.13 |
| 1651-10 | 3 | -0.01 | 0.10 | 12 | -0.02 | 0.14 | 5 | +0.03 | 0.15 | 11 | +0.09 | 0.13 |
| 1651-12 | 4 | -0.12 | 0.10 | 11 | +0.03 | 0.16 | 4 | -0.09 | 0.09 | 9 | +0.04 | 0.06 |
| 1651-16 | 3 | -0.12 | 0.07 | 11 | -0.07 | 0.13 | 4 | +0.00 | 0.15 | 18 | +0.15 | 0.15 |
| 1783-22 | 2 | +0.04 | 0.04 | 13 | -0.09 | 0.13 | 5 | -0.06 | 0.16 | 14 | +0.06 | 0.16 |
| 1783-23 | 4 | +0.10 | 0.07 | 13 | -0.13 | 0.12 | 5 | -0.16 | 0.14 | 12 | -0.06 | 0.07 |
| 1783-29 | 3 | -0.06 | 0.04 | 12 | -0.07 | 0.13 | 5 | -0.04 | 0.16 | 13 | +0.13 | 0.09 |
| 1783-30 | 3 | -0.04 | 0.06 | 12 | -0.17 | 0.14 | 3 | -0.16 | 0.06 | 13 | +0.03 | 0.15 |
| 1783-32 | 3 | +0.05 | 0.08 | 13 | -0.17 | 0.09 | 5 | -0.01 | 0.10 | 16 | +0.00 | 0.14 |
| 1783-33 | 4 | +0.07 | 0.12 | 12 | -0.15 | 0.09 | 4 | -0.10 | 0.08 | 12 | +0.01 | 0.14 |
| 1978-21 | 3 | +0.06 | 0.11 | 13 | -0.14 | 0.13 | 5 | -0.18 | 0.11 | 15 | +0.18 | 0.13 |
| 1978-22 | 3 | +0.10 | 0.02 | 14 | -0.12 | 0.18 | 4 | -0.15 | 0.06 | 13 | -0.02 | 0.09 |
| 1978-23 | 4 | +0.14 | 0.07 | 14 | -0.10 | 0.15 | 4 | -0.26 | 0.06 | 14 | +0.11 | 0.17 |
| 1978-24 | 4 | +0.10 | 0.02 | 12 | -0.13 | 0.17 | 4 | -0.06 | 0.13 | 12 | +0.08 | 0.15 |
| 1978-26 | 4 | +0.05 | 0.12 | 9 | -0.17 | 0.07 | 5 | -0.18 | 0.15 | 15 | +0.16 | 0.15 |
| 1978-28 | 3 | +0.11 | 0.09 | 12 | -0.11 | 0.15 | 5 | -0.14 | 0.15 | 13 | +0.07 | 0.12 |
| 1978-29 | 4 | +0.14 | 0.08 | 11 | -0.10 | 0.17 | 5 | +0.01 | 0.12 | 15 | +0.04 | 0.17 |
| 1978-32 | 3 | +0.17 | 0.06 | 13 | -0.11 | 0.14 | 3 | -0.23 | 0.08 | 13 | -0.09 | 0.15 |
| 1978-34 | 3 | +0.05 | 0.03 | 12 | -0.08 | 0.17 | 4 | -0.15 | 0.08 | 13 | +0.08 | 0.12 |
| 1978-38 | 3 | +0.08 | 0.09 | 14 | -0.08 | 0.16 | 5 | -0.09 | 0.14 | 16 | +0.00 | 0.19 |
| 1978-42 | 4 | +0.04 | 0.07 | 8 | -0.18 | 0.08 | 5 | -0.31 | 0.11 | 17 | +0.06 | 0.18 |
| 2173-4 | 4 | +0.07 | 0.10 | 11 | +0.00 | 0.16 | 4 | -0.11 | 0.10 | 10 | +0.18 | 0.15 |
| 2173-5 | 4 | +0.04 | 0.04 | 12 | -0.01 | 0.14 | 5 | -0.19 | 0.13 | 14 | +0.19 | 0.16 |
| 2173-6 | 3 | +0.13 | 0.11 | 11 | +0.02 | 0.14 | 4 | -0.14 | 0.09 | 17 | +0.15 | 0.15 |
| 2173-8 | 4 | +0.05 | 0.07 | 13 | +0.00 | 0.16 | 5 | -0.15 | 0.09 | 19 | +0.12 | 0.09 |
| 2173-10 | 4 | +0.07 | 0.10 | 12 | -0.09 | 0.16 | 4 | +0.00 | 0.08 | 13 | +0.09 | 0.06 |
Note. — Scandium abundances include HFS corrections.
| Star ID | n | [V/Fe] | rms | n | [Cr/Fe] | rms | n | [Co/Fe] | rms | n | [Ni/Fe] | rms |
|---|---|---|---|---|---|---|---|---|---|---|---|---|
| (dex) | (dex) | (dex) | (dex) | (dex) | (dex) | (dex) | (dex) | |||||
| 3.97 | 5.67 | 4.92 | 6.28 | |||||||||
| 1651-6 | 8 | +0.09 | 0.08 | 10 | -0.14 | 0.15 | 2 | -0.02 | 0.06 | 23 | +0.00 | 0.16 |
| 1651-8 | 8 | +0.08 | 0.13 | 13 | 0.00 | 0.14 | 2 | -0.02 | 0.05 | 24 | -0.04 | 0.13 |
| 1651-10 | 6 | +0.05 | 0.06 | 12 | -0.16 | 0.10 | 3 | -0.01 | 0.11 | 23 | +0.07 | 0.16 |
| 1651-12 | 8 | -0.05 | 0.08 | 12 | -0.04 | 0.16 | 3 | -0.06 | 0.02 | 27 | -0.02 | 0.16 |
| 1651-16 | 9 | -0.03 | 0.12 | 15 | -0.08 | 0.15 | 2 | -0.03 | 0.14 | 30 | +0.06 | 0.13 |
| 1783-22 | 7 | +0.14 | 0.11 | 13 | -0.16 | 0.15 | 2 | +0.07 | 0.04 | 24 | +0.00 | 0.15 |
| 1783-23 | 7 | -0.13 | 0.15 | 14 | -0.21 | 0.15 | 3 | -0.05 | 0.05 | 26 | -0.01 | 0.16 |
| 1783-29 | 7 | +0.13 | 0.14 | 13 | -0.05 | 0.16 | 3 | +0.05 | 0.09 | 25 | +0.00 | 0.12 |
| 1783-30 | 5 | -0.04 | 0.12 | 16 | -0.19 | 0.15 | 3 | +0.00 | 0.06 | 25 | -0.05 | 0.16 |
| 1783-32 | 7 | +0.05 | 0.15 | 14 | -0.07 | 0.15 | 3 | -0.09 | 0.08 | 25 | -0.01 | 0.15 |
| 1783-33 | 7 | -0.01 | 0.15 | 14 | -0.05 | 0.16 | 3 | +0.05 | 0.10 | 28 | +0.02 | 0.16 |
| 1978-21 | 9 | +0.03 | 0.16 | 15 | -0.12 | 0.16 | 3 | -0.12 | 0.15 | 23 | +0.02 | 0.14 |
| 1978-22 | 6 | -0.09 | 0.13 | 14 | -0.17 | 0.15 | 3 | -0.10 | 0.15 | 26 | +0.08 | 0.15 |
| 1978-23 | 5 | +0.16 | 0.07 | 13 | -0.03 | 0.17 | 3 | -0.13 | 0.12 | 26 | +0.11 | 0.15 |
| 1978-24 | 6 | +0.18 | 0.13 | 14 | -0.13 | 0.16 | 2 | +0.09 | 0.05 | 25 | +0.13 | 0.15 |
| 1978-26 | 6 | +0.22 | 0.16 | 14 | -0.12 | 0.16 | 3 | -0.11 | 0.11 | 25 | +0.10 | 0.16 |
| 1978-28 | 5 | +0.15 | 0.08 | 9 | -0.01 | 0.15 | 3 | +0.04 | 0.13 | 27 | +0.01 | 0.16 |
| 1978-29 | 6 | +0.05 | 0.10 | 14 | -0.10 | 0.15 | 3 | +0.00 | 0.06 | 23 | +0.04 | 0.10 |
| 1978-32 | 5 | +0.13 | 0.12 | 13 | -0.14 | 0.16 | 3 | +0.09 | 0.13 | 24 | +0.02 | 0.14 |
| 1978-34 | 6 | +0.00 | 0.17 | 12 | -0.20 | 0.15 | 2 | +0.00 | 0.05 | 20 | +0.11 | 0.16 |
| 1978-38 | 7 | -0.14 | 0.05 | 13 | -0.16 | 0.12 | 3 | +0.11 | 0.15 | 31 | -0.05 | 0.15 |
| 1978-42 | 7 | -0.02 | 0.17 | 11 | -0.17 | 0.16 | 3 | +0.03 | 0.15 | 31 | -0.02 | 0.12 |
| 2173-4 | 7 | +0.04 | 0.09 | 18 | -0.08 | 0.16 | 3 | -0.11 | 0.13 | 30 | -0.15 | 0.16 |
| 2173-5 | 7 | +0.09 | 0.10 | 12 | +0.03 | 0.12 | 3 | +0.03 | 0.10 | 27 | -0.05 | 0.1 |
| 2173-6 | 8 | -0.03 | 0.13 | 11 | -0.05 | 0.17 | 3 | +0.01 | 0.13 | 16 | -0.07 | 0.13 |
| 2173-8 | 11 | -0.11 | 0.16 | 17 | -0.11 | 0.14 | 3 | -0.10 | 0.14 | 35 | -0.04 | 0.13 |
| 2173-10 | 8 | -0.13 | 0.07 | 12 | -0.06 | 0.14 | 4 | -0.20 | 0.15 | 32 | -0.05 | 0.15 |
Note. — Vanadium and Cobalt abundances include HFS corrections.
| Star ID | n | [Y/Fe]II | rms | n | [Zr/Fe] | rms | n | [Ba/Fe]II | rms | n | [La/Fe]II | rms |
|---|---|---|---|---|---|---|---|---|---|---|---|---|
| (dex) | (dex) | (dex) | (dex) | (dex) | (dex) | (dex) | (dex) | |||||
| 2.22 | 2.60 | 2.22 | 1.22 | |||||||||
| 1651-6 | 3 | -0.39 | 0.02 | 3 | -0.53 | 0.08 | 3 | +0.44 | 0.11 | 1 | +0.19 | — |
| 1651-8 | 2 | -0.27 | 0.16 | 3 | -0.41 | 0.13 | 3 | +0.49 | 0.08 | 1 | +0.34 | — |
| 1651-10 | 3 | -0.51 | 0.11 | 2 | -0.49 | 0.01 | 3 | +0.49 | 0.09 | 1 | +0.26 | — |
| 1651-12 | 2 | -0.32 | 0.08 | 2 | -0.41 | 0.07 | 3 | +0.38 | 0.01 | 1 | +0.12 | — |
| 1651-16 | 2 | -0.50 | 0.12 | 1 | -0.39 | — | 3 | +0.44 | 0.04 | 1 | +0.11 | — |
| 1783-22 | 2 | -0.64 | 0.03 | 3 | -0.38 | 0.11 | 3 | +0.43 | 0.09 | 1 | +0.34 | — |
| 1783-23 | 2 | -0.40 | 0.09 | 3 | -0.57 | 0.07 | 3 | +0.44 | 0.10 | 1 | +0.28 | — |
| 1783-29 | 2 | -0.48 | 0.01 | 3 | -0.57 | 0.07 | 3 | +0.44 | 0.09 | 1 | +0.35 | — |
| 1783-30 | 3 | -0.58 | 0.14 | 2 | -0.39 | 0.02 | 2 | +0.40 | 0.12 | 1 | +0.25 | — |
| 1783-32 | 2 | -0.59 | 0.02 | 3 | -0.67 | 0.06 | 2 | +0.44 | 0.13 | 1 | +0.37 | — |
| 1783-33 | 3 | -0.43 | 0.13 | 2 | -0.64 | 0.04 | 3 | +0.37 | 0.08 | 1 | +0.31 | — |
| 1978-21 | 2 | -0.42 | 0.06 | 3 | -0.29 | 0.10 | 3 | +0.48 | 0.11 | 1 | +0.31 | — |
| 1978-22 | 3 | -0.42 | 0.08 | 3 | -0.44 | 0.07 | 3 | +0.37 | 0.11 | 1 | +0.10 | — |
| 1978-23 | 1 | -0.54 | — | 2 | -0.26 | 0.07 | 3 | +0.49 | 0.09 | 1 | +0.20 | — |
| 1978-24 | 2 | -0.41 | 0.05 | 2 | -0.52 | 0.06 | 3 | +0.47 | 0.10 | 1 | +0.09 | — |
| 1978-26 | 2 | -0.70 | 0.11 | 3 | -0.52 | 0.12 | 2 | +0.37 | 0.04 | 1 | +0.30 | — |
| 1978-28 | 2 | -0.57 | 0.04 | 3 | -0.32 | 0.13 | 3 | +0.52 | 0.10 | 1 | +0.28 | — |
| 1978-29 | 2 | -0.68 | 0.06 | 3 | -0.56 | 0.13 | 3 | +0.34 | 0.13 | 1 | +0.19 | — |
| 1978-32 | 2 | -0.50 | 0.02 | 2 | -0.65 | 0.01 | 3 | +0.38 | 0.03 | 1 | +0.22 | — |
| 1978-34 | 2 | -0.65 | 0.11 | 3 | -0.38 | 0.14 | 3 | +0.50 | 0.13 | 1 | +0.21 | — |
| 1978-38 | 3 | -0.46 | 0.12 | 3 | -0.48 | 0.05 | 3 | +0.57 | 0.09 | — | — | — |
| 1978-42 | 1 | -0.55 | — | 3 | -0.55 | 0.08 | 3 | +0.41 | 0.11 | 1 | +0.26 | — |
| 2173-4 | 2 | -0.34 | 0.16 | 3 | -0.37 | 0.04 | 3 | +0.44 | 0.08 | 1 | +0.17 | — |
| 2173-5 | 2 | -0.35 | 0.05 | 4 | -0.30 | 0.05 | 3 | +0.36 | 0.11 | 1 | +0.16 | — |
| 2173-6 | 2 | -0.35 | 0.13 | 3 | -0.35 | 0.07 | 3 | +0.40 | 0.08 | 1 | +0.29 | — |
| 2173-8 | 3 | -0.36 | 0.18 | 3 | -0.49 | 0.11 | 3 | +0.47 | 0.09 | 1 | +0.19 | — |
| 2173-10 | 3 | -0.21 | 0.14 | 2 | -0.44 | 0.04 | 3 | +0.42 | 0.03 | 1 | +0.18 | — |
| Star ID | n | [Ce/Fe]II | rms | n | [Nd/Fe]II | rms | n | [Eu/Fe]II | rms |
|---|---|---|---|---|---|---|---|---|---|
| (dex) | (dex) | (dex) | (dex) | (dex) | (dex) | ||||
| 1.55 | 1.50 | 0.51 | |||||||
| 1651-6 | 1 | -0.03 | — | 2 | +0.41 | 0.15 | 1 | +0.24 | — |
| 1651-8 | 1 | +0.03 | — | 2 | +0.52 | 0.08 | 1 | +0.37 | — |
| 1651-10 | 1 | +0.16 | — | 2 | +0.30 | 0.06 | 1 | +0.34 | — |
| 1651-12 | 1 | +0.08 | — | 3 | +0.40 | 0.03 | 1 | +0.44 | — |
| 1651-16 | — | — | — | 2 | +0.22 | 0.07 | — | — | — |
| 1783-22 | 1 | +0.08 | — | 2 | +0.29 | 0.01 | 1 | +0.41 | — |
| 1783-23 | 1 | +0.00 | — | 3 | +0.22 | 0.07 | 1 | +0.37 | — |
| 1783-29 | — | — | — | 3 | +0.30 | 0.13 | 1 | +0.39 | — |
| 1783-30 | 1 | +0.10 | — | 2 | +0.40 | 0.12 | 1 | +0.34 | — |
| 1783-32 | 1 | -0.13 | — | 1 | +0.21 | — | — | — | — |
| 1783-33 | 1 | -0.08 | — | 2 | +0.49 | 0.05 | 1 | +0.57 | — |
| 1978-21 | 1 | -0.08 | — | 3 | +0.56 | 0.08 | 1 | +0.34 | — |
| 1978-22 | 1 | +0.05 | — | 3 | +0.44 | 0.13 | 1 | +0.51 | — |
| 1978-23 | 1 | -0.02 | — | 3 | +0.39 | 0.15 | 1 | +0.34 | — |
| 1978-24 | — | — | — | 4 | +0.41 | 0.07 | — | — | — |
| 1978-26 | 1 | -0.06 | — | 3 | +0.36 | 0.07 | 1 | +0.31 | — |
| 1978-28 | 1 | +0.10 | — | 2 | +0.31 | 0.10 | 1 | +0.35 | — |
| 1978-29 | 1 | -0.13 | — | 3 | +0.32 | 0.14 | 1 | +0.54 | — |
| 1978-32 | 1 | +0.03 | — | 3 | +0.33 | 0.12 | 1 | +0.37 | — |
| 1978-34 | — | — | — | 1 | +0.22 | — | — | — | — |
| 1978-38 | 1 | +0.03 | — | 2 | +0.16 | 0.02 | 1 | +0.49 | — |
| 1978-42 | 1 | -0.02 | — | 2 | +0.35 | 0.08 | — | — | — |
| 2173-4 | 1 | -0.02 | — | 2 | +0.31 | 0.06 | 1 | +0.37 | — |
| 2173-5 | 1 | +0.07 | — | 3 | +0.42 | 0.09 | 1 | +0.39 | — |
| 2173-6 | 1 | +0.00 | — | 2 | +0.21 | 0.07 | 1 | +0.56 | — |
| 2173-8 | 1 | -0.01 | — | 2 | +0.36 | 0.02 | 1 | +0.49 | — |
| 2173-10 | 1 | +0.05 | — | 2 | +0.20 | 0.05 | 1 | +0.54 | — |
Note. — Europium abundances are derived from spectral synthesis.
| NGC1651 | NGC1783 | |||||||
|---|---|---|---|---|---|---|---|---|
| Ratio | Mean | Mean | ||||||
| (dex) | (dex) | (dex) | (dex) | (dex) | (dex) | |||
| 5 | -0.07 | 0.04 | 0.14 | 6 | -0.06 | 0.08 | 0.14 | |
| 5 | -0.21 | 0.15 | 0.11 | 6 | -0.10 | 0.10 | 0.11 | |
| 5 | +0.10 | 0.04 | 0.11 | 6 | +0.12 | 0.04 | 0.10 | |
| 5 | -0.43 | 0.21 | 0.14 | 6 | -0.49 | 0.13 | 0.14 | |
| 5 | -0.07 | 0.06 | 0.13 | 6 | +0.03 | 0.06 | 0.12 | |
| 5 | +0.00 | 0.04 | 0.13 | 6 | -0.13 | 0.04 | 0.12 | |
| II | 5 | -0.05 | 0.06 | 0.15 | 6 | -0.08 | 0.06 | 0.14 |
| 5 | -0.03 | 0.02 | 0.16 | 6 | +0.03 | 0.06 | 0.14 | |
| 5 | +0.03 | 0.06 | 0.18 | 6 | +0.02 | 0.10 | 0.15 | |
| 5 | -0.08 | 0.07 | 0.12 | 6 | -0.12 | 0.07 | 0.12 | |
| 5 | -0.30 | 0.07 | 0.10 | 6 | -0.35 | 0.06 | 0.07 | |
| II | 5 | -0.19 | 0.03 | 0.21 | 6 | -0.29 | 0.06 | 0.19 |
| 5 | -0.03 | 0.02 | 0.17 | 6 | +0.01 | 0.06 | 0.12 | |
| 5 | +0.01 | 0.05 | 0.09 | 6 | -0.01 | 0.02 | 0.07 | |
| II | 5 | -0.40 | 0.11 | 0.16 | 6 | -0.52 | 0.10 | 0.14 |
| 5 | -0.45 | 0.06 | 0.22 | 6 | -0.54 | 0.13 | 0.16 | |
| II | 5 | +0.45 | 0.04 | 0.13 | 6 | +0.42 | 0.03 | 0.10 |
| II | 5 | +0.20 | 0.10 | 0.21 | 6 | +0.32 | 0.04 | 0.20 |
| II | 4 | +0.06 | 0.08 | 0.21 | 4 | +0.01 | 0.10 | 0.19 |
| II | 5 | +0.37 | 0.11 | 0.14 | 6 | +0.32 | 0.11 | 0.16 |
| II | 4 | +0.35 | 0.08 | 0.21 | 5 | +0.42 | 0.09 | 0.20 |
| NGC1978 | NGC2173 | |||||||
|---|---|---|---|---|---|---|---|---|
| Ratio | Mean | Mean | ||||||
| (dex) | (dex) | (dex) | (dex) | (dex) | (dex) | |||
| 11 | -0.11 | 0.08 | 0.14 | 5 | -0.04 | 0.03 | 0.14 | |
| 11 | -0.16 | 0.13 | 0.13 | 5 | +0.01 | 0.25 | 0.11 | |
| 11 | +0.19 | 0.04 | 0.14 | 5 | +0.10 | 0.05 | 0.10 | |
| 11 | -0.52 | 0.07 | 0.14 | 5 | -0.31 | 0.10 | 0.14 | |
| 11 | +0.09 | 0.04 | 0.12 | 5 | +0.07 | 0.03 | 0.12 | |
| 11 | -0.11 | 0.05 | 0.15 | 5 | +0.00 | 0.06 | 0.13 | |
| II | 11 | -0.17 | 0.09 | 0.15 | 5 | -0.12 | 0.07 | 0.14 |
| 11 | +0.08 | 0.07 | 0.16 | 5 | +0.15 | 0.04 | 0.16 | |
| 11 | +0.05 | 0.13 | 0.18 | 5 | -0.03 | 0.09 | 0.18 | |
| 11 | -0.13 | 0.04 | 0.11 | 5 | -0.05 | 0.05 | 0.11 | |
| 11 | -0.38 | 0.07 | 0.10 | 5 | -0.51 | 0.07 | 0.09 | |
| II | 11 | -0.26 | 0.06 | 0.18 | 5 | -0.37 | 0.06 | 0.15 |
| 11 | -0.01 | 0.09 | 0.14 | 5 | -0.07 | 0.09 | 0.13 | |
| 11 | +0.05 | 0.06 | 0.09 | 5 | -0.07 | 0.04 | 0.08 | |
| II | 11 | -0.54 | 0.11 | 0.14 | 5 | -0.32 | 0.06 | 0.15 |
| 11 | -0.45 | 0.12 | 0.18 | 5 | -0.39 | 0.07 | 0.18 | |
| II | 11 | +0.45 | 0.07 | 0.11 | 5 | +0.42 | 0.04 | 0.11 |
| II | 10 | +0.22 | 0.08 | 0.20 | 5 | +0.20 | 0.05 | 0.20 |
| II | 9 | -0.01 | 0.07 | 0.20 | 5 | +0.02 | 0.04 | 0.21 |
| II | 11 | +0.35 | 0.11 | 0.18 | 5 | +0.30 | 0.09 | 0.16 |
| II | 8 | +0.41 | 0.09 | 0.20 | 5 | +0.47 | 0.09 | 0.21 |
| Star | ||||||
|---|---|---|---|---|---|---|
| (m) | (m) | (m) | (m) | (m) | (m) | |
| 1651-6 | 176.3 | 172.6 | 260.5 | 258.3 | 262.0 | 259.5 |
| 1651-12 | 162.9 | 162.2 | 271.4 | 266.9 | 230.9 | 228.5 |
| 1783-22 | 170.7 | 168.8 | 274.0 | 272.2 | 231.0 | 227.8 |
| 1783-29 | 159.5 | 154.0 | 253.9 | 250.4 | 252.1 | 248.5 |
| 1978-22 | 163.4 | 161.3 | 277.4 | 275.3 | 259.5 | 254.7 |
| 1978-42 | 164.1 | 162.7 | 252.9 | 249.2 | 250.4 | 247.8 |
| 2173-6 | 177.6 | 175.3 | 258.4 | 255.0 | 244.3 | 238.9 |
| 2173-8 | 179.1 | 176.4 | 252.7 | 250.5 | 243.0 | 240.3 |