22institutetext: Astrophysics Group, Blackett Laboratory, Imperial College, Prince Consort Road, SW7 2BZ, U.K.
33institutetext: Present address: Max Planck Institut für Extraterrestrische Physik, Giessenbachstrasse, D-85748 Garching, Germany
Searching for mid-IR obscured AGN in the CDFN
The efficiency of mid-infrared selection methods for finding obscured AGN is investigated using data in the Chandra Deep Field North. It is shown that samples of AGN candidates compiled on the basis of mid-infrared colours only suffer substantial contamination from normal galaxies. X-ray stacking analysis reveals a soft mean X-ray spectrum for these sources, consistent with . This suggests that star-forming galaxies and not obscured AGN dominate the stacked signal. In contrast AGN selection methods that combine mid-infrared with optical criteria are more successful in finding heavily obscured AGN candidates. A method similar to the one proposed by Fiore et al. (2008) is adopted to select extremely red objects ( mag) with high to optical flux ratio (). About 80% of these sources are not detected at X-ray wavelengths. Stacking the X-ray photons at the positions of these sources shows a flat mean X-ray spectrum (), which suggests Compton-thick sources, low-luminosity and moderately obscured ( ) AGN, or a combination of the two. The mid-infrared colours and luminosities of these sources are consistent with ULIRGs at , while HST/ACS images, available for the optically brighter of these sources, show disturbed optical morphologies in many of them. The evidence above suggests that this population includes systems in the process of formation.
Key Words.:
X-rays: general; X-rays: diffuse emission; X-rays: galaxies; Infrared: galaxies1 Introduction
A major challenge in the quest to constrain the accretion history of the Universe is to compile unbiased samples of active galactic nuclei (AGN). Obscuration in the vicinity of the supermassive black hole (SBH) and dilution of the AGN emission from stellar light associated with the host galaxy (e.g. Moran et al. 2002, Severgnini et al. 2003), introduce severe selection effects against certain types of AGN. X-ray observations, especially at energies above about 2 keV, have been shown to be efficient in minimising these biases. Hard X-rays, 2-10 keV, can penetrate high column densities of gas and dust clouds and suffer minimal contamination by emission from the host galaxy, e.g. X-ray binaries and hot gas (Hornschemeier et al. 2003).
Recent observations at X-rays have highlighted the effectiveness of this wavelength regime in locating accreting SBHs. Firstly, X-ray luminous AGN have been revealed at the centres of apparently normal galaxies, with optical spectra dominated by stellar emission (e.g. Comastri et al. 2002; Georgantopoulos et al. 2003; Georgantopoulos & Georgakakis 2005). Secondly, the deepest X-ray survey to date, the 2 Ms Chandra Deep Field North (CDF-N), finds an AGN density of over (Alexander et al. 2003; Bauer et al. 2004), an order of magnitude higher than optically selected broad-line QSOs, which reach number densities of only 400 at mag (Wolf et al., 2003).
The X-ray surveys in the 2-10 keV band , although efficient in compiling nearly unbiased AGN samples are not perfect either. In the case of very high obscuring gas column densities, , Compton scattering by bound electrons becomes important. This mechanism blocks photons with energies below almost 10 keV at the rest frame. If AGN lie behind such high columns densities, one can only hope to detect them indirectly in the 2-10 keV band. For example in the case of a toroidal geometry of the obscuring material X-ray photons are expected to be reflected off the inner surface the torus into our line of sight. This reflected component however, is typically about 2 dex fainter than the direct (obscured) power-law emission. This causes even the 2-10 keV surveys to under-sample the Compton-thick AGN population (Tozzi et al., 2006; Georgantopoulos, Georgakakis & Akylas, 2007). A large number of active SBH are believed to belong to this class of heavily obscured sources. Up to 50% of the Seyfert-2s at low redshift for example, are Compton-thick candidates (Maiolino & Rieke, 1995; Risaliti, Maiolino & Salvati, 1999; Guainazzi, Matt & Perola, 2005; Panessa et al., 2006). Moreover, the peak of the diffuse X-ray background (XRB) spectrum at 30-40 keV (Gruber et al. 1999, Frontera et al. 2007, Churazov et al. 2007) can only be modeled by invoking a population of Compton-thick AGN, which are missing from existing 2-10 keV X-ray surveys (Gilli et al. 2007). The evidence above underlines the significance of Compton-thick AGN for understanding both the XRB and the accretion on SBHs across the history of the Universe. The precise fraction of these heavily obscured sources is still uncertain however, by up to a factor of few (e.g. Gilli et al. 2007).
The bias of the 2-10 keV X-ray imaging surveys against heavily obscured AGN has motivated alternative methods for finding such systems. The mid-infrared wavelength regime (mid-IR; m) in particular, has received much attention recently and is proposed as a potentially powerful tool for identifying deeply buried AGN. The optical and UV photons from the AGN heat the dust of the obscuring material around the central engine and are re-emitted as thermal radiation at the mid-IR. Therefore, surveys with the Spitzer infrared mission provide an excellent opportunity to recover these heavily obscured sources. The disadvantage of mid-IR surveys is that the AGN are outnumbered by star-forming galaxies and some selection method is necessary to separate the two populations. It has been suggested that mid-IR colour-colour plots can be used to effectively isolate obscured AGN. The principle behind this approach is that luminous AGN have power-law spectral energy distribution (SED) in the mid-IR, while galaxies have characteristic black-body spectra that peak at about 1.6 m. The mid-IR colours of AGN are therefore redder than those of galaxies defining a characteristic wedge. Different combinations of mid-IR colours have been proposed to select AGN. Lacy et al. (2004) and Hatziminaoglou et al. (2005) define their selection window based on the mid-IR colours of luminous high-redshift QSOs identified in the Sloan Digital Sky Survey. These techniques were tested against control samples and turned to be particularly efficient when combined with an additional criterion. Lacy et al. (2004) impose a flux larger than 1 mJy at 8.0 . Stern et al. (2005) impose a magnitude limit of R=19 finding that their mid-IR colours selection technique provides a 90% efficiency in detecting AGN.
In a complementary approach Alonso-Herrero et al. (2006) and Donley et al. (2007) select sources with power-law SEDs in the mid-IR. The X-ray identification rate of these sources is about 50% in the 1 Ms Chandra Deep Field South (Giacconi et al., 2002), increasing to in the deeper 2 Ms CDF-N. Parallel to the mid-IR studies above, selection methods using a combination of IR, optical and/or radio criteria have been developed, also claiming the identification of type-2 AGN (e.g. Martinez-Sansigre et al. 2005; Daddi et al. 2007; Fiore et al. 2008).
The selection methods above have been highly influential by providing samples of deeply buried AGN candidates, some of which may be so obscured that remain undetected to the limits of the deepest current X-ray surveys. Even for these sources however, getting a handle on their X-ray properties is essential, firstly to control any residual contamination by non-AGN and secondly to estimate their contribution to the XRB. Stacking analysis is a powerful tool to study the mean X-ray properties of sources below the detection threshold of X-ray observations (e.g. Daddi et al. 2007; Fiore et al. 2008; Georgakakis et al. 2008). Here we use X-ray stacking to assess the efficiency of mid-IR based selection methods in identifying obscured AGN. The data are from the northern field of the Great Observatories Origins Deep Survey (GOODS; Dickinson et al. 2003). We adopt , , .
2 The Data
The CDF-N is centred at , (J2000) and has been surveyed extensively over a range of wavelengths by both ground-based facilities and space missions. The multiwaveband data in this field include Chandra X-ray observations, Spitzer mid-IR photometry, HST/ACS high resolution optical imaging, deep optical photometry and spectroscopy from the largest ground based telescopes.
The 2Ms Chandra survey of the CDF-N consists of 20 individual ACIS-I (Advanced CCD Imaging Spectrometer) pointings observed between 1999 and 2002. The combined observations cover a total area of and provide the deepest X-ray sample currently available. Here we use the X-ray source catalogue of Alexander et al. (2003), which consists of 503 sources detected in at least one of the seven X-ray spectral bands defined by these authors in the range keV. The flux limits in the and the keV bands are and , respectively. The Galactic column density towards the CDF-N is (Dickey & Lockman, 1990).
The most X-ray sensitive part of the CDF-N has been observed in the mid-IR by the Spitzer mission (Werner et al., 2004) as part of the GOODS. These observations cover an area of about in the CDF-N using both the IRAC (3.6, 4.5, 5.8 and 8.0) and the MIPS () instruments onboard Spitzer. Here we use the 2nd data release (DR2) of the IRAC super-deep images (version 0.30) and the interim data release (DR1+) of the MIPS 24 mosaic (version 0.36) provided by the GOODS team (Dickinson et al. 2003; Dickinson et al. in preparation). Sources are detected in these images using the SExtractor (Bertin & Arnouts, 1996) software. The completeness limits i.e. the flux where the counts peak before dropping off because of incompleteness are 0.7, 0.7, 2.8, 3.5 and 56 in the 3.6, 4.5, 5.8, 8.0 and 24 bands respectively. Full details on the source extraction and flux derivation are presented in Georgakakis et al. (2007). Much of the analysis presented here uses the selected sample, which consists of 1619 sources down to a () limiting flux of about 15 .
Multi-waveband optical imaging (BVRIz’) in the CDF-N region has been obtained using the SUBARU 8.2-m telescope. U-band observations have been obtained at the 4-m Kitt Peak Telescope while observations have been obtained at the 2.2-m University of Hawaii telescope. All the observations are described in Capak et al. (2004). Deep HST ACS observations in the B,V,I,Z bands are also available (Giavalisco et al. 2004). However, we choose to use the catalogue of Capak et al. (2004) as this is clearly more suitable for the derivation of photometric resdhifts. Here, we use the -band selected sample, which contains 47451 sources down to a limiting magnitude of mag (5). These observations cover about and extend beyond the GOODS field of view (). The catalogue is first cross-correlated with the IRAC catalogue using a matching radius of 2 arcsec. For sources with counterparts (95 per cent of the population), the more accurate positions are used to search for optical identifications within a radius of 2 arcsec. There are 1409 /optical associations. Given the search radius of 2 arcsec and the distribution of the positional offsets between the optical and the mid-IR sources, we expect a spurious identification rate of about 4.5% at the limit of the optical catalogue, mag. A total of 336 out of the 1409 sources are excluded from the analysis, because they lie either close to a bright source, or at the edge of the surveyed area or they are not detected in at least one of the four IRAC bands.
Optical spectroscopy in the CDF-N and in the GOODS-North is available from either observations that specifically target the X-ray population in these fields (e.g. Barger et al. 2003, 2005; Cowie et al. 2004) or the Keck Treasury Redshift Survey (TKRS). This program uses the DEIMOS spectrograph (Faber et al. 2003) at the Keck-II telescope to observe optically selected galaxies to mag in the GOODS-North. The publicly available catalogue consists of about 1400 secure redshifts, of which about 500 are associated with sources.
3 The sample selection
The sample of mid-IR wedge AGN candidates is compiled from the GOODS-North catalogue. Two different AGN identification methods are employed. The first one is based on the IRAC band colour criteria of Stern et al. (2005). The second method combines optical and mid-IR wavebands by adopting criteria similar to those proposed by Fiore et al. (2008).
3.1 The mid-IR wedge AGN candidates
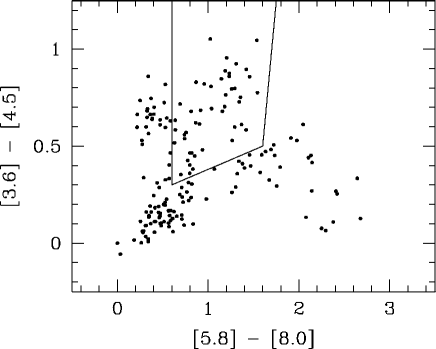
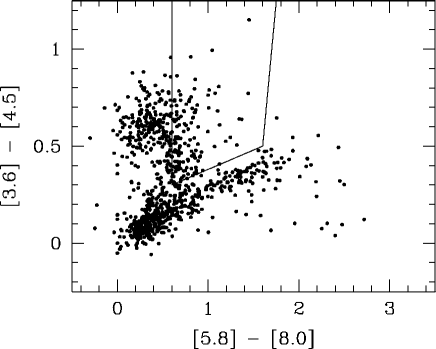
The mid-IR wedge AGN candidates lie in the area of the colour-colour diagram proposed by Stern et al. (2005)111, , and . [3.6], [4.5], [5.8], and [8.0] are the (Vega) magnitudes in the respective IRAC wavebands. This selection method is graphically shown in Fig. 1, where in the upper left panel we plot the X-ray detected sample (173 sources) while in the upper right panel we plot all the sources without X-ray detection (896). Only sources with optical counterparts and detections in all 4 IRAC bands are employed. The sample of mid-IR wedge selected candidate AGN consists of 177 sources, 46 of them with X-ray detection and 131 not individually detected in the X-rays.
The Stern et al. (2005) criteria are preferred here over alternative AGN identification methods which use mid-IR colours only, because they are likely to suffer less contamination from normal galaxies, while at the same time remain sensitive to obscured AGN (e.g. Barmby et al. 2006).
For comparison, we also explore the X-ray properties of the sources outside the Stern colour wedge. This sample has 896 sources with optical identifications and detections in all 4 IRAC bands.
3.2 The red/optically-faint mid-IR AGN candidates
Fiore et al. (2008) proposed a method which combines optical, near-IR and mid-IR data to identify AGN. These authors used red optical colours () in combination with high mid-IR () to optical (-band) flux ratio, , claiming a large number of Compton-thick AGN in the CDF-South.
We use similar selection criteria to compile the sample of red/optically-faint mid-IR AGN candidates in the CDF-North. This consists of 103 sources with detection, and mag, where is the magnitude at in the AB system. The Fiore et al. (2008) mag colour cut has been replaced by the nearly equivalent mag. This cutoff is adopted to select sources redder than the elliptical galaxy template of Coleman, Wu & Weedman (1980) at . Optical counterparts are available for 31 of these sources. Therefore most of our points refer to and lower limits.
The position of the red/optically-faint mid-IR AGN candidates on the Stern et al. (2005) colour diagram is shown in Fig. 1. The majority of these sources lie outside and on the left of the AGN wedge on this diagram.
4 The Spectral Energy Distribution fitting method
For sources with optical counterparts (1409), we model the observed UV/optical to mid-IR Spectral Energy Distribution (SED). This is both to determine photometric redshifts for sources without optical spectroscopy and to get an estimate of the total infrared luminosity.
The adopted template fitting method is that of Rowan-Robinson et al. (2005). This is a two step process. First, the -band to photometric data are fit using a library of 8 templates described by Babbedge et al. (2004), six galaxies (E, Sab, Sbc, Scd, Sdm and sb) and two AGN. One AGN template is based on the SDSS median composite quasar spectrum (Vanden Berk et al. 2001); this is extended to wavelengths longer than 8555A using the IR part of the average QSO spectrum defined in Rowan-Robinson et al. (2004). In addition to the composite SDSS template, a simpler template has been used, based on the mean optical quasar spectrum of Rowan-Robinson (1995) spanning the range 400A to 25 . Photometric redshifts are determined at this stage. The accuracy is ( rms), estimated based on the 513 sources with available optical spectroscopy.
At the next step the mid-IR SED of the sources in the sample is fit. At longer wavelengths () any dust may significantly contribute or even dominate the observed emission. Before fitting models to these wavelengths the stellar contribution is subtracted from the photometric data by extrapolating the best-fit galaxy template from the previous step. The residuals are then fit with a mixture of four templates: cirrus (Efstathiou & Rowan-Robinson 2003), AGN dust tori (Rowan-Robinson 1995; Efstathiou & Rowan-Robinson 1995), M 82 and Arp 220 starbursts (Efstathiou et al. 2000). The modeling above provides an estimate of the total infrared luminosity, , in the wavelength range . As discussed by Rowan-Robinson et al. (2005) this is expected to be accurate within a factor of two.
5 X-ray stacking
5.1 Method
Stacking techniques have been widely used in X-ray Astronomy to study the mean properties of source populations selected to have certain well defined properties and which are too X-ray faint to be detected individually (e.g. Alexander et al., 2001; Nandra et al., 2002; Georgakakis et al., 2003).
A fixed radius aperture is used to extract and to sum the X-ray photons at the positions of the various selected sub-samples. Sources that lie close to or are associated with an X-ray detection are excluded from the analysis to avoid contamination of the stacked signal from the X-ray photons of detected sources. We adopt an extraction radius of 3 arcsec. This is found to maximise the signal-to-noise ratio of the stacked signal. A 3 arcsec aperture encloses more than about 90% of the photons in the keV spectral band at an off-axis angle of 5 arcmin. The average off-axis angle for our sources is 5.5 arcmin.
The significance of the stacked signal depends on the value of the background. This is estimated using the smoothed background maps produced by the WAVDETECT task of CIAO by summing the X-ray photons in regions around each source used in the stacking. The significance of the stacked signal in background standard deviations is estimated by , where and are the total (source + background) and background counts respectively.
An estimate of the mean spectral shape of the detected signal is obtained by performing the stacking in two energy bands, soft ( keV) and hard ( keV). Fiore et al. (2008) has shown that this choice of bands minimises the instrumental background contamination and maximises the sensitivity of the stacking analysis. Fluxes are determined by multiplying the stacked count rate by the appropriate energy conversion factor, which is estimated separately for each class of sources, based on the spectral shape of the stacked signal.


| Sample | |||
|---|---|---|---|
| () | |||
| (1) | (2) | (3) | (4) |
| wedge mid-IR AGN | 177 | 46 | 26 |
| sources outside | 896 | 127 | 14 |
| wedge | |||
| red/optically-faint | 103 | 20 | 19 |
| mid-IR AGN |
-
The columns are: (1): sample definition. (2): is the total number of sources. (3): is the number of X-ray selected AGN in the sample. The Alexander et al. (2003) X-ray catalogue is cross-correlated with the positions of the sources using a matching radius of 3 arcsec. The X-ray emission of 44 sources in the CDF-North are likely dominated by star-formation (Georgakakis et al. 2007). These non-AGN are excluded from the cross-correlation. (4): is the fraction of X-ray detected AGN in the sample, i.e. .
5.2 Mid-IR wedge AGN
Table 1 summarises the fraction of X-ray detected AGN in different selected samples. The mid-IR wedge AGN candidates have a relatively high X-ray identification rate, about 26%. In contrast, only about 14% of the sources outside that wedge are associated with X-ray AGN. Fig. 2 shows that the mid-IR wedge AGN candidates lie at moderately high redshift on average, . The X-ray detected members of this population have a flatter redshift distribution that extends to . It appears that X-ray observations are more efficient in detecting the high redshift end of the mid-IR wedge AGN candidates. Fig. 3 plots the total IR luminosity distribution of these sources. Most of the mid-IR wedge AGN candidates belong to the Luminous Infrared Galaxy class (LIGs), with .
Mid-IR wedge AGN candidates that lie close to or are associated with an X-ray detection are excluded from the stacking analysis to avoid contamination of the stacked signal by the X-ray photons in the wings of the Chandra PSF. The stacking results for the remaining mid-IR wedge AGN candidates are presented in Table 2. We estimate a soft mean X-ray spectrum for these sources, consistent with . The mean 1.5-4.0 keV band X-ray luminosity of this population is . For comparison, there are 670 sources outside the Stern et al. wedge which do not lie close to an X-ray detection. Stacking analysis shows that the mean hardness ratio of this population is consistent with and the mean X-ray luminosity is , i.e. similar to that obtained for the mid-IR wedge AGN candidates. In passing, we note that the average hardness ratio of the 46 mid-IR wedge AGN which are detected at X-rays is corresponding to .
5.3 Red/optically faint mid-IR AGN candidates
The red/optically-faint mid-IR AGN candidates have an X-ray identification rate of about 19% (Table 1). Stacking the X-ray photons at the positions of these 83 sources that are not detected individually at X-rays yields a statistically significant detection in both the soft and the hard energy bands (table 3). The mean hardness ratio corresponds to a photon index of . However, as the hardness ratios cannot differentiate between an intrinsically flat and an absorbed spectrum, it is equally possible that we are viewing AGN with absorbing column densities of for an intrinsic power-law X-ray spectrum with and a mean redshift of . For comparison, the hardness ratio of the 20 red/optically-faint sources with X-ray detection is corresponding to . After the exclusion of one source which dominates the hard X-ray signal we obtain a hardness ratio of corresponding to . Only a small subsample of the red/optically-faint mid-IR AGN candidates, 31 out of 103, have optical counterparts. The mean photometric redshift for these 31 sources is and the mean IR luminosity is , i.e. Ultra-Luminous Infrared Galaxies (ULIRGs). We note that one of the optically identified red/optically-faint mid-IR AGN candidates is a sub-mm source at a spectroscopic redshift of (Alexander et al. 2005).
| Type | No | exposure | Soft counts | Soft Flux | Hard counts | Hard Flux | HR | |||
|---|---|---|---|---|---|---|---|---|---|---|
| (1) | (2) | (3) | (4) | (5) | (6) | (7) | (8) | (9) | (10) | (11) |
| AGN | 126 | 1.44 | 190 | (7.1) | (3.8) | |||||
| Galaxies | 670 | 1.05 | 1010 | (15.0) | () |
-
The columns are: (1) sample definition; (2): Number of sources used in the stacking; (3): mean redshift; (4) effective exposure time in Ms; (5): net counts in the 0.3-1.5 keV band and significance; (6): flux in the 0.3-1.5 keV band in units of ; (7): luminosity in the 0.3-1.5k̇eV band in units of ; (8) net counts in the 1.5-4 keV band and significance; (9) flux in the 1.5-4 keV band in units of ; (10) Hardness Ratio; (11): Soft X-ray (1.5-4 keV) to IR luminosity ratio
| Type | No | exposure | Soft counts | Soft Flux | Hard counts | Hard Flux | HR |
|---|---|---|---|---|---|---|---|
| (1) | (2) | (3) | (4) | (5) | (6) | (7) | (8) |
| AGN | 83 | 125 | 105 (3.8) | 164(5.4) |
-
The columns are: (1) sample definition; (2): Number of sources used in the stacking; (3)) effective exposure time in Ms; (4): net counts in the 0.3-1.5 keV band and significance; (5): flux in the 0.3-1.5 keV band in units of ; (6) net counts in the 1.5-4 keV band and significance; (8) Hardness Ratio.
6 Discussion
6.1 Mid-IR wedge AGN candidates
The X-ray background population synthesis models of Gilli et al. (2007) predict a steeply rising number of Compton-thick AGN just below the flux limit of the CDF-N. In particular, they predict that 25% of the sources in the keV band are Compton-thick AGN at fluxes . Extrapolating the AGN number-count distribution of Bauer et al. (2004) yields about 70 Compton-thick AGN in the common Spitzer/Chandra strip at these flux levels. At fluxes of , comparable to the flux of the mid-IR wedge AGN, this number rises to 200. The application of the colour criteria of Stern et al. (2005) in the GOODS North sample have identified 131 AGN with no X-ray counterpart. The number of mid-IR wedge AGN candidates is of the same order of magnitude as that predicted by the X-ray background synthesis models. We caution that the above is only a very coarse comparison as the XRB synthesis models cannot accurately predict the number of Compton-thick AGN at mid-IR wavelengths. This is because some sources can be so obscured that the nuclear flux will emerge only at the longest rest frame wavelengths, outside the IRAC bands, (Silva et al. 2004, Ballantyne & Papovich 2007). Moreover, at high redshift () the IRAC bands will sample only the rest frame galaxy emission.
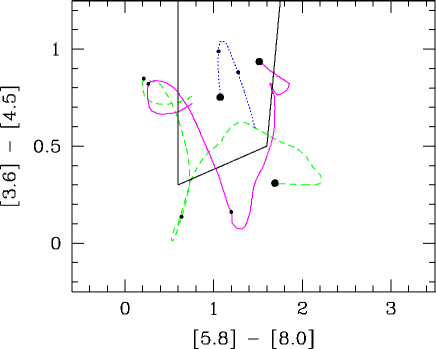
The steep mean X-ray spectral properties of these sources, , are inconsistent with the flat spectral index expected for Compton-thick AGN in the Chandra passband (; e.g. Georgantopoulos et al. 2007). This makes the case for a substantial fraction of Compton-thick sources among the mid-IR wedge AGN candidates difficult. Further clues on the nature of these sources can be obtained from the ratio between X-ray and infrared luminosities. This is estimated , approximately 2 dex lower than unobscured AGN (Elvis et al. 1994), and comparable to the ratio of , determined for the mid-IR sources outside the Stern et al. wedge (see Table 2). For comparison, local star-forming galaxies have (adapted from Ranalli et al. 2003). This is a factor of few higher than the value derived for the mid-IR wedge candidate AGN. The very low value of suggests that the mid-IR wedge candidate AGN sample is largely contaminated by normal galaxies. This is demonstrated in Fig. 1, where the colour-colour track of the star-forming galaxy Arp 220 overlaps with the Stern et al. wedge at specific broad redshift intervals.
6.2 Comparison with mid-IR power-law methods
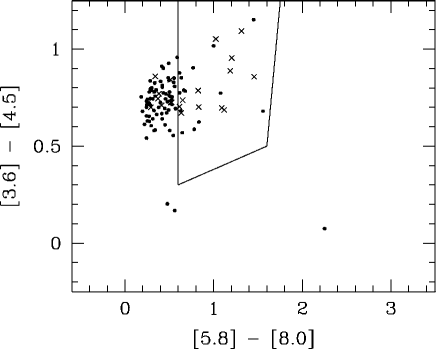
Mid-IR power-law selection criteria have been proposed to produce AGN samples with a small level of galaxy contamination. The mid-IR power-law sources form a subsample of the mid-IR wedge sources of Stern et al. (2005). Alonso-Herrero et al. (2006) selected 24 m sources in the CDF-S which present red power-law SEDs in the Spitzer m) bands ( with ). Nearly half of their 92 sources are not detected in X-rays. Donley et al. (2007) apply similar power-law SED criteria to the Spitzer sources of CDF-N with the difference that they do not require their sources to be detected in 24 m. They consider 47 AGN within an off-axis angle of 10 arcmin. Donley et al. (2007) find that of these, 30 are detected in the Alexander et al. (2003) catalogue, 10 more are detected at very low significance () at X-ray wavelengths, and 7 remain undetected. In Fig. 4 we show the position of the power-law selected sources on the mid-IR colour-colour diagram. The vast majority fall within the Stern wedge. We note that the 17 sources (10 low significance and the seven undetected) of Donley et al. generally avoid the central part of the CDF-N. This suggests that these have not been detected in the Alexander et al. (2003) catalogue simply because the exposure time is lower in these regions due to vignetting.
In order to compare their work with our results, we estimate the co-added signal of the 17 sources. The results are presented in Table 4. We detect a statistically significant signal in both the soft (0.3-1.5 keV) and the hard (1.5-4 keV) band. The average flux in the 0.5-2 keV band is , very close to the flux limit of the current CDF-N observation. The hardness ratio is translating to a photon index of , or alternatively a column density of at z=2 (for ). We note that when we stack only the 7 sources which are not detected at X-rays, we obtain no signal in either the soft or the hard band. In any case, the number of missed AGN in X-ray surveys recovered with mid-IR power-law methods is not high. Donley et al. (2007) find 7 mid-IR AGN not detected in X-rays which form a miniscule fraction of the few hundreds X-ray detected AGN in the same area. This figure is at least one order of magnitude lower than the estimates of the X-ray background population synthesis models, which predict large numbers of Compton-thick AGN at fluxes just fainter than the CDF-N (Gilli et al. 2007).

| Type | No | exposure | Soft counts | Soft Flux | Hard counts | Hard Flux | HR |
|---|---|---|---|---|---|---|---|
| (1) | (2) | (3) | (4) | (5) | (6) | (7) | (8) |
| AGN | 17 | 18 | 78 (7.8) | 68 (5.9) |
-
The columns are: (1) sample definition; (2): Number of sources used in the stacking; (3)) effective exposure time in Ms; (4): net counts in the 0.3-1.5 keV band and significance; (5): flux in the 0.3-1.5 keV band in units of ; (6) net counts in the 1.5-4 keV band and significance; (8) Hardness Ratio.
6.3 Red/optically faint mid-IR AGN candidates
Red/optically faint mid-IR AGN candidates are more promising in terms of number density for being the Compton-thick population predicted by the models of Gilli et al. (2007). For the red/optically-faint mid-IR AGN candidates we estimate a mean hardness ratio of , which is comparable to that derived by Fiore et al. (2008; ) for similarly selected sources in the CDF-South. Our hardness ratio corresponds to a photon index of , in the range of the spectral index of Compton-thick AGN which are dominated by the reflected component. The mid-IR–to–X-ray flux ratio of these sources is , similar to that of the prototype Compton- thick AGN NGC 1068 at (Daddi et al. 2007). It is therefore likely that a large fraction of the red/optically-faint AGN candidates are associated with Compton-thick sources at high redshift. Alternatively, they may be low-luminosity AGN obscured by column densities, at redshift of z=2. Good quality X-ray spectra could differentiate between the above scenaria. However, the average flux of these sources is about a factor of four lower than the current flux limits of the 2 Ms CDF-N in both the 0.3-1.5 and 1.5-4 keV bands. This means that a total of 8 Ms of Chandra observations are needed just to detect this population in the soft-band at least in the central part of the field-of view, where the background will remain photon limited (see Alexander et al. 2003). Alternatively, near-IR spectra could be useful in detecting AGN signatures such as a strong [OIII] line.
The mid-IR colours of the red/optically-faint mid-IR AGN candidates provide additional information on their nature. In Fig. 1 the majority of these sources lie in the region of the parameter space occupied by ULIRGs, such as Arp220 or Mrk273, at redshifts , i.e. galaxies in formation, possibly through mergers (Mirabel & Sanders 1996). This is consistent with the mean photometric redshift of and the mean total infrared luminosity of estimated for the 31 red/optically-faint mid-IR AGN candidates with optical counterparts. High resolution HST/ACS images also suggest that these sources include interacting systems. There are 20 sources bright enough in the or bands for visual inspection. Many of them (13) either show disturbed optical morphology or are in close pairs/associations. One of them is associated with a sub-mm source at . Although the morphological subsample represents only about 20% of the red/optically-faint mid-IR AGN candidates, the evidence above is suggestive that this population includes galaxies captured in the process of formation via tidal interactions. In this respect, these obscured AGN bear many similarities to high redshift systems believed to undergo the concurrent growth of their stellar population and their central SBH. Both sub-mm galaxies at (Alexander et al. 2005) and mid-IR excess 24 selected sources at (Daddi et al. 2007) are suggested to harbour Compton-thick AGN, in addition to star-formation activity.
Interestingly at lower redshift, , most of the obscured AGN are associated with early-type galaxies rather than systems in formation (e.g. Rovilos & Georgantopoulos 2007). Georgakakis et al. (2008) used stacking analysis to search of heavily obscured AGN among different types of galaxies in the range . They showed the emergence of an X-ray faint and obscured AGN population, possibly including some Compton-thick sources, among galaxies in the red cloud, where most of the early-type quiescent systems are found. The evidence above may suggest a change in the properties of the galaxies that host obscured, possibly Compton-thick, AGN. At high redshift, , an increasing body of evidence points to a link with galaxies in formation, while at lower redshifts, , they are found in early type hosts.
7 Conclusions
We investigate the X-ray properties of mid-IR selected AGN in the CDF-N, using the Spitzer sample. Our conclusions can be summarised as follows.
-
•
Stacking analysis of the mid-IR wedge AGN candidates reveals a soft mean X-ray spectrum, consistent with , and a low X-ray–to–IR luminosity ratio, both suggesting that the sample is contaminated by normal galaxies. We conclude that the mid-IR colour ’wedge’ methods fail to easily identify AGN, when applied to faint optical magnitudes.
-
•
Mid-IR ’power-law’ selection techniques are more successful in finding AGN. These sources overlap substantially with X-ray selected AGN however, and do not represent a new X-ray weak population. Moreover, the total number of mid-IR ’power-law’ AGN in the CDF-N is well below the total number of Compton-thick AGN predicted by X-ray background population synthesis models.
-
•
Sources with high 24–to–optical () flux ratio and red colours () have hard stacked X-ray spectrum (), suggesting Compton-thick systems, Low Luminosity AGN with column densities of or a combination of the two. Most of these sources occupy a distinct region of the colour-colour mid-IR diagram and lie outside of the Stern wedge. The mid-infrared colours and luminosities of these sources are consistent with ULIRGs at . For the optically bright subsample of this population, the HST/ACS images show evidence for interactions, suggesting systems in the process of formation.
Acknowledgements.
We thank the anonymous referee for numerous comments and suggestions which helped to improve the paper. AG has been supported by funding from the Marie-Curie Fellowship grant MEIF-CT-2005-025108. We acknowledge use of Spitzer data provided by the Spitzer Science Center. The Chandra data were taken from the Chandra Data Archive at the Chandra X-ray Center.References
- Alexander et al. (2001) Alexander, D. M., Brandt, W. N., Hornschemeier, A., et al. 2001, AJ, 122, 2156
- Alexander et al. (2003) Alexander, D. M., Bauer, F. E., Brandt, W. N., et al., 2003, AJ, 126, 539
- Alexander et al. (2005) Alexander, D.M., Bauer, F.E., Chapman, S.C. et al., 2005, ApJ, 632, 736
- Alonso-Herrero et al. (2006) Alonso-Herrero, A., Perez-González, P. G., Alexander, D. M., et al., 2006, ApJ, 640, 167
- Babbedge et al. (2004) Babbedge, T. S. R., Rowan-Robinson, M., Gonzalez-Solares, E., et al., 2004, MNRAS, 353, 654
- Ballantyne & Papovich (2007) Ballantyne, D.R., Papovich, C., 2007, ApJ, 660, 988
- Barger et al. (2003) Barger, A. J., Cowie, L. L., Capak, P., et al., 2003, AJ, 126, 632
- Barmby et al. (2006) Barmby, P., Alonso-Herrero, A., Donley, J. L. et al., ApJ, 2006, 642, 126
- Bauer et al. (2004) Bauer, F. E., Alexander, D. M., Brandt, W. N., Schneider, D. P., Treister, E., Hornschemeier, A. E., Garmire, G. P., 2004, AJ, 128, 2048
- Bertin & Arnouts (1996) Bertin, E., Arnouts, S., 1996, A&AS, 117, 393B
- Brandt & Hasinger (2005) Brandt W. N., Hasinger, G., 2005, ARA&A, 43, 827
- Brandt et al. (2001) Brandt, W. N., Alexander, D. M., Hornschemeier, A. E., et al., 2001, AJ, 122, 2810
- Capak et al. (2004) Capak, P., Cowie, L. L., Hu, E. M., et al., 2004, AJ, 127, 180
- Churazov et al. (2007) Churazov, E., Sunyaev, R., Revnivtsev, M., et al. 2007, A&A, 467, 529
- Comastri et al. (2002) Comastri, A., Mignoli, M., Ciliegi, P. et al., 2002, ApJ, 571, 771
- Cowie et al. (2004) Cowie, L. L., Barger, A. J., Hu, E. M., Capak, P., Songaila, A., 2004, AJ, 127, 3137
- Daddi et al. (2007) Daddi, E., Alexander, D.M., Dickinson, M. et al., 2007, ApJ, 670, 173
- Dickey & Lockman (1990) Dickey, J. M., Lockman, F. J., 1990, ARA&A, 28, 215
- Dickinson et al. (2003) Dickinson, M., Giavalisco, M., The Goods Team., 2003, in The Mass of Galaxies at Low and High Redshift, ed. R. Bender & A. Renzini, Springer-Verlag, 324
- Donley et al. (2007) Donley, J. L., Rieke, G. H., Pérez-González, P. G., Rigby, J. R., Alonso-Herrero, A., 2007, ApJ, 660, 167
- Efstathiou & Rowan-Robinson (1995) Efstathiou, A., Rowan-Robinson, M., 1995, MNRAS, 273, 649
- Efstathiou & Rowan-Robinson (2003) Efstathiou, A., Rowan-Robinson, M., 2003, MNRAS, 343, 322
- Efstathiou et al. (2000) Efstathiou, A., Rowan-Robinson, M., Siebenmorgen, R., 2000, MNRAS, 313, 734
- Elvis et al. (1994) Elvis, M., Wilkes, B.J., McDowell, J.C. et al. 1994, ApJS, 95, 1
- Fazio et al. (2004) Fazio, G. G., Hora, J. L., Allen, L. E., et al., 2004, ApJS, 154, 10
- Fiore (2008) Fiore, F., Grazian, A., Santini, P., 2008, ApJ, 672, 94
- La Franca et al. (2005) La Franca, F., Fiore, F., Comastri, A., et al. 2005, ApJ, 635, 864
- Frontera et al. (2007) Frontera, F., Orlandini, M., Landi, R., 2007, ApJ, 666, 86
- Georgakakis et al. (2003) Georgakakis, A., Georgantopoulos, I., Stewart, G. C., Shanks, T., Boyle, B. J., 2003, MNRAS, 344, 161
- Georgakakis et al. (2006) Georgakakis, A.E., Chavushyan, V., Plionis, M., Georgantopoulos, I., Koulouridis, E., Leonidaki, I., Mercado, A., 2006, MNRAS, 367, 1017
- Georgakakis et al. (2007) Georgakakis, A., Rowan-Robinson, M., Babbedge, T.S.R., Georgantopoulos, I., 2007, MNRAS, 377, 203
- Georgakakis et al. (2008) Georgakakis, A., Nandra, K., Yan, R. et al. 2008, MNRAS, (arXiv:astro-ph/08012160)
- Georgantopoulos & Georgakakis (2005) Georgantopoulos, I. & Georgakakis A., 2005, MNRAS, 358, 131
- Georgantopoulos, Georgakakis & Akylas (2007) Georgantopoulos, I., Georgakakis, A., Akylas, A., 2007, A&A, 466, 823
- Giacconi et al. (2002) Giacconi, R., Zirm, A., Wang, J., et al., 2002, ApJS, 139, 369
- Giavalisco et al. (2004) Giavalisco, M., et al., 2004, ApJ, 600, L93
- Gilli et al. (2007) Gilli, R., Comastri, A., Hasinger, G., 2007, A&A, 463, 79
- Gruber et al. (1999)
- Guainazzi et al. (2005) Guainazzi, M., Matt, G., Perola, G. C., 2005, A&A, 444, 119
- Hatziminaoglou et al. (2005) Hatziminaoglou, E., Perez-Fournon, I., Polletta, M., et al., 2005, AJ, 129, 1198
- Hornschemeier et al. (2003) Hornschemeier, A., Bauer, F., Alexander, D. M., et al., 2003, AJ, 126, 575
- Lacy et al. (2004) Lacy, M., Storrie-Lombardi, L. J., Sajina, A., et al., 2004, ApJS, 154, 166
- Maiolino & Rieke (1995) Maiolino, R., Rieke, G. H., 1995, ApJ, 454, 95
- Martínez-Sansigre et al. (2005) Martínez-Sansigre, A., Rawlings, S., Lacy, M., et al., 2005, Nature, 436, 666
- Mirabel & Sanders (1996) Mirabel, I.F., & Sanders, D.B., 1996, ARA&A, 34, 749
- Moran et al. (2002) Moran, E.C., Filippenko, A.V., Chornock, R., 2002, ApJ, 579, L71
- Nandra et al. (2002) Nandra, K., Mushotzky, R. F., Arnaud, K., et al., 2002, ApJ, 576, 625
- Panessa et al. (2006) Panessa, F., Bassani, L., Cappi, M., et al., 2006, A&A, 455, 173
- Polletta et al. (2006) Polletta, M., Wilkes, B. J., Siana, B., et al., 2006, ApJ, 642, 673
- Ranalli et al. (2003) Ranalli, P., Comastri, A., Setti, G., 2003, A&A, 399, 39
- Rieke et al. (2004) Rieke, G. H., Young, E. T., Engelbracht, C. W., et al., 2004, ApJS, 154, 25
- Risaliti et al. (1999) Risaliti, G., Maiolino, R., Salvati, M., 1999, ApJ, 522, 157
- Rovilos & Georgantopoulos (2007) Rovilos, M. & Georgantopoulos, I., 2007, A&A, 475, 115
- Rowan-Robinson (1995) Rowan-Robinson, M., 1995, MNRAS, 272, 737
- Rowan-Robinson et al. (2004) Rowan-Robinson, M. et al. 2004, MNRAS, 351, 1290
- Rowan-Robinson et al. (2005) Rowan-Robinson, M., Babbedge, T., Surace, J., et al., 2005, AJ, 129, 1183
- Severgnini et al. (2003) Severgnini, P., Caccianiga, A., Braito, V. et al. 2003, A&A, 406, 483
- Silva et al. (2004) Silva, L., Maiolino, R., Granato, G.L., 2004, MNRAS, 355, 973
- Stern et al. (2005) Stern, D., Eisenhardt, P., Gorjian, V., 2005, ApJ, 631, 163
- Tozzi et al. (2006) Tozzi, P., Gilli, R., Mainieri, V., et al., 2006, A&A, 451, 457
- Vanden Berk et al. (2001) Vanden Berk, D.E., et al. 2001, AJ, 122, 549
- Weedman et al. (2006) Weedman, D., Polletta, M., Lonsdale, C. J., et al., 2006, ApJ, 653, 101
- Werner et al. (2004) Werner, M. W., Roellig, T. L., Low, F. J., 2004, ApJS, 154, 1
- Wolf et al. (2003) Wolf, C., Wisotzki, L., Borch, A., Dye, S., Kleinheinrich, M., Meisenheimer, K., 2003, A&A, 408, 499