Strain relaxation in small adsorbate islands: O on W(110)
Abstract
The stress-induced lattice changes in a p() ordered oxygen layer on W(110) are measured by low-energy electron diffraction. We have observed that small oxygen islands show a mismatch with the underlying lattice. Our results indicate that along the average mismatch scales inversely with the island size as for all oxygen coverages up to 0.5 ML, while along it is significant only for the smallest oxygen islands and scales as a higher power of the inverse island size. The behaviour along is described by a one-dimensional finite-size Frenkel-Kontorova model. Using this model, together with calculated force constants, we make a quantitative estimate for the change of surface-stress upon oxygen adsorption. The result is consistent with our ab-initio calculations, which give a relative compressive stress of -4.72 N/m along and a minute relative tensile stress of 0.15 N/m along . The scaling along is qualitatively explained as an effect induced by the lattice relaxation in the direction.
pacs:
61.05.jh, 68.43.Bc, 68.35.GyI Introduction
Surfaces of solids present interesting phenomena owing to their reduced dimensionality and nontrivial symmetry, having the semi-infinite bulk on one side and vacuum on the other. From a simplified point of view, the charge freed up by the absence of the vacuum-side bonds has to be redistributed, resulting in major changes in the elastic,Ibach (1997) magnetic,sto and other thermodynamicsur properties of the surface as compared to the bulk. Often this results in structural modulations in order to minimize the energy and reduce the stress on the surface. On the other hand, adsorbates may induce similar effects, restructuring the surface at atomic or mesoscopic length scales.Ibach (1997); not (a) Our study is based on such observations, and aims at a better understanding of the elastic properties of adsorbate-covered crystal surfaces.
Determination of surface stress, which is central to understanding self-organization processes on crystal surfaces, has proven to be a challenge. Especially, the few studies that compare experiment and theory do not provide a systematic level of agreement. Two such comparisons are on the change of surface stress upon oxygen adsorption on Pt(111)Ibach (1997); Feibelman (1997) and Cu(100).Harrison et al. (2006); Prevot et al. (2006) In the first case, the calculation result is somewhat lower than the experimental one, whereas in the case of O/Cu(100) the theory exceeds the experimental results by a factor as large as 3. In a similar study, the calculation significantly underestimates the experiment on O/Ni(100).Hong et al. (2004) The uncertainties are attributed to the sensitivity to the boundary conditions in the setup and the macroscopic nature of the measurement in the crystal bending experiments, by far the most popular technique regarding adsorbate induced surface stress, and the lack of convergence in the density functional theory (DFT) calculations. Therefore, additional means of measuring surface stress are very important.
To this end, one could consider the lattice relaxations upon stress release at a boundary. Strain relaxation in finite-size objects is not surprising, as it is reasonable to expect that the boundaries (be it one-dimensional or two-dimensional) will assume a configuration minimizing the forces. Indeed, pioneering experimental studies regarding the change of the lattice constant of tiny three dimensional crystallites were done in the early 1950s,ber and somewhat later the connection of this observation to surface stress was established.ver In these studies the contraction of small spherical metal crystals was explained through the radial forces applied by the surface to the inner part of the particles, laying out the basis for understanding our experimental observations.
Regarding surfaces, there is a wide range of studies on elastic effects due to a variety of defects such as single atoms, atomic steps, and three dimensional adsorbate islands. Within the general framework, defects are modeled as local forces that induce long-range elastic relaxations on the surface and in the bulk (see Ref. Müller and Saúl, 2004 and references therein). The propagation of the displacements into the bulk has been demonstrated most notably by x-ray diffraction analysis.Croset et al. (2002) However, the relevant interactions are often confined to the most superficial layers, as in the case of O adsorbed on Pt(110)-(12).Helveg et al. (2007)
Following this argument, to a first approximation, an adsorbate island can be considered as a two-dimensional crystallite with a one-dimensional boundary. In the case of pseudomorphism, the adsorbate lattice locks on to that of the underlying crystal. However, for small monolayer islands, the stressed layer might be able to -at least partially- relax through its boundaries, and we can expect a mismatch between the adsorbate and the substrate. There is already experimental work pointing to such relaxations both on metals and on semiconductors, using real space imaging and diffraction techniques.Helveg et al. (2007); Massies and Grandjean (1993); Müller et al. (1995); Fassbender et al. (1995) On the theoretical side, recent simulations show deviations from pseudomorphic positions for small two-dimensional islands.Lysenko et al. (2002); Stepanyuk et al. (2001)
In this paper, we demonstrate that quantitative information on surface stress can be obtained by measuring such deviations from pseudomorphism as a function of the size of the monolayer adsorbate islands. We observe that small islands of oxygen on W(110) behave similarly to the cases mentioned above showing a mismatch to the underlying lattice, , depending on their size and the crystallographic direction within the surface plane. Taking advantage of the distinct low-energy electron diffraction (LEED) spots corresponding to the p() order, we follow the changes in the average lattice spacing as a function of the average domain size obtained from the spot widths. We find a mismatch scaling as the inverse island size, , in the direction, while it is dominated by quadratic and higher order terms, , along . The lattice mismatch is explained as a strain relaxation, and it is described in terms of a Frenkel-Kontorova model. From this model, using calculated force constants, we extract the surface stress value along .
Furthermore, we have performed density-functional theory (DFT) calculations in order to understand the nature of the oxygen induced surface stress change, obtained by modeling the observed strain relaxations in our measurements. While the early first-principles surface-stress calculationsNeeds (1987); Needs and Godfrey (1990) were mostly oriented towards the understanding of the microscopic origin of stress, some of the more recent onesFeibelman (1997); Hong et al. (2004); Harrison et al. (2006) are being directly compared to the experimental measurements of the surface stress change, with varying success. Our ab-initio result agrees well with the stress value estimated from our model of the measured lattice relaxations in the direction. In addition, the qualitatively different scaling of the lattice mismatch along can be understood from our calculation results, which show a lack of a significant stress change in this direction and a strain-stress coupling between the two orthogonal directions. The latter is expected to give rise to a -like scaling along , induced by the strain relaxation in .
The paper is organized as follows: section II describes the experimental setup and reports the LEED results on oxygen adsorption on W(110), section III presents the model of lattice relaxation as a balls-and-springs chain, and in section IV, we describe the ab-initio calculations. In section V, we present and compare results of our model and those of our DFT calculations along with a discussion involving the available experimental and theoretical work on W(110).
II Experiment
II.1 Setup
The micro-spot low energy electron diffraction (-LEED) measurements were performed with the SPELEEM microscope in operation at Elettra, Italy.Locatelli et al. (2006) The instrument combines a variety of techniques including -LEED and low energy electron microscopy (LEEM). The specimen is illuminated with an electron beam generated by a LaB6 gun (energy width of 0.6 eV), at a flux density of less than 10-2 nA/m2. In LEED operation mode, the microscope images the diffraction pattern produced by the sample at the back focal plane of the objective lens.Bauer (1994) The probed area on the surface is selected by inserting an aperture, which defines an incident electron beam of 2 m in diameter.
Prior to the -LEED measurements, a micro-region with a single mono-atomic W step was chosen using the LEEM mode, in order to avoid broadening of the diffraction peaks due to step bunches. The reciprocal space calibration and the measurement of the transfer width of the instrument were performed in such a region of the clean unreconstructed () W surface. We determined an instrument transfer width of about 110 Å at 30 eV electron energy.
The W(110) crystal was cleaned by annealing at 1000 C in mbar oxygen and subsequent high temperature flashes in ultrahigh vacuum to remove oxygen. The base pressure of the experimental chamber was mbar. During the high temperature flashes, the pressure remained below mbar. The sample was checked using LEEM and LEED in order to confirm the absence of tungsten carbides forming on the surface.
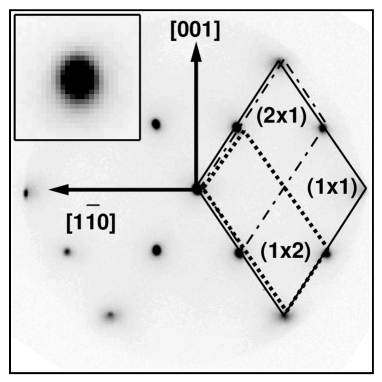
In order to form the adsorbed oxygen phases, molecular oxygen was dosed using a precision leak valve at a partial pressure of mbar as measured by an ion gauge. During the dosing, the LEED pattern was acquired every 20 sec, with the sample kept at 450 K. An electron energy of 30 eV was used for the diffraction measurements, corresponding to the intensity maximum of the half-order spots of the p() structure. For the oxygen pressure used, the best p() order was obtained upon exposure of about 4.5 Langmuirs, assigned to 0.5 ML oxygen coverage. The resulting LEED pattern is displayed in Fig. 1.
II.2 LEED Measurements
Adsorption of oxygen on W(110) has been thoroughly investigated in the past.Engel et al. (1975) It is well known that for coverages below 0.5 ML, oxygen can be found in islands of p(12) order, which evolves into p(22) and (11) reconstructions with increasing oxygen coverage.Johnson et al. (1993) In spite of the stress induced by the oxygen layer, the effective attractive interactions between the oxygen atoms manage to stabilize ordered islands even at very low oxygen coverages (note that effective interactions include attractive nearest-neighbour, repulsive next-nearest-neighbour of similar magnitude, and attractive but weaker third-nearest-neighbour interactionsWu et al. (1989)).
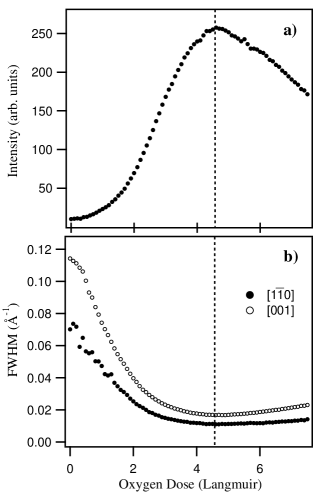
Fig. 2 shows the evolution of the intensity and width of the p() half-order spots during oxygen uptake at 450 K. In agreement with the literature, even at the lowest coverages we can identify diffuse p() spots, which grow in intensity and become sharper upon further exposure to oxygen. As seen in Fig. 2, the p() intensity maximum at 4.5 L corresponds to a minimum of the spot widths. Above this coverage, the p() domains break up due to additional oxygen atoms filling in the missing oxygen rows, which results in a slight broadening of the spots. Interestingly, the half-order spot width along is always smaller compared to that along roughly by a factor of , pointing to oxygen islands elongated in the direction. Beyond 0.5 ML, a weak p() order appears, developing very slowly due to the drop in the oxygen sticking coefficient with increasing coverage.Engel et al. (1975)
In the analysis of the half-order spot profiles, both Gaussian and Lorentzian fits were used in order to extract the full-width at half maximum (FWHM) values and the spot positions. A slowly varying background was subtracted as a low order polynomial. At high coverages, close to 0.5 ML, the peak shapes are predominantly Gaussian with a weak Lorentzian tail, whereas at the lowest coverages both fits gave equally good results. The Lorentzian tail at higher coverages is consistent with the results of Wu et al. pointing to a bimodal island-size distribution.Wu et al. (1989) Nevertheless, for simplicity we will consider only the mean value of the size distribution extracted from the width of the dominant Gaussian contribution.

Beyond the established behaviour of oxygen on W(110), we have observed a new effect manifested in the p() spot separations. Following the evolution of the oxygen unit cell as a function of oxygen coverage, we noticed deviations of the reciprocal space vectors from those expected from the underlying tungsten lattice. The mismatch of the oxygen p() unit cell to the tungsten lattice is displayed in Fig. 3. The fractional differences are plotted against the average domain size, which is obtained from the FWHM values plotted in Fig. 2b. The variations are larger for low oxygen coverages also corresponding to larger FWHM values of the half-order spots. We note that at low coverages the oxygen lattice expands along and shrinks along . The magnitude of the mismatch to the tungsten lattice is roughly an order of magnitude larger along , except at the lowest oxygen coverages for which the p() LEED spots are barely visible.
The power law dependence of the mismatch on the domain size is clear from the linear trend in the log-log plots in Fig. 3. The solid lines correspond to a fitting function of the kind:
| (1) |
where the left hand side corresponds to the measured average fractional mismatch of the oxygen lattice with respect to the W(110) surface. is the linear size of the oxygen island along the direction of interest, and and are the two parameters used to fit the data. The parameters resulting from the fit are displayed in Table 1.
| direction | A (Åp) | p |
|---|---|---|
As seen in Table 1, along the fractional lattice mismatch scales inversely with the linear dimension (). Along , instead, the inverse scaling power indicates a relaxation dominated by higher-order terms, i.e. with . Leaving the discussion to the following sections, here we limit ourselves to mention that this points to a qualitative difference in the driving force of the strain relaxation along the two directions. Apart from the scaling power, the particular value of the parameter carries more information specific to the adsorbate-substrate interactions, especially along , as we will show in the next section.
In Fig. 3b, we note that at Å (corresponding to an oxygen dose of 3 L and a coverage of 0.4 ML) the lattice along stops expanding, and starts shrinking. The likely origin of this abrupt change is an onset of “island percolation” or touching of the ordered islands.Engel et al. (1975) A kink is also present in Fig. 3a at Å corresponding roughly to the same coverage. However, the effect is more evident in Fig. 3b due to the small magnitude of the fractional mismatch along .
III Modeling Strain Relaxation
Assuming that lattice relaxation in finite-sized objects is limited to the boundaries, one would expect that the average lattice spacing should converge to a fixed value (to the bulk value for 3-dimensional crystals, or to the underlying lattice for a 2-dimensional pseudomorphic film), and that the difference from the bulk lattice should be inversely proportional to the object size. This statement is independent of the dimensionality, as the bulk divided by the boundary always gives the linear dimensions of the system. The idea can be formulated through a fractional mismatch:
| (2) |
where is the linear dimension along the direction under study, and is the lattice constant expected from an infinite object. One can safely assume that this simple scaling argument holds for larger objects. However, at the limit of a few atoms, this is not necessarily the case, as the interactions giving rise to stress may be modified due to finite size effects.Stepanyuk et al. (2001)
Keeping this in mind, we note that for O/W(110) the average relaxation along scales as all the way down to the smallest linear dimensions. Indeed, inverse scaling is represented by the solid line in Fig. 3a, which follows the experimental points throughout the full range of domain sizes. The expansion of the oxygen lattice along for the islands can be explained by the large compressive stress in this direction from our ab-initio calculation for the p() O/W(110) surface, as we will show in Section V. The oxygen layer is compressed to match the W lattice along , and at the boundary of islands it relaxes the compression by expanding.
The almost perfect inverse scaling in the measurements encourages one to extract quantitative information from the data using a simplified model. The information specific to the system under study is coded in the proportionality factor in Eq. 2, which we had termed as earlier in the experimental section. Having access to a single experimental coefficient, we will make a set of assumptions in order to reduce the number of parameters in the model problem:
-
i)
The displacements due to strain relaxation are assumed to be limited to the oxygen layer, with the tungsten atoms fixed.
-
ii)
direction is treated independently of .
-
iii)
The stress difference (across the island boundary) is assumed to be manifested as a point force at the island boundary within the surface plane.
The first assumption is a drastic one and is expected to introduce the largest errors in the quantitative prediction of the model. Previous structural studies assumed that the topmost tungsten layer preserves the atomic positions of the clean W(110) surface when covered with the (12)-O layer,Hove and Tong (1975); Ynzunza et al. (2000) pointing to a rigidity of the substrate which provides the basis of our assumption. However, the results of our DFT calculations, to be summarized in the next section, show that the W atomic positions are slightly modified upon oxygen adsorption both laterally and along the surface normal.
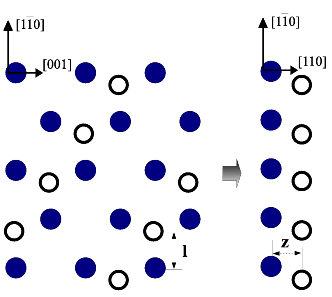
The second statement, on decoupling from , is valid due to the small magnitude of oxygen-induced surface stress change along . This assumption leads to a reduction (or projection) of the surface which can be understood from Fig. 4. The “W” and “O” atoms on the side view of the surface can be regarded as effective particles corresponding to a line of atoms along . The force constants (describing the interactions at the harmonic limit) along between these effective atoms are defined by infinitesimal movements of the corresponding line of atoms as a whole.
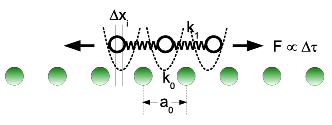
In the third assumption, we replace the net force distribution at the island boundary by a point force proportional to the surface stress difference between inside and outside the islands.Müller and Saúl (2004); Croset et al. (2002) The resulting model for the adsorbate island is shown in Fig. 5. The interactions between the oxygen atoms are sketched as springs, whereas the effect of the tungsten substrate on the oxygen atoms is shown as a periodic potential profile. Therefore, we have reduced the problem to that of a one-dimensional finite-size Frenkel-Kontorova chain.Braun and Kivshar (2004) Within such a model, only the nearest-neighbour interactions are considered. We will make an additional assumption accounting for all interactions going beyond the nearest-neighbours into an effective spring constant.
The relevant parameters in our model can be seen in Fig. 5. The substrate potential is defined by its period, , and a force constant, . The oxygen-oxygen bonds are modeled as springs, with an equilibrium length, , and a spring constant, . The relaxation of the oxygen-oxygen springs in the presence of the boundary is given by the distance of the oxygen atom to the adsorption site, which we denote as . Assuming harmonic interactions, the total energy of a ()-atom adsorbate chain is
where we have assumed symmetry around the center with the center atom fixed (). The positions in the ground state are found by setting the net force on each atom to zero ().
The fractional mismatch of the adsorbate chain to the substrate can be expressed as
| (4) |
where the length of the chain is . The second equality is due to symmetry. From a comparison of Eqs. 1 and 4, we see that . In words, the coefficient of the power law is directly related to the displacement of the boundary atoms.
Although the statement of the problem looks simple, a general analytical solution is surprisingly difficult to find. Instead, it is possible to approximate the solution for the mismatch
| (5) |
where is a function which can be evaluated numerically (see Appendix). It can be approximated as , where is a factor of the order of unity depending on the ratio of the force constants ( for ). is the net force on the boundary atom corresponding to the change in the stress across the boundary. The higher order terms on the right contribute only for very small island sizes, , above which they are negligible. As expected for a one-dimensional system, the unit of stress is that of force. The connection to the actual stress on the two-dimensional surface along the direction of the chain can be established by
| (6) |
where is the unit length (defined per atom) along the perpendicular direction, and is the change of the actual surface stress across the island boundary. We note that, in this model, and do not depend on , consistent with an experimental scaling of . Hence, corresponds to the macroscopic surface stress induced by the chain in the asymptotic limit (). Putting together Eqs. 5 and 6, we obtain the measured coefficient as
| (7) |
which in essence states that the movement of the boundary atom is proportional to the net force on it, and is inversely proportional to the steepness of the potential well in which the atom is sitting. Through this expression we have a means to relate the experimentally measured power law coefficient, , to the macroscopic surface stress.
In the next sections, we will combine the results of this model with those from our ab initio calculations. In particular, we will evaluate the microscopic force constants and from DFT calculations. We will then compare the resulting stress from Eq. 7 to the macroscopic surface stress obtained from the first-principles calculations.
IV Ab-initio calculations
We have performed DFT pseudopotential calculations in a plane-wave basis, using the PWSCF code.Baroni et al. The surface stress was calculated analytically on the basis of the expression derived by Nielsen and Martin,Nielsen and Martin (1983) based on the Hellmann-Feynman theorem, and following Ref. Needs, 1987. We utilized a symmetric slab with 13 layers to simulate the W surface and 15 layers for O/W, with 9 vacuum layers, both for relaxations and subsequent stress calculations. We used the local-density approximation (LDA) in the Perdew-Zunger parametrizationPerdew and Zunger (1981) for exchange and correlation, and employed Vanderbilt ultra-soft pseudopotentialsVanderbilt (1990) generated from the atomic configuration of oxygen and configuration of tungsten. The pseudopotential core-cutoff radii for O were: , a.u. and for W: , a.u. Our kinetic energy cutoff was 35 Ry for the wave functions and 350 Ry for the charge density. We used 326 k-points in the irreducible Brillouin zone. The forces were converged better than 1.7 mRy/Å.
As a prerequisite for the surface stress calculations, we relaxed the positions of the atoms in the W slab, keeping the central three layers fixed. Table 2 shows our results for the out-of-plane relaxations of the two topmost layers of a clean W slab together with the available data from the literature. The theoretical results of Arnold et al.Arnold et al. (1997) are for a 9-layer slab, calculated with an all-electron method using the LDA. Qian and HübnerQian and Hübner (1999), within the same method, used a 5-layer slab and the generalized gradient approximation for exchange and correlation. Similarly, Batirev et al.Batirev et al. (1998) applied a modified LAPW method with LDA to a 5-layer W slab. On the other hand, Ackland and FinnisAckland and Finnis (1986) utilized a semi-empirical model with parametrized energy functions. We note a good agreement between our results, experiment and the previous ab-initio calculation on a slab of sufficient size,Arnold et al. (1997) while the 5-layer slabs were too small and the semi-empirical modelAckland and Finnis (1986) gave rather poor result, in comparison with experiment.
| (%) | (%) | |
|---|---|---|
| our LDA result | ||
| Arnold et al.111Ref. Arnold et al.,1997 | ||
| Qian and Hübner222Ref. Qian and Hübner,1999 | ||
| Batirev at al.333Ref. Batirev et al.,1998 | ||
| Ackland and Finnis444Ref. Ackland and Finnis,1986 | ||
| experimenta |
| (Å) | ||||
|---|---|---|---|---|
| our result | ||||
| Załuskaet al.555Ref. Załuska-Kotur et al.,2001 | ||||
| experiment666Ref. Ynzunza et al.,2000 |
Similarly, we relaxed the atomic positions in the tungsten slab with adsorbed oxygen in the p()-reconstruction. Figure 4 gives top and side views of the p()-O/W(110) surface and defines the parameters and describing the position of the oxygen atom. The results of the calculation corresponding to these positional parameters are given in Table 3. There, the and displacements in the p() reconstruction are shown for the relaxed slab in reference to the calculated W bulk lattice constant, which is given in the first column. For comparison, the quantum-mechanical DFT calculation of Załuska-Kotur et al. using the atomic-cluster approach with only one O atom is also included in the table. As evidenced by the bulk lattice constant, the cluster method gives a considerably compressed structure. On the other hand, there is excellent agreement between our calculation and the experimental results based on LEED measurements,Ynzunza et al. (2000) especially regarding the W lattice constant and the lateral displacement of the oxygen atom. In terms of layer-spacings, the LEED I(V) analysisYnzunza et al. (2000) did not allow any out-of-plane movement of the substrate atoms upon oxygen adsorption, while our relaxed positions indicate a Å buckling of the outermost plane of W atoms, due to the oxygen atoms. This result is consistent with an original estimate of up to 0.05 Å for the out-of-plane displacement due to oxygen adsorption.Buccholz et al. (1974) Additionally, the O atom in our calculation is displaced in the direction by less than 0.05 Å, which was also not taken into account in the LEED model of Ref Ynzunza et al., 2000. We note that this rigid displacement of the whole adsorbate layer along is allowed as it does not violate any symmetry operation on the surface.
V Surface Stress and Lattice Relaxation
In order to get an estimate of along from the strain relaxation measurements using Eq. 7, we have evaluated the force constants from the ab-initio slab calculation described in the previous section by moving atoms infitesimally and following the change in energy. The parameter , which corresponds to the onsite potential profile felt by the oxygen atoms, was found to be eV/Å2 by sliding the oxygen layer rigidly over the surface.not (b) Similarly, the oxygen-oxygen force constant was obtained to be eV/Å2 by moving every other oxygen atom along and taking into account the additional energy increase due to the substrate potential (the total energy increase is proportional to ). The small value of with respect to is expected, as the weak oxygen-oxygen nearest-neighbour interactions are further reduced by the next-nearest-neighbour interaction of opposite sign and similar magnitude.Wu et al. (1989) Taking the unit length along as Å, and the measured coefficient Å, we obtain the oxygen induced change in the surface stress along to be N/m from Eq. 7.
We present our surface-stress results from ab-initio calculations on clean W(110) and on p()-O/W(110) in the first two columns in Table 4. The difference of the two, which is the oxygen induced surface stress change, is listed in the third column. The numerical uncertainty of the calculated LDA surface stress is estimated to be 0.36 N/m, on the basis of convergence checks in which we increased the energy cutoffs and the number of k-points. To check further our results, we calculated the surface stress from the total energy difference for two strains of magnitude 1.5 % and opposite signs (i. e. contraction and expansion of the lattice constant along []-direction), based on the energy expansion to the second order in the strain (see Refs. Barron and Klein, 1965 and Wu et al., 2007). By this method, we obtained a relative surface stress in the direction N/m, which agrees very well with our analytical result.
| direction | 777Ref. Sander et al., 1999 | ||||
|---|---|---|---|---|---|
| - |
The calculated surface stresses along and of the clean W(110) surface are both tensile. This is in qualitative agreement with the previous theoretical estimates.Batirev et al. (1998); Ackland and Finnis (1986) We note, however, that our surface stress values are larger than the average surface stress of 2.7 N/m obtained from a previous LDA calculation, in Ref. Batirev et al., 1998, for a 5-layer slab. Aside from having the correct atomic structure, stress values do converge much slower with the number of k-points than energies in the DFT calculations, and the long-ranged elastic relaxations bring forth the necessity for larger slabs, which is the motivation behind the rather thick slabs used in our calculations. The semi-empirical potential calculationsAckland and Finnis (1986) yield instead a surface stress of 2.4 N/m along and 0.3 N/m along , which differ significantly from the present ab initio results. Apart from the method, the difference also derives from the poor structural optimization obtained in the empirical potential approach. To the best of our knowledge, no experimental data are available for the clean W(110) surface stresses. However, experimental values do exist for a related quantity which contributes to the surface stresses: the surface energy.Needs (1987) Our calculated surface energy of 3.5 J/m2 is within the range of the available experimental data, 2.8 - 3.7 J/m2.Rod .
As for the oxygen induced change in the surface stress, the crystal-bending dataSander et al. (1999) have the same sign but differ considerably in magnitude from our result. As seen in Table 4, both our calculation and the crystal-bending measurement show that the relative stress is compressive along , while along the surface stress is affected negligibly upon oxygen adsorption. On the other hand, the surface stress change that we obtained by modeling the average lattice relaxation as a function of island size, N/m, agrees well with the value N/m from the calculation, especially considering the few parameters used in our model.
The reason for the remaining difference between the quantitative estimate from the model chain and the calculated stress is attributed mainly to the simplifications of the model itself. Most importantly, we have considered only the relaxations within the oxygen layer. As hinted by the modified tungsten atomic positions in the presence of oxygen, the relaxations in the adsorbate layer should continue into the tungsten surface, albeit with reduced magnitude. Thus, a more accurate model should take into account layer-resolved stresses, with the lattice in each layer (namely oxygen and the first layer tungsten) having a different power law behaviour (both with but each with a different coefficient, ). This, although possible, would require a more precise measurement and a detailed analysis of the LEED spot profiles.
A quantitative comparison between the ab-initio calculations and the crystal-bending results from Table 4 is less satisfactory, as the calculation is a factor four above the experimental value along . This, although discouraging, illustrates the problems in the surface stress studies. One problem noted in the mentioned experimental study is the adsorption of oxygen also on the back side of their crystal, which should result in a reduction of the measured stress by about 25 %.Sander et al. (1999) In addition, as suggested in the introduction, part of the reason for the difference between experiment and theory is to be sought in the macroscopic nature of the crystal-bending measurements, since the presence of domain boundaries relieves the stress on the adsorbate covered surface. Indeed, our LEED analysis shows that even at 0.5 ML oxygen coverage, which corresponds to the best p() order, the oxygen lattice is relaxed along by as much as 0.5 %. At room temperature, this relaxation should be more pronounced due to the smaller domain sizes. As a consequence, the surface stress in the adsorbed face of the crystal is lower than the value estimated from a calculation that considers a surface uniformly covered and free of defects. The surface quality of the crystal used in the experiments can also influence the results, as the surface stress would be reduced by the presence of defects such as steps or step-bunches. This problem was avoided in our -LEED measurements by choosing a region free of atomic steps.
Regarding the strain relaxation processes, we have demonstrated that the behaviour along is consistent with what is expected from a harmonic chain sitting on a periodic potential. However, along the situation presents a qualitative difference as the power (with which the relaxation scales inversely as a function of island size) is much larger than 1 throughout the full range of oxygen coverages. Additionally, the mismatch along is much smaller than that along except for the smallest island sizes (see Fig. 3). As we have noted earlier, these observations suggest that the lattice relaxation along is a consequence of the relaxation, yielding a higher-order effect in . Indeed, as seen in Table. 4, our calculations predict no noticeable difference between the clean and oxygen-covered W(110) surface stress in the direction. We suggest that the lattice change along is induced by the strain-relaxations taking place in the direction for small-sized islands. We find support for this explanation when we extend the calculation to a slab that is stretched slightly along in order to model the strain relaxation. In particular, we have performed a calculation for a slab stretched uniaxially by 1.5 % along . In this case, the difference in the surface stress with and without the oxygen on the surface was found to be N/m and N/m.str As expected, along the relative stress decreases as the compressed lattice relaxes upon stretching. On the other hand, along a tensile stress appears as the lattice is stretched in the orthogonal direction. This strain-stress coupling between the two directions is therefore believed to be the driving force of the lattice changes along .
A similar analysis as in Eq. 2 can give us more insight on the power law behaviour observed along . If the driving force is the relaxation along , the regions in which the contraction in occurs must be limited to what can be described as the “corners” of an island. It follows that there is an inverse relationship of the relaxation along with the island area,
| (8) |
The tendency of the strain relaxation, , to decay faster along compared to supports this argument. However, the difference between the measured inverse power (see Table 1) and the estimated inverse square relationship along is statistically significant. One issue that we have ignored in the discussion of the spot profiles and relaxations is related to the island size and shape distribution. In general the boundaries of oxygen islands do not run simply along and . STM studies of low oxygen coverages show a variety of island shapes possibly elongated in the directions.Johnson et al. (1993) However, from our two-dimensional LEED spot profiles, we were able to determine only a mean elongation along . In addition to the shape, the details of the island size distribution depend on the oxygen coverage.Wu et al. (1989) It is plausible that a coverage dependent change in the asymmetry of this distribution would modify the power law of the apparent (or mean) strain relaxation.
VI Conclusion
We have measured the lattice relaxations within oxygen islands on W(110) by low-energy electron diffraction. The half-order diffraction spots of the p() order within the oxygen covered regions allowed the observation of the mismatch to the substrate lattice as a function of the average island size. Along , the mean lattice mismatch was shown to scale as the inverse island size, , while along the scaling involved a higher power of the inverse island size. We analysed the inverse-scaling behaviour along through a finite-size balls-and-springs chain in order to make an estimate of the oxygen-induced surface stress change. The result is in fair agreement with our density-functional theory calculation. In addition, the calculations gave a small tensile stress along , which increased upon relaxing the compressive strain along . This provides support to our explanation that the qualitatively different behaviour in the direction is an effect induced by the lattice relaxation along .
We believe that, with a more sophisticated analysis of the integral order LEED spot profiles, the semi-quantitative strain-relaxation model described in this paper can be generalized to study the surface stress in a wide range of adsorbate systems and ultra-thin films.
*
Appendix A
The derivation of Eq. 5 follows from setting the net force on each atom to zero in the Frenkel-Kontorova chain. Setting (for ), we have,
| (9) | |||||
where is the net force due to the stress change on the boundary atom (), before the relaxations, , balance it. To find the displacements, we have to solve simultaneously these equations. Instead of tackling the difficult task of finding a general analytic solution, we can make the assumption that only a few atoms from the boundary are displaced significantly. The result has the form
| (10) |
where the last step defines the function .
Independently, we solve the problem numerically by moving the atoms recursively until
all the forces vanish. A comparison of Eq. 10 with the numerical
solution gives a good agreement when we allow displacement of upto four atoms
from the boundary. The average mismatch in Eq. 5 follows directly from
Eqs. 4 and 10.
Note added: During the refereeing process we became aware of an articleHarrison et al. (2008) reporting ab initio calculations of surface stress in a few adsorbate systems, including O/W(110). There is a good agreement of their surface-stress values with ours.
References
- Ibach (1997) H. Ibach, Surf. Sci. Rep. 29, 193 (1997).
- (2) Rh(100) is a good candidate as a magnetic surface of a nonmagnetic material. The discussion from the theoretical and experimental perspectives can be found in: N. Stojić, N. Binggeli, and M. Altarelli, Phys. Rev. B 73, 100405(R) (2006); A. Goldoni, A. Baraldi, M. Barnaba, G. Comelli, S. Lizzit, and G. Paolucci, Surf. Sci. 454-456, 925 (2000).
- (3) An example is surface melting. A pioneering experimental study can be found in J. W. M. Frenken, J. F. van der Veen, Phys. Rev. Lett. 54, 134 (1985).
- not (a) Formation of mesoscopic stress domains has been a topic of interest both theoretically and experimentally within the last two decades. For an early and descriptive study, see the work of O. L. Alerhand, D. Vanderbilt, R. D. Meade, and J. D. Joannopoulos, Phys. Rev. Lett. 61, 1973 (1988).
- Feibelman (1997) P. J. Feibelman, Phys. Rev. B 56, 2175 (1997).
- Harrison et al. (2006) M. J. Harrison, D. P. Woodruff, J. Robinson, D. Sander, W. Pan, and J. Kirschner, Phys. Rev. B 74, 165402 (2006).
- Prevot et al. (2006) G. Prévot, B. Croset, A. Coati, Y. Garreau, and Y. Girard, Phys. Rev. B 73, 205418 (2006).
- Hong et al. (2004) S. Hong, A. Kara, T. S. Rahman, R. Heid, and K. P. Bohnen, Phys. Rev. B 69, 195403 (2004).
- (9) F. W. C. Boswell, Proc. Roy. Soc. (London) A 64, 465 (1951); C. R. Berry, Phys. Rev. 88, 596 (1952).
- (10) J. S. Vermaak, C. W. Mays, and D. Kuhlmann-Wilsdorf, Surf. Sci. 12, 128 (1968); C. W. Mays, J. S. Vermaak, and D. Kuhlmann-Wilsdorf, Surf. Sci. 12, 134 (1968).
- Müller and Saúl (2004) P. Müller and A. Saúl, Surf. Sci. Rep. 54, 157 (2004).
- Croset et al. (2002) B. Croset, Y. Girard, G. Prévot, M. Sotto, Y. Garreau, R. Pinchaux, and M. Sauvage-Simkin, Phys. Rev. Lett. 88, 56103 (2002).
- Helveg et al. (2007) S. Helveg, W. X. Li, N. C. Bartelt, S. Horch, E. Lægsgaard, B. Hammer, and F. Besenbacher, Phys. Rev. Lett. 98, 115501 (2007).
- Massies and Grandjean (1993) J. Massies and N. Grandjean, Phys. Rev. Lett. 71, 1411 (1993).
- Müller et al. (1995) S. Müller, A. Kinne, M. Kottcke, R. Metzler, P. Bayer, L. Hammer, and K. Heinz, Phys. Rev. Lett. 75, 2859 (1995).
- Fassbender et al. (1995) J. Fassbender, U. May, B. Schirmer, R. M. Jungblut, B. Hillebrands, and G. Güntherodt, Phys. Rev. Lett. 75, 4476 (1995).
- Lysenko et al. (2002) O. V. Lysenko, V. S. Stepanyuk, W. Hergert, and J. Kirschner, Phys. Rev. Lett. 89, 126102 (2002).
- Stepanyuk et al. (2001) V. S. Stepanyuk, D. I. Bazhanov, W. Hergert, and J. Kirschner, Phys. Rev. B 63, 153406 (2001).
- Needs (1987) R. J. Needs, Phys. Rev. Lett. 58, 53 (1987).
- Needs and Godfrey (1990) R. J. Needs and M. J. Godfrey, Phys. Rev. B 42, 10933 (1990).
- Locatelli et al. (2006) A. Locatelli, L. Aballe, T. O. Menteş, M. Kiskinova, and E. Bauer, Surf. Interface Anal. 38, 1554 (2006).
- Bauer (1994) E. Bauer, Rep. Prog. Phys. 57, 895 (1994).
- Engel et al. (1975) T. Engel, H. Niehus, and E. Bauer, Surf. Sci. 52, 237 (1975).
- Johnson et al. (1993) K. E. Johnson, R. J. Wilson, and S.Chiang, Phys. Rev. Lett. 71, 1055 (1993).
- Wu et al. (1989) P. K. Wu, M. C. Tringides, and M. G. Lagally, Phys. Rev. B 39, 7595 (1989).
- Hove and Tong (1975) M. A. V. Hove and S. Y. Tong, Phys. Rev. Lett. 35, 1092 (1975).
- Ynzunza et al. (2000) R. X. Ynzunza, R. Denecke, F. J. Palomares, J. Morais, E. D. Tober, Z. Wang, F. J. G. de Abajo, J. Liesegang, Z. Hussain, M. A. V. Hove, et al., Surf. Sci. 459, 69 (2000).
- Braun and Kivshar (2004) O. M. Braun and Y. S. Kivshar, The Frenkel-Kontorova model: concepts, methods and applications (Springer, 2004).
- (29) S. Baroni, A. D. Corso, S. de Gironcoli, and P. Giannozzi, URL http://www.pwscf.org.
- Nielsen and Martin (1983) O. H. Nielsen and R. M. Martin, Phys. Rev. Lett. 50, 697 (1983).
- Perdew and Zunger (1981) J. P. Perdew and A. Zunger, Phys. Rev. B 23, 5048 (1981).
- Vanderbilt (1990) D. Vanderbilt, Phys. Rev. B 41, 7892 (1990).
- Arnold et al. (1997) M. Arnold, G. Hupfauer, P. Bayer, L. Hammer, K. Heinz, B. Kohler, and M. Scheffler, Surf. Sci. 382, 288 (1997).
- Qian and Hübner (1999) X. Qian and W. Hübner, Phys. Rev. B 60, 16192 (1999).
- Batirev et al. (1998) I. G. Batirev, W. Hergert, P. Rennert, V. S. Stepanyuk, T. Oguchi, A. A. Katsnelson, J. A. Leiro, and K. H. Lee, Surf. Sci. 417, 151 (1998).
- Ackland and Finnis (1986) G. J. Ackland and M. W. Finnis, Philos. Mag. A 54, 301 (1986).
- Załuska-Kotur et al. (2001) M. A. Załuska-Kotur, S. Krukowski, Z. Romanowski, and Ł. A. Turski, Phys. Rev. B 65, 045404 (2001).
- Buccholz et al. (1974) J. C. Buccholz, G.-C. Wang, and M. Lagally, Surf. Sci. 49, 508 (1974).
- not (b) We note that for the calculation of the force constants, we increased the kinetic energy cutoff to 50 Ry and the charge density cutoff to 500 Ry.
- Barron and Klein (1965) T. H. K. Barron and M. L. Klein, Proc. Phys. Soc. 85, 523 (1965).
- Wu et al. (2007) S. Q. Wu, Z. F. Hou, and Z. Z. Zhu, Solid State Comm. 143, 425 (2007).
- Sander et al. (1999) D. Sander, A. Enders, and J. Kirschner, Europhys. Lett. 45, 208 (1999).
- (43) A. M. Rodríguez, G. Bozzolo, and J. Ferrante, Surf. Sci. 289, 100 (1993); F. R. de Boer, R. Boom, W. C. M. Mattens, A. R. Miedema, and A. K. Niessen, Cohesion in Metals (North-Holland, Amsterdam, 1988).
- (44) Note that, for the stretched slab the calculated stress value has a large contribution from the bulk of the slab, which cancels out taking the difference between the two slabs with and without oxygen on the surface.
- Harrison et al. (2008) M. J. Harrison, D. P. Woodruff, and J. Robinson, Surf. Sci. 602, 226 (2008).