The role of the charge state of PAHs in ultraviolet extinction
Abstract
Aims. We explore the relation between the charge state of polycyclic aromatic hydrocarbons (PAHs) and the extinction curve morphology.
Methods. We fit extinction curves with a dust model including core–mantle spherical particles of mixed chemical composition (silicate core, and carbonaceous layers), and an additional molecular component. We use exact methods to calculate the extinction due to classical particles and accurate computed absorption spectra of PAHs in different charge states, for the contribution due to the molecular component, along five different lines of sight.
Results. A combination of classical dust particles and mixtures of real PAHs satisfactorily matches the observed interstellar extinction curves. Variations of the spectral properties of PAHs in different charge states produce changes consistent with the varying relative strengths of the bump and non–linear far–UV rise.
Key Words.:
(ISM:) dust, extinction — ISM: lines and bands — Ultraviolet: ISM1 Introduction
The nature of interstellar dust has implications for interstellar extinction, scattering of starlight, interstellar chemistry, the heating of diffuse clouds, the deposition of interstellar ices, and the dynamics of star formation.
Models of interstellar dust take into account a wide range of observational information that constrains the composition and size distribution (Draine 2003). This includes the pattern of elemental depletions, the variety of observed interstellar extinction curves, the distribution of the linear polarisation of starlight, the properties of scattered light, absorption and emission features, and broadband emission in the visible and infrared regions. All models involve a significant fraction of dust in the form of solid carbon, some of which may be in the form of crystalline graphite (Tielens 1997). Other forms of carbon have been given various names (amorphous, diamond-like, glassy and hydrogenated amorphous carbon, quasi-carbonaceous condensate, soot, yellow stuff…) yet these all seem manifestations of carbon in which particular valence long–range structures and physical/chemical properties (e.g., hydrogen content) are emphasised.
The strongest interstellar extinction feature is the broad absorption bump at 217.5 nm discovered by Stecher (1965), whose carrier is as yet unknown. It has been attributed to a plasmon resonance associated with transitions of electrons in graphite (Stecher & Donn 1965), despite some difficulties with this interpretation (e. g. Draine & Malhotra 1993). Others have tried to associate the bump with amorphous carbon (Mennella et al. 1998), although the peak and the width of the feature do not seem to be simultaneously well reproduced. It has also been suggested that defect sites at the surface of the silicate material could carry the feature (Steel & Duley 1987). The intensity of the bump is known to be unrelated to the far–UV rise of the interstellar extinction curve (ISEC, Greenberg & Chlewicki 1983), while its FWHM shows an extremely loose relation to the strength of the nonlinear far–UV curvature (Fitzpatrick & Massa 2007, henceforth FM07), although with an intrinsic scatter much greater than the observational errors.
Leaving aside specialised hypotheses, almost all the proposed carriers of the bump seem to require some form of aromatic carbon, either as size–restricted graphite pieces (Draine 1985) or as single or stacked Polycyclic Aromatic Hydrocarbons (PAHs) (Duley & Seahra 1998; Li & Draine 2001; Duley 2006). The possible quantitative relation between the bump and PAHs was suggested by Joblin et al. (1992), who compared laboratory spectra of mixtures of neutral PAHs and the mean galactic ISEC, showing them to be compatible in spectral shape. Subsequent papers (Malloci, Mulas & Joblin 2004; Malloci et al. 2005; Malloci, Joblin & Mulas 2007a) compared theoretical spectra of mixtures of PAHs in different charge states.
Recent models have a significant fraction of carbon in PAH molecules or clusters, described using approximate average properties (Weingartner & Draine 2001; Li & Draine 2001; Zubko, Dwek, & Arendt 2004). In this work we incorporate PAHs with their real extinction properties in the evolutionary model of interstellar dust proposed by Jones, Duley & Williams (1990). In the latter model, carbonaceous material is in the form of mantles on the surfaces of silicate cores, forming through deposition processes conceptually similar to the grain core and icy mantle model of dust grains in dark clouds. The core–mantle structure and chemical composition of dust particles result from the history of the environmental conditions they experienced, and responded to, so that the observed extinction along any line of sight is an integration of components at different stages of their evolution (Cecchi-Pestellini & Williams 1998). Different core–mantle models propose different accretion schemes for the carbonaceous mantles, either through the cyclic processing of ices (as in Li & Greenberg 1997) or through direct condensation (as here, following Jones, Duley & Williams 1990). Within such a framework, PAHs must also respond to the same environmental conditions, with chemical changes possibly related to observable effects.
We investigate the relation between the optical properties of PAHs in different ionisation states with the ISEC. We take advantage of the recent availability of state–of–the–art absorption spectra of PAHs in several charge states (Malloci, Joblin & Mulas 2007b), and the extinction cross–sections of classical core–mantle dust grains computed through an exact approach based on the multipole expansion of the electromagnetic fields (Borghese, Denti & Saija 2007). Synthetic extinction patterns are consistent with the observed properties of the carriers of the bump and of the non–linear far–UV rise. We propose a quantitative interpretation of the relative strengths of these features in terms of varying charge states of PAHs.
2 The model
While considerable uncertainty remains about the physical nature of interstellar dust, in particular its shape and morphology (e. g. Wright 1987), spectroscopic evidence and the depletion data show that silicates and carbons are important components of it. Silicates are predominantly amorphous but with a crystalline component (Li & Draine 2001). Carbons include both graphitic, , and polymeric, , valences (e. g. Jones, Duley & Williams 1990). They are mostly amorphous, with some evidence of the presence of crystalline graphite.
It is unclear whether the silicates and carbons form distinct populations of dust grains or are mixed within the same particles, since both hypotheses fit the ISEC. Chiar et al. (2006) showed that the excess polarisation in the 3.4 m aliphatic C—H stretch observed towards the galactic centre is much less than that of the 9.7 m silicate feature; they interpreted this to rule out that the two features could arise from the same population of dust particles. However, this conclusion is not necessarily valid if the two features arise from different parts of the same dust grain population, e.g., cores and mantles (Li & Greenberg 2002).
We use the extinction model of Cecchi-Pestellini & Williams (1998) and Iatì et al. (2008), i. e. a core + multiple mantle model, with dust grains composed of a silicate core and two carbon mantles. The deeper carbonaceous layer represents ”older”, UV processed material, and the surface layer ”freshly deposited” material. For the former we adopted the BE optical constants of Rouleau & Martin (1991, 1993), which are the most representative for amorphous carbon (see Cecchi-Pestellini et al. 1997, for a more detailed discussion); for we used the optical constants for polymeric carbon of Ashok, Varaprasad, & Birch (1991).
Following Cecchi-Pestellini & Williams (1998) and Iatì et al. (2008), the silicate cores are a population of small and large spherical grains with a power law size distribution , being the core radius. Silicate grains that are accumulating carbon mantles will all have the same thickness of mantle (Whittet 2002). This component is then completely determined by mantle thickness and fraction. The contribution of PAHs to extinction is represented in the Iatì et al. (2008) model by two Lorentz profiles, one for the transitions, accounting for the bump, the second for the plasmon resonance, whose low–energy tail contributes to the far–UV rise. Such a model reproduces the observed average ISEC with good accuracy, requiring an amount of carbon within the budget available in the interstellar medium (for more details see Iatì et al. 2008).
For a physical interpretation of the molecular component we exploit the database of spectral properties of PAHs computed by Malloci, Joblin & Mulas (2007b), including 50 molecules in the size range 10–66 C atoms, in the charge states 0, 1, and +2. For details see Malloci, Joblin & Mulas (2007b).
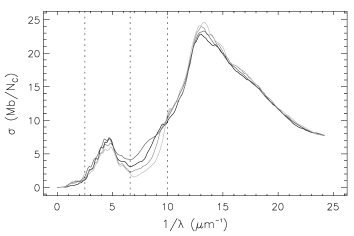
Figure 1 displays the weighted sums of the spectra in our sample, weighted with the inverse of the number of C atoms of each molecule. The two resonances corresponding to the bump and the far–UV rise overlap near , and their relative intensity varies with charge state, as does the depth of the minimum between them. This is systematic for each molecule and depends roughly on charge state and molecular size, yielding a 2–dimensional manifold. We show average values for clarity. In Table 1 we list, for each sum, the ratio between the integrated intensities of the bump and of the far–UV rise, and the cross–section per C atom at the minimum between them. This systematic behaviour hints that PAH charge state is linked to morphology properties of the observed ISECs, motivating this work: FM07 showed that the non–linear far–UV rise fluctuates widely in both strength and slope; our calculations suggest that their parametrisation of the ISECs is linked to the relative strength and position of the and resonances.
| Anions | Neutrals | Cations | Dications | |
|---|---|---|---|---|
| 0.89 | 0.92 | 1.01 | 1.23 | |
| 4.18 | 3.06 | 2.27 | 1.55 |
3 Results
We modelled five extinction curves taken from the sample of FM07, with ranging from 2.33 to 5.05, being the ratio of total to selective extinction. The fitting procedure provides two descriptions for the classical component. For those ISECs with , the parameter set exploited by Iatì et al. (2008) is appropriate, while for larger the derived grain distribution is significantly different: the small particle component is missing, large silicate cores have radii larger than 100 nm, and the index of the power–law size distribution has the standard value of 3.5. This could indicate depletion of small grains due to coagulation processes (Stepnik et al. 2003). This would produce a tail of very large particles in the size distribution, with a negligible effect on the modelled extinction, to which our fit is therefore insensitive. The abundances reported in Table 2 for the classical dust component do not include the possible contribution of this tail of large particles, and thus should be considered with some caution as lower limits. For the whole set of ISECs the total mantle thickness is 1.25 nm, while the fraction is almost constant between and . This large fraction is consistent with the short lifetime of the CH bond inferred by laboratory experiments on interstellar grain analogues (Mennella et al. 2001). The presence of a small fraction resulting from the fit, negligible for the extinction in the ISECs considered, is consistent with the physical evolutionary model. The full set of model parameters obtained from the fit are reported in Table 2.
| Parameter | HD | HD | NGC | HD | HD |
|---|---|---|---|---|---|
| 220057 | 197512 | 457 Pech13 | 147889 | 93222 | |
| AV | 0.56 | 0.71 | 1.58 | 4.44 | 2.17 |
| RV | 2.333 | 2.433 | 3.106 | 4.193 | 5.046 |
| 2.665 | 4.136 | 2.906 | 4.228 | 1.942 | |
| 0.374 | 0.500 | 0.256 | 0.525 | 0.250 | |
| (nm) | 1.25 | 1.25 | 1.25 | 1.25 | 1.25 |
| 0.93 | 0.94 | 0.96 | 0.96 | 0.98 | |
| (nm) | 5–12 | 5–12 | 5–12 | — | — |
| (nm) | 42–250 | 42–250 | 42–250 | 110–250 | 110–250 |
| MRN index | 3.531 | 3.531 | 3.531 | 3.5 | 3.5 |
| N/NH (ppM)⋄ | 43 | 37 | 57 | 14 | 12 |
| N/NH (ppM)⋄ | 36 | 31 | 47 | 11 | 10 |
| N ( cm-2) | |||||
| N/NH (ppM) | 42 | 107 | 55 | 173 | 168 |
| N/N | |||||
| N/N | |||||
| N/N | |||||
| N/N | |||||
| Charge/N | |||||
| N/NH (ppM)⋄ | 85 | 144 | 112 | 187 | 180 |
⋄Lower limits, since the possible presence of large dust is not included here, see text in Sect. 3.
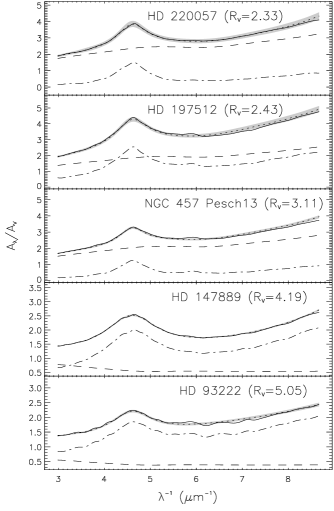
To isolate the effect of the molecular component, we subtract from each modelled ISEC the extinction due to the dust. We then fit the residual with a linear combination of computed cross–sections of PAHs. We adopt as free parameters the number of C atoms in each species, for a total of 200, with the physical constraint that they must all be positive. Finally, we sum the dust contribution with the best–fitting combination of PAH spectra to obtain the synthetic extinction curve to be compared with observations. As shown in Fig. 2, the fit to the observations is quantitatively excellent in all cases, in the whole spectral range: the synthetic curves are almost always within the 1 region, and never further than 2 from the observations.
From a geometric point of view, the hypersurface of this fit is a 200–dimensional paraboloid. Its vertex is the formal unconstrained solution, its curvature tensor is the inverse of the covariance matrix. The paraboloid is not “bowl shaped”, but more like a trough, narrow along a small number of directions and shallow (or even almost flat) in the others. This means that some linear combinations of the free parameters are strongly constrained by the fit, while others are almost free.
The most strongly constrained combination of parameters (i. e. the direction of largest principal curvature of the paraboloid) is proportional to the total number of C atoms N in all species, while the combinations that are almost free (i. e. the directions in which the paraboloid is flat) shuffle C atoms among species without changing the global charge of the mixture. This is consistent with the interpretation of the bump and far–UV non–linear rise in terms of global properties of the whole class of PAHs, rather than a feature associated with some individual molecule. To find out to what extent, quantitatively, charge, as a global property, is well–determined, we repeated the fit 20 times for each ISEC, each time perturbing it by white noise, proportionally to the errors reported by FM07. The total N, its fraction in each charge state and average charge were computed each time, yielding synthetic statistics stemming from the errors in the ISECs. Results are reported in Table 2 of the Appendix. The statistical standard deviations obtained show that these collective properties of PAHs are indeed well–defined by the fit, within the given assumptions. In Fig. 2 we also show the extinctions due to core–mantle grains. The curves present similar trends: classical dust grains provide an (approximately) linear baseline over which the contribution due to the molecular component lies. This is consistent with previous models incorporating PAHs (Li & Draine 2001; Weingartner & Draine 2001; Zubko, Dwek, & Arendt 2004). Since the contribution of the classical component is linear in the spectral region of the non–linear far–UV rise, this feature is entirely due to the molecular component.
4 Conclusions and future work
Figure 3 compares the ionisation fractions in Table 2 with the ratio between the (intensity of the non–linear far–UV rise) and (intensity of the bump) parameters of FM07. It is consistent with our ansatz that the charge state of PAHs is connected to the observed variations in the relative intensity of the two features, even if it is probably not the sole factor determining it. A detailed, systematic study will be needed to disentangle the relations between other specific properties of the PAH population and specific parameters of the ISECs.
This result is not strongly dependent on the model used to subtract the dust contribution to extinction: changing the parameters of the classical dust component has effects that are orthogonal to those brought about by the molecular component. For example, reasonable changes in the size cut–offs and in the index of the power–law size distribution only slightly modify the linear baseline on top of which the contribution of the molecular component lies (cf. Fig. 2).

The validity of the physical interpretation we propose relies on the two assumptions that (i) the PAH spectra we used may represent the real interstellar molecular component, and (ii) the cross–sections do not change in a major way between free–flying and clustered PAHs.
We include only fully hydrogenated, unsubstituted PAHs. Duley (2006) proposed completely dehydrogenated coronene as the carrier of the bump, emphasising that strongly dehydrogenated PAHs should display a plasmon resonance near the bump position. Hydrogenation is an additional degree of freedom that can respond to environmental conditions and possibly play a role, together with charge state, in describing the variations observed in the ISEC. Since very little is known about the UV spectra of dehydrogenated and substituted PAHs, more experimental and theoretical work is needed before this can be addressed.
The PAH spectra we used for the fit are known to slightly underestimate the energy of the transitions, similarly across the whole sample (Malloci, Mulas & Joblin 2004). This, together with the limited number of species used to represent the whole class of interstellar PAHs, produces a systematic error in the fit. This is more important for ISECs with a narrow bump, as this reduces the number of matching molecules and increases the effect of the misplacement of the transitions mentioned above. Using only half of the molecules at random, the difference between the best fit and the ISECs doubles, and absolute ionisation fractions change by up to about twice the statistical errors displayed in Table 2. These absolute values should therefore be considered with caution, even if some models indeed predict a significant population of PAH anions (Tielens 2005) in regions including the diffuse galactic ISM. Still, total N and the trends in Fig. 3 are instead almost unaffected by variations in the PAH sample used for the fit, since they are due to systematic variations of the PAH spectra. Reducing the number of species at random worsens the quality of the fits (i.e. the ) but still reproduces the variations in the ISECs considered; on the other hand, excluding charge states (e.g. considering only neutrals and cations) has a much more dramatic effect, i.e. it becomes impossible to satisfactorily match the observations.
As to point (ii), we assumed PAHs to be in free molecular form, whereas they could also be clustered (Duley & Seahra 1998; Rapacioli et al. 2006). Clusters of neutral PAHs are weakly bound systems in which the electron densities of individual units (and thus their absorption spectra) are not strongly perturbed. The effect of clustering may be more important in charged systems, but since this is poorly known it is impossible, at present, to consider it in more detail. Our estimation is that both clustering and a larger chemical variety would smooth out fine structure in the resonances, approaching, in the limit of large clusters, bulk optical properties. This would bring the absorption spectra of such improved mixtures of PAHs towards better agreement with observations. This will need to be confirmed by future calculations.
Mixtures of PAHs can accurately account for the UV bump and non–linear far–UV rise in extinction, and the PAH charge state is linked to the relative intensity of the two features. This provides a physical explanation and quantitative relationship of the 2–dimensional variations in ISECs described by FM07. In this framework, it is therefore not surprising that the bump and the non–linear far–UV rise appear to be unrelated from an observational point of view: this reflects the variations of the spectral properties of PAHs in different charge states.
Acknowledgements.
C. C.-P., G. M., G. M. acknowledge financial support by MIUR under project CyberSar, call 1575/2004 of PON 2000-2006. G. Malloci acknowledges financial support by Regione Autonoma della Sardegna. Part of the calculations used here have been performed using CINECA supercomputing resources. We thank the anonymous referee for her/his help in improving the manuscript.References
- Ashok, Varaprasad, & Birch (1991) Ashok J., Varaprasad P.L.H., & Birch 1991, in Palik E.D., ed., Handbook of Optical Constants of Solids II, Academic Press, New York, p. 957 Scattering by model nonspherical particles, Springer, Heidelberg
- Borghese, Denti & Saija (2007) Borghese F., Denti P., Saija R. 2007, Scattering by model nonspherical particles, Springer, Heidelberg
- Cecchi-Pestellini et al. (1997) Cecchi-Pestellini C., Colangeli L., Mennella V., Palumbo P., Rotundi A., & Bussoletti E., 1997, A&A, 325, 269
- Cecchi-Pestellini & Williams (1998) Cecchi-Pestellini C., & Williams D. A., 1998, MNRAS, 296, 414
- Chiar et al. (2006) Chiar J.E., Adamson A.J., Whittet D.C.B., Chrysostomou A., Hough J.H., Kerr T.H., Mason R.E., Roche P.F., & Wright G. 2006, ApJ, 651, 268
- Draine (1985) Draine B.T. 1985, ApJS, 57, 587
- Draine (2003) Draine B.T. 2003, ARA&A, 41, 241
- Draine & Malhotra (1993) Draine B.T., & Malhotra S. 1993, ApJ, 414, 632
- Duley (2006) Duley W.W. 2006, ApJ, 639, L59
- Duley & Seahra (1998) Duley W.W., & Seahra S. S. 1998, ApJ, 507, 874
- Fitzpatrick & Massa (2007) Fitzpatrick E.L., & Massa D. 2007, ApJ, 663, 320
- Greenberg & Chlewicki (1983) Greenberg J.M., & Chlewicki G. 1983, ApJ, 272, 563
- Iatì et al. (2008) Iatì M.A., Saija R., Borghese F., Denti P., Cecchi-Pestellini C., & Williams D.A. 2008, MNRAS, 384, 591
- Joblin et al. (1992) Joblin, C., Léger, A., & Martin, P. 1992, ApJ, 393, L79
- Jones, Duley & Williams (1990) Jones A. P., Duley W. W., & Williams D. A. 1990, QJRAS, 31, 567
- Li & Draine (2001) Li A., & Draine B. T. 2001, ApJ, 550, L213
- Li & Draine (2001) Li A., & Draine B. T. 2001, ApJ, 554, 778
- Li & Greenberg (1997) Li A., & Greenberg J.M. 1997, A&A, 323, 566
- Li & Greenberg (2002) Li A., & Greenberg J.M. 2002, ApJ, 577, 789
- Malloci, Mulas & Joblin (2004) Malloci G., Mulas G., & Joblin C. 2004, A&A, 426, 105
- Malloci et al. (2005) Malloci G., Mulas G., Cappellini G., Fiorentini V., & Porceddu I. 2005, A&A, 432, 585
- Malloci, Joblin & Mulas (2007a) Malloci G., Joblin C., & Mulas G. 2007, A&A, 462, 627
- Malloci, Joblin & Mulas (2007b) Malloci G., Joblin C., & Mulas G. 2007, Chem. Phys., 332, 353
- Mennella et al. (1998) Mennella V., Colangeli L., Bussoletti E., Palumbo P., & Rotundi A. 1998, ApJ, 507, L177
- Mennella et al. (2001) Mennella V., Muñoz Caro G.M., Ruiterkamp R., Schutte W.A., Greenberg J.M., Brucato J.R., Colangeli L. 2001, A&A, 367, 355
- Rapacioli et al. (2006) Rapacioli M., Calvo F., Joblin C., Parneix P., Toublanc D., & Spiegelman F. 2006, A&A, 460, 519
- Rouleau & Martin (1991) Rouleau F. & Martin P. G. 1991, ApJ, 377, 526
- Rouleau & Martin (1993) Rouleau F. & Martin P. G. 1993, ApJ, 414, 803
- Stecher (1965) Stecher T. P. 1965, ApJ, 142, 1683
- Stecher & Donn (1965) Stecher T. P., & Donn B. 1965, ApJ, 142, 1681
- Steel & Duley (1987) Steel T. M., & Duley W. W. 1987, ApJ, 315, 337
- Stepnik et al. (2003) Stepnik B., Abergel A., Bernard J.-P., Boulanger F., Cambrésy L., Giard M., Jones A. P., Lagache G., Lamarre J.-M., Meny C., Pajot F., Le Peintre F., Ristorcelli I., Serra G., & Torre J.-P. 2003, A&A, 398, 551
- Tielens (1997) Tielens A. G. G. M. 1997, Ap&SS, 251, 1
- Tielens (2005) Tielens A. G. G. M. 2005, The Physics and Chemistry of the Interstellar Medium (Cambridge: Cambridge University Press)
- Weingartner & Draine (2001) Weingartner J. C., & Draine B. T. 2001, ApJ, 548, 296
- Whittet (2002) Whittet D. C. B. 2002, Dust in the Galactic Environment, Institute of Physics Publishing, Bristol
- Wright (1987) Wright E. L. 1987, ApJ, 320, 818
- Zubko, Dwek, & Arendt (2004) Zubko V., Dwek E., & Arendt R. G. 2004, ApJ, 152, 211