11email: marcel.goossens@wis.kuleuven.be 22institutetext: Departament de Física, Universitat de les Illes Balears E-07122 Palma de Mallorca, Spain
22email: [inigo.arregui,dfsjlb0]@uib.es 33institutetext: Department of Physics, The Catholic University of America and NASA Goddard Space Flight Center, Code 671, Greenbelt, MD 20771, United States
33email: wangtj@helio.gsfc.nasa.gov
Analytic approximate seismology of transversely oscillating coronal loops
Abstract
Aims. We present an analytic approximate seismic inversion scheme for damped transverse coronal loop oscillations based on the thin tube and thin boundary approximation for computing the period and the damping time.
Methods. Asymptotic expressions for the period and damping rate are used to illustrate the process of seismological inversion in a simple and easy to follow manner. The inversion procedure is formulated in terms of two simple functions, which are given by simple closed expressions.
Results. The analytic seismic inversion shows that an infinite amount of 1-dimensional equilibrium models can reproduce the observed periods and damping times. It predicts a specific range of allowable values for the Alfvén travel time and lower bounds for the density contrast and the inhomogeneity length scale. When the results of the present analytic seismic inversion are compared with those of a previous numerical inversion, excellent agreement is found up to the point that the analytic seismic inversion emerges as a tool for validating results of numerical inversions. Actually it helped us to identify and correct inaccuracies in a previous numerical investigation.
Key Words.:
Magnetohydrodynamics (MHD) – Methods: analytical – Sun: corona – Sun: magnetic fields – Sun: oscillations1 Introduction
References to coronal seismology date back to the 1980s (Roberts et al. 1984) and even the 1970s (Uchida 1970), but coronal seismology remained largely a theoretical concept. This situation changed drastically when observations from space observatories showed that MHD waves are ubiquitous in the solar atmosphere. Opinions might differ, but we are inclined to identify the detection of damped transverse coronal loop oscillations in 1999 by Aschwanden et al. (1999) and Nakariakov et al. (1999) in observations made with the EUV telescope on board of the Transition Region and Coronal Explorer (TRACE) as the real start of coronal seismology. Since then the detection of these oscillations has been confirmed (see e.g. Schrijver et al. 2002). The TRACE oscillations have periods of the order of minutes and comparatively short damping times of the order of minutes. There is general consensus that the TRACE oscillations are fast standing kink mode oscillations. In addition, damped oscillations observed in hot coronal loops by the SUMER instrument on board SOHO have been interpreted as standing slow mode oscillations (Wang et al. 2002, 2003) and the measured period has been used to determine the magnetic field strength in the loop (Wang et al. 2007).
Theory shows that when the fast magneto-sonic kink MHD waves have their frequencies in the Alfvén continuum, they couple to local resonant Alfvén waves (Wright & Rickard 1995; Tirry & Goossens 1996; Goossens et al. 2006; Goossens 2008) and get transformed into quasi-modes that are damped by resonant absorption (Tirry & Goossens 1996). This is exactly what happens for a radially stratified cylindrical coronal loop model (Goossens et al. 2002; Ruderman & Roberts 2002). Coupling of the fast magneto-sonic MHD waves to local Alfvén waves is a natural phenomenon in non-uniform coronal loops. This resonant coupling produces a quasi-mode which in a static equilibrium is damped by resonant absorption. The damping is independent of the dissipative coefficients.
This finding does not mean that other damping mechanisms are ruled out. Resonant absorption might not be the only cause of the observed damping but it is definitely operational. Strong support for the robust character of quasi-modes and their resonant damping comes from a recent investigation by Terradas et al. (2008) on MHD waves in multi-stranded coronal loops. An important finding of this investigation is that resonantly damped quasi-modes live on complicated multi-stranded coronal loops. They do not need nice cylindrical magnetic surfaces as might be concluded from studies on simplified 1-dimensional equilibrium models. The message is that 1-dimensional models are a great help to reduce the mathematical complexity but still contain the essential physics of resonantly damped quasi-modes.
Ruderman & Roberts (2002) were the first to suggest that the observed rapid damping of the transverse oscillations of coronal loops could be explained by resonant absorption. In the context of the heating of solar plasmas Hollweg & Yang (1988) have predicted that oscillations in coronal loops are to undergo rapid damping. In the same context Goossens et al. (1992) derived analytical expressions for the frequency and the damping rate of quasi-modes in static and stationary equilibrium models. Ruderman & Roberts (2002) focused on proving the principle of resonant absorption as damping mechanism for the transverse oscillations in coronal loops and considered one specific numerical example. Goossens et al. (2002) looked at the damping times of 11 loop oscillation events and basically confirmed that resonant absorption can explain the observed damping as suggested by Ruderman & Roberts (2002).
The analytic expressions derived by Hollweg & Yang (1988); Goossens et al. (1992); Ruderman & Roberts (2002), and Goossens et al. (2002) for the damping rate are asymptotic in the sense that they are derived in the assumption that the non-uniform layer is thin. This is the so-called thin boundary approximation, in what follows we shall refer to it as the TB-approximation.
The seismological studies on transverse oscillations so far are by Nakariakov (2000); Nakariakov & Ofman (2001); Goossens et al. (2002); Aschwanden et al. (2003), and Arregui et al. (2007). Nakariakov (2000) and Nakariakov & Ofman (2001) used the observed periods and theoretical estimates of the periods based on the long wavelength or thin tube approximation (TT-approximation) for a uniform coronal loop model to derive estimates for the magnetic field strength. The weak link in their analysis is the uncertainties on the density. Goossens et al. (2002) used the observed damping rates and theoretical values of the damping rates based on the TB-approximation to derive estimates for the radial inhomogeneity length-scale. Again, the weak link is the uncertainties on the density. Aschwanden et al. (2003) used the observed damping rates and the damping rates computed by Van Doorsselaere et al. (2004), outside the TB-regime, to determine the density contrast. The first study that used the observational information on both periods and damping times in the context of resonant damping in a consistent manner is by Arregui et al. (2007).
The important finding of Arregui et al. (2007) was that an infinite amount of 1-dimensional cylindrical equilibrium models can reproduce the observed period and damping rate with the internal Alfvén transit time or conversely the internal Alfvén velocity confined to a short range. The study by Arregui et al. (2007) is fully numerical and apparently part of the physics has remained not well understood. The objective of the present paper is to use asymptotic expressions for the period and damping rate to illustrate in a simple and easy to follow manner the process of seismological inversion. The asymptotic expressions are the TT-approximation for the period and the TB-approximation for the damping rate. When both approximations are used simultaneously we shall refer to it as the TTTB-approximation. We are well aware of the fact that in case of strong damping this approximation might give inaccurate results. However, our primary intention is to understand the process of seismic inversion and as we shall see the asymptotic expressions turn out to be accurate far beyond their theoretical range of validity.
2 Asymptotic analytic expressions for period
The analytical expression that we shall use for the period is obtained by (i) adopting the TT-approximation for MHD waves and by (ii) modelling the coronal loop as a uniform cylinder with a straight magnetic field along the axis. The TT-approximation means that the period is independent of the radius and that effects due to non-zero radius are absent as far as the period is concerned. The choice of a uniform equilibrium model means that effects due to stratification are absent. The coronal loop is modelled as a cylindrical plasma with constant density embedded in an external plasma with constant density . The coronal loop is basically a density enhancement with . The magnetic field is constant and has the same strength both inside and outside the loop.
Our starting point is the well-known expression for the square of the frequency of the kink mode in a uniform cylinder with a straight magnetic field along the axis (see e.g. Edwin & Roberts 1983)
| (1) |
The subscripts i and e refer to quantities respectively in the coronal loop and in the external plasma surrounding the loop. is the local Alfvén frequency, with the parallel wavenumber, the local Alfvén velocity, and the magnetic field strength. Hence we can rewrite Eq. (1) as
| (2) |
with the density contrast. Now we note that for the observed transverse oscillations, with a wavelength double the length of the loop, and we convert frequencies to periods and rewrite Eq. (2) as (see e.g. Arregui et al. 2008)
| (3) |
Here is the internal Alfvén travel time and the function is defined as
| (4) |
Equation (3) is our first key equation. Let us recall that Eq. (3) has been obtained by use of the TT-approximation, hence effects from non-zero radius and stratification are absent. This equation expresses the period , which is an observable quantity, in terms of the Alfvén travel time and the density contrast which are two quantities that we aim to determine from seismic inversion. If we have observed values of the period and we convince ourselves that Eq. (3) is a good first analytical approximation of the period then we can invert it for either or . Actually, we shall do both. Let us first solve Eq. (3) for . Since we prefer to use dimensionless quantities we introduce as
| (5) |
From Eq. (3) we obtain
| (6) |
Since we have not any information on , it might appear that Eq. (6) is not very helpful. However, closer inspection reveals that it contains very valuable information. For a given observed period , Eq. (6) is a parametric representation of (or equivalently of ) in terms of . In order to stress this point we define the function by use of the right hand member of Eq. (6) as
| (7) |
For later comparison in Sect. 4 we note that and . Hence is a strictly increasing and concave function of . We also note that
This means that
| (8) |
According to inequality (8) the Alfvén travel time is constrained to a narrow range; whatever the density contrast is, the Alfvén travel time is in between and . If we accept that the density contrast is not smaller than say 1.5 then is replaced with narrowing further down the range for .
If we are able to determine the length of the loop, then we can extract and find
| (9) |
Hence, here is the narrow range for the local Alfvén velocity that Arregui et al. (2007) found in their numerical inversion. If the density contrast is not smaller than 1.5, is replaced with further reducing the available range for to less than a 25 relative margin compared to its possible maximal value.
With the help of the first line of inequality (8) we can refine the definition of and replace (7) with
| (10) |
Let us now solve Eq. (3) for and find
| (11) |
Equation (11) is the twin of Eq. (6). For a given observed period , Eq. (11) is a parametric representation of in terms of (or equivalently in terms of ). In order to stress this point we define the function by use of the right hand member of Eq. (11) as
| (12) |
Since and , it follows that is a strictly increasing and convex function of . Note now that
With this information on the function we can refine its definition (12). Combined with the definition (10) of we obtain the following prescriptions for the functions and ;
| (13) |
Let us recapitulate what seismic information we have deduced from the observed value of the period. The quantities and are in the following intervals
| (14) |
and are related to one another by
| (15) |
The functions and are defined by expressions (13). Of course, is the inverse function of : and conversely . When the period is known from observations, then there are infinitely many pairs that reproduce the observed period. We can let vary over the interval and compute for each value of the corresponding value of , or conversely, let vary over the interval and compute for each value of the corresponding value of .
3 Asymptotic analytic expressions for damping time
In order for the kink MHD waves to be damped by resonant absorption additional physics has to be introduced in the equilibrium model. The required additional physics is non-uniformity of the local Alfvén velocity. For a constant magnetic field this implies a non-uniform density. Asymptotic expressions for the damping time have been derived by e.g. Hollweg & Yang (1988), Goossens et al. (1992) and Ruderman & Roberts (2002). These asymptotic expressions are derived in the approximation that the non-uniform layer is thin. The true density discontinuity is replaced by a continuous variation in density. Jump conditions are used to connect the solution over the ideal singularity and to avoid solving the non-ideal MHD wave equations. The jump condition for the ideal Alfvén singularity was introduced on an intuitive manner by Hollweg & Yang (1988) and put on a firm mathematical basis by Sakurai et al. (1991), Goossens et al. (1995) and Goossens & Ruderman (1995) for the driven problem, and by Tirry & Goossens (1996) for the eigenvalue problem. The result of this asymptotic analysis is
| (16) |
Here and are the period and the damping time, is the internal density on the axis of the loop and hence in the interval ; is the constant external density where external refers to , is the thickness of the non-uniform layer; corresponds to a uniform loop and a discontinuous variation in the density at the radius of the loop. A fully non-uniform loop has but cannot be studied by an approximate TB expression for the damping time. The numerical factor depends on the variation in density across the non-uniform layer. For a linear variation as used by Goossens et al. (1992) . Ruderman & Roberts (2002) used a sinusoidal variation in density across the non-uniform layer and found . In what follows we shall adopt . A sinusoidal variation in density in the non-uniform transitional layer is probably closer to reality than a linear variation. In addition we shall compare our analytic results with numerical results for fully non-uniform 1-dimensional models of coronal loops obtained by Van Doorsselaere et al. (2004) and by Arregui et al. (2007) by the use of the eigenvalue code LEDA originally designed by Van der Linden (1991). In these studies a sinusoidal variation in density was considered. Note also that in Eq. (16) the period is computed using the TT-approximation.
Rewrite Eq. (16) in terms of to find
| (17) |
Equation (17) is the second key equation of the present investigation. Let us now look at this equation from a seismic point of view. If we have observed values of the period and the damping time and we convince ourselves that Eq. (17) is a good first analytical approximation of the damping time divided by period then we can invert Eq. (17) for either or . Actually we shall do both. Let us first solve Eq. (17) for and find
| (18) |
From a seismic point of view, period and damping time can be considered as known from observations and it makes sense to denote as a constant . In addition it is convenient to abbreviate as . Hence
| (19) |
Equation (18) can be rewritten as
| (20) |
Here are several observations to be made. First, since it follows from Eq. (20) that for a given ratio of there is a lower bound for the inhomogeneity length scale
| (21) |
Second, realize that Eq. (20) is a parametric representation of in terms of . In order to make this point very explicit, we introduce the function defined as
| (22) |
It is easy to show that and . Hence is a strictly decreasing and convex function of . It attains its absolute minimum for . This minimal value is
| (23) |
Conversely attains its maximal value of infinity in the limit . With this information on the function we can refine its definition (22) as follows
| (24) |
With the minimal value (23) for we can slightly improve on the lower bound for and for given by inequality (8) and on the upper bound for given by inequality (9). These bounds were found with the sole use of the information on the periods. If we also use the information on the damping rate then we obtain
| (25) |
With the help of the information on the bounds for and we can refine the definitions (13) for and respectively to their final versions
| (26) | |||||
Let us now solve Eq. (17) for and find
| (27) |
Equation (27) is a parametric representation of in terms of . As before we make this point explicit by introducing the function defined as
| (28) |
It is easy to show that and , hence is a strictly decreasing and convex function of . In addition
With this information on the function we can refine its definition (28). Combined with the definition (24) for the function we obtain
| (29) |
Here is the inverse function of ; and conversely is the inverse function of .
| Loop | R | L | R/L | T | ||||||
|---|---|---|---|---|---|---|---|---|---|---|
| (106 m) | (108 m) | (10-2) | (s) | (s) | (s) | (s) | (km s-1) | |||
| 1 | 3.60 | 1.68 | 2.13 | 261 | 870 | 0.30 | 137 (143)–185 | 145–177 | 947–1161 | |
| 2 | 3.35 | 0.72 | 4.65 | 265 | 300 | 0.88 | 150–187 | 163–182 | 396–443 | |
| 3 | 4.15 | 1.74 | 2.37 | 316 | 500 | 0.63 | 173–224 | 189–217 | 801–922 | |
| 4 | 3.95 | 2.04 | 1.94 | 277 | 400 | 0.69 | 153–196 | 168–189 | 1079–1211 | |
| 5 | 3.65 | 1.62 | 2.26 | 272 | 849 | 0.32 | 143 (150)–192 | 151–187 | 869–1073 | |
| 6 | 8.40 | 3.90 | 2.17 | 522 | 1200 | 0.44 | 279 (286)–369 | 304–359 | 1088–1284 | |
| 7 | 3.50 | 2.58 | 1.37 | 435 | 600 | 0.73 | 241–308 | 267–299 | 862–967 | |
| 8 | 3.15 | 1.66 | 1.88 | 143 | 200 | 0.72 | 79–101 | 90–98 | 1693–1853 | |
| 9 | 4.60 | 4.06 | 1.15 | 423 | 800 | 0.53 | 229 (232)–299 | 247–291 | 1394–1643 | |
| 10 | 3.45 | 1.92 | 1.78 | 185 | 200 | 0.93 | 105–131 | 117–126 | 1526–1643 | |
| 11 | 7.90 | 1.46 | 5.38 | 390 | 400 | 0.98 | 227–280 | 245–270 | 541–595 |
4 Analytical seismology and comparison with numerical inversion
Let us recapitulate the key results of the previous section. The two quantities that we assume to be known from observations are the period and the damping time . Analytical theory based on the TTTB-approximation gives us two equations, namely Eqs. (3) and (17) that express the period and the damping time in terms of the density contrast , the Alfvén transit time (normalised to the period) and the inhomogeneity length scale (normalised to the radius of the loop) . These three quantities and are the seismic quantities in the sense that they are the quantities that we aim to determine with the use of observed values of the period and the damping time . Since we have only two equations that relate the three unknown quantities to the two observed quantities there are an infinite number of solutions of the seismic inversion problem, such as first pointed out by Arregui et al. (2007). The seismic variables are constrained to the following intervals
| (30) |
and are related to one another by
| (31) |
Of the four functions only two are independent since is the inverse function of and is the inverse function of . The set (31) gives us the infinitely many solutions of the seismic inversion in parametric form. Each of the three unknowns can be used as parameter and the two remaining unknowns can be expressed in terms of that parameter. For example choose as parameter. Let take on all values in and compute the corresponding values of and by the use of and . Or choose as parameter. Let take on all values in and then compute the corresponding values of and by the use of and Finally, use as parameter to define the solutions of the inversion problem. Let take on all values in and then compute the corresponding values of and by the use of and .
As an illustrative example we re-analyse loop oscillation event # 5 examined by Arregui et al. (2007) in detail using their numerical seismic inversion scheme. The results of the investigation of that loop event are shown on their Figure 3a. For this loop oscillation event and . The radius and the length of this loop are estimated to be and respectively. The ratio of the radius to the length of the loop is This small value is good news for the TT-approximation to the period with effects due to a non-zero radius on period being small.
The constant = = . Hence and . The intervals for are now
| (32) |
The corresponding interval for is
If we limit the analysis to then the lower bound is so that
This can be compared with the interval in Fig 3a of Arregui et al. (2007) which is (see also their Table 1)
It is encouraging to note that the overall differences on the Alfvén travel times found here are about although the loop oscillation event is characterised by heavy damping. It is intriguing that the interval as a whole is shifted by about to shorter Alfvén travel times. This intriguing discrepancy has led us to calculate analytical results for the allowable range of the Alfvén travel time for the remaining 10 loops and to compare them with those obtained by Arregui et al. (2007). It turned out that in all cases there are discrepancies and some of them were far bigger than 10. This has motivated us to re-examine the numerical results of the investigation of Arregui et al. (2007). It turns out that the values given in Arregui et al. (2007) are inaccurate. We have re-calculated the numerical values for the Alfvén travel time intervals in Arregui et al. (2007) and present them in Table 1. When this issue is taken into account, the corrected numerical interval for the event under consideration is
which remarkably agrees with the analytic interval. Table 1 shows that analytic and numerical Alfvén travel time intervals agree very well for all events. Analytic lower bounds for are a little below numerical ones. Note that analytic lower bounds for given in (30) can be slightly lower or larger than the numerical . When lower, values in parentheses give the analytic for this density contrast. Upper bounds correspond to the limit , which is nearly approximated at the numerical . We have also calculated for the events studied by Arregui et al. (2007) and the results agree well with the corresponding values of in their Table 1.
| 0.105 | 67.67 | 0.702 |
|---|---|---|
| 0.110 | 26.32 | 0.694 |
| 0.120 | 12.30 | 0.680 |
| 0.125 | 9.85 | 0.674 |
| 0.150 | 5.24 | 0.648 |
| 0.175 | 3.79 | 0.629 |
| 0.200 | 3.08 | 0.617 |
| 0.225 | 2.66 | 0.603 |
| 0.250 | 2.38 | 0.593 |
| 0.275 | 2.18 | 0.585 |
| 0.300 | 2.03 | 0.579 |
| 0.325 | 1.91 | 0.573 |
| 0.350 | 1.82 | 0.568 |
| 0.375 | 1.75 | 0.564 |
| 0.400 | 1.68 | 0.560 |
| 0.425 | 1.63 | 0.557 |
| 0.450 | 1.59 | 0.554 |
| 0.475 | 1.55 | 0.551 |
| 0.500 | 1.51 | 0.549 |
| 0.525 | 1.48 | 0.546 |
As an illustration that any of the three seismic quantities can be used as parameter we take as the parameter. We let vary and compute for each value of the corresponding value of by the use of the function defined in (29),
| (33) |
Subsequently we compute the corresponding value of by the use of the function defined in (26),
| (34) |
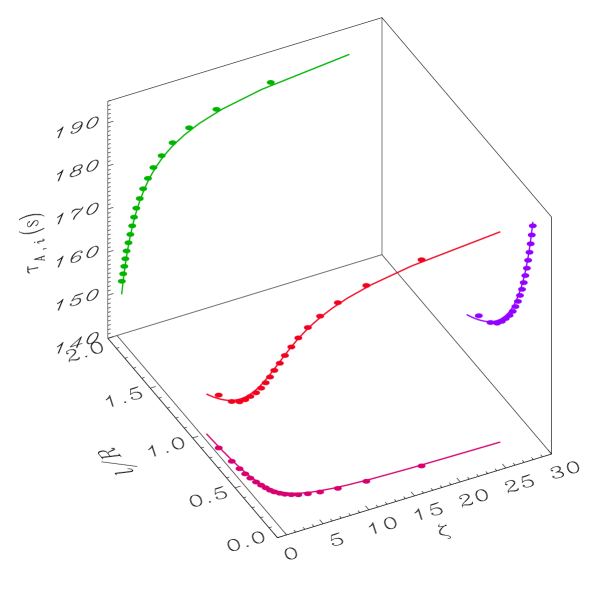
Of course, we can only compute and for discrete values of . The results of our computations are summarised on Table 2 and graphically represented on Fig. 1. Recall that the functions (see eqs. [26] and [29]) are monotonically increasing () or monotonically decreasing () and have concave graphs () and convex graphs () respectively. This implies f.e. that is a strictly increasing function of and a strictly decreasing function of and conversely that is a strictly decreasing function of both and . Inspection of the second order derivative of a given quantity with respect to one of the two remaining quantities can tell us that the graph is either concave or convex. For example the graphs of and of as function of are respectively concave and convex. The monotonic variation of and the concave or convex appearance of their graphs predicted by our analytic seismic inversion agrees exactly with the behaviour of the numerical inversion. Furthermore, Fig. 1 displays an amazing quantitative agreement between analytic and numerical inversion results.
We have not re-analysed in detail loop oscillation event # 10 that was examined by Arregui et al. (2007). The inversion for that loop event is shown on their Figure 3b. A striking property of the solutions is the non-monotonic behaviour of the seismic variables. This is clearly reflected in the pronounced minimum of as function of and as function of . The decreasing part of as function of and the increasing part of as function of cannot be recovered by the analytical seismic inversion scheme based on the TTTB-approximation. The analytical TTTB-approximation predicts monotonic variation of the seismic variables and cannot approximate multi-valued solutions with two pairs of ) corresponding to the same value of . The fact that the analytical seismic inversion fails for this loop oscillation event is not disturbing since this event is characterised by extremely heavy damping with which we anticipated would fall out of the application range of the analytical scheme anyway.
5 Conclusion
In this paper we have presented an analytic approximate seismic inversion scheme based on the TTTB-approximation for computing the period and the damping time. In the TTTB-approximation the period is computed for a uniform loop model in the long wavelength or zero radius approximation. The damping time is computed for relatively weak damping corresponding to thin non-uniform layers. The advantage of this analytical seismic inversion is that it is formulated with the aid of two functions and (and their inverse functions and ) which are given by simple closed expressions. The practical implementation of the inversion scheme is stunningly simple. The calculations required to obtain solutions can even done with the use of a hand calculator. This analytical scheme seismic inversion clearly shows that the inversion problem has infinitely solutions in the -space as first pointed out by Arregui et al. (2007). It also reveals that the allowable values of (or Alfvén travel time) are confined to a narrow range. When applied to a loop oscillation event with heavy damping as f.e. loop oscillation event # 5 with the analytic inversion scheme produces remarkably accurate results. Not only does it recover the overall appearance of the solution curve with the corresponding monotonic behaviour of the seismic variables. In addition, it recovers for a prescribed range of values of the corresponding values of (or ) and (or ).
The disadvantage of the scheme is that (i) it does not take into account the effects of non-zero radius and of radial stratification on the period; (ii) it is strictly speaking only valid for weak damping corresponding to thin non-uniform layers. Corrections due to finite tube radius are of the order of the loop radius to length ratio squared. For the largest observed value of in Table 1 the correction is of the order of , hence the thin tube approximation does not impose any practical restriction on the applicability of analytical results. As for the thin boundary approximation, for cases with extremely heavy damping, the non-monotonic behaviour displayed by numerical solutions cannot be recovered. This is the price for an analytical scheme. All in all, the accuracy of the results obtained with this analytic inversion is amazing. The final agreement of the analytic seismic inversion with the numerical seismic inversion when the inaccuracies of the numerical inversion are removed is excellent up to the point that the analytic seismic inversion emerges as a tool for validating results of numerical inversions.
Acknowledgements.
This research was begun when MG was a visitor of the Solar Physics Group at the UIB. It is pleasure for MG to acknowledge the warm hospitality of the Solar Physics Group at the UIB and the visiting position from the UIB. MG also acknowledges the FWO-Vlaanderen for awarding him a sabbatical leave. IA and JLB acknowledge the funding provided under projects AYA2006-07637 (Spanish MEC) and PRIB-2004-10145 and PCTIB2005GC3-03 (Government of the Balearic Islands). TJW’s work was supported by NRL grant N00173-06-1-G033.References
- Arregui et al. (2007) Arregui, I., Andries, J., Van Doorsselaere, T., Goossens, M., & Poedts, S. 2007, A&A, 463, 333
- Arregui et al. (2008) Arregui, I., Ballester, J. L., & Goossens, M. 2008, ApJ, 676, L77
- Aschwanden et al. (1999) Aschwanden, M. J., Fletcher, L., Schrijver, C. J., & Alexander, D. 1999, ApJ, 520, 880
- Aschwanden et al. (2003) Aschwanden, M. J., Nightingale, R. W., Andries, J., Goossens, M., & Van Doorsselaere, T. 2003, ApJ, 598, 1375
- Edwin & Roberts (1983) Edwin, P. M. & Roberts, B. 1983, Sol. Phys., 88, 179
- Goossens (2008) Goossens, M. 2008, in Proceedings IAU Symposium No. 247, ed. R. Erdelyi & C. Mendoza
- Goossens et al. (2006) Goossens, M., Andries, J., & Arregui, I. 2006, Royal Society of London Philosophical Transactions Series A, 364, 433
- Goossens et al. (2002) Goossens, M., Andries, J., & Aschwanden, M. J. 2002, A&A, 394, L39
- Goossens et al. (1992) Goossens, M., Hollweg, J. V., & Sakurai, T. 1992, Sol. Phys., 138, 233
- Goossens & Ruderman (1995) Goossens, M. & Ruderman, M. S. 1995, Physica Scripta Volume T, 60, 171
- Goossens et al. (1995) Goossens, M., Ruderman, M. S., & Hollweg, J. V. 1995, Sol. Phys., 157, 75
- Hollweg & Yang (1988) Hollweg, J. V. & Yang, G. 1988, J. Geophys. Res., 93, 5423
- Nakariakov (2000) Nakariakov, V. M. 2000, in American Institute of Physics Conference Series, Vol. 537, Waves in Dusty, Solar, and Space Plasmas, ed. F. Verheest, M. Goossens, M. A. Hellberg, & R. Bharuthram, 264
- Nakariakov & Ofman (2001) Nakariakov, V. M. & Ofman, L. 2001, A&A, 372, L53
- Nakariakov et al. (1999) Nakariakov, V. M., Ofman, L., DeLuca, E. E., Roberts, B., & Davila, J. M. 1999, Science, 285, 862
- Roberts et al. (1984) Roberts, B., Edwin, P. M., & Benz, A. O. 1984, ApJ, 279, 857
- Ruderman & Roberts (2002) Ruderman, M. S. & Roberts, B. 2002, ApJ, 577, 475
- Sakurai et al. (1991) Sakurai, T., Goossens, M., & Hollweg, J. V. 1991, Sol. Phys., 133, 227
- Schrijver et al. (2002) Schrijver, C. J., Aschwanden, M. J., & Title, A. M. 2002, Sol. Phys., 206, 69
- Terradas et al. (2008) Terradas, J., Arregui, I., Oliver, R., et al. 2008, ApJ, accepted
- Tirry & Goossens (1996) Tirry, W. J. & Goossens, M. 1996, ApJ, 471, 501
- Uchida (1970) Uchida, Y. 1970, PASJ, 22, 341
- Van der Linden (1991) Van der Linden, R. A. M. 1991, PhD thesis, K. U. Leuven
- Van Doorsselaere et al. (2004) Van Doorsselaere, T., Andries, J., Poedts, S., & Goossens, M. 2004, ApJ, 606, 1223
- Wang et al. (2007) Wang, T. J., Innes, D. E., & Qiu, J. 2007, ApJ, 656, 598
- Wang et al. (2002) Wang, T. J., Solanki, S. K., Curdt, W., Innes, D. E., & Dammasch, I. E. 2002, ApJ, 574, L101
- Wang et al. (2003) Wang, T. J., Solanki, S. K., Curdt, W., et al. 2003, A&A, 406, 1105
- Wright & Rickard (1995) Wright, A. N. & Rickard, G. J. 1995, ApJ, 444, 458