HST ACS OBSERVATIONS OF STAR FORMATION DRIVEN OUTFLOWS IN NEARBY EDGE-ON SPIRAL GALAXIES: DEPENDENCE OF HALO MORPHOLOGY ON STAR FORMATION ACTIVITY11affiliation: Based on observations made with the NASA/ESA Hubble Space Telescope, obtained at the Space Telescope Science Institute, which is operated by the Association of Universities for Research in Astronomy, Inc., under NASA contract NAS 5-26555. These observations are associated with proposal 10416.
Abstract
We present new high spatial resolution narrowband imaging observations of extraplanar diffuse ionized gas (eDIG) in four late-type, actively star forming edge-on spirals, obtained with ACS on-board HST. Our F658N (H) observations reveal a multitude of structures on both small and large scales. Whereas all four galaxies have been studied with ground-based telescopes before, here the small scale structure of the extended emission line gas is presented for the first time at a spatial resolution of 005, corresponding to 5.0 pc at the mean distance to the target galaxies. The eDIG morphology is very different for all four targets, probably as a result of their different levels of star formation activity. We find that the morphology of the eDIG, in particular the break-up of diffuse emission into filaments in galaxy halos, shows a strong dependence on the level of star formation activity per unit area, and eDIG can be arranged into a morphological sequence. The eDIG is resolved into an intricate morphology of individual filaments for NGC 4700 and NGC 7090. The ionized gas in the latter galaxy, being the one with the lowest SF activity per unit area in our sample, reveals besides some filaments many prominent bubbles and superbubbles. NGC 4634 and NGC 5775 have instead a more diffuse layer of eDIG. The latter two galaxies have the highest SF rate per unit area in our sample and the observed morphology suggests that the break-up of the smooth eDIG layer into individual resolved filaments occurs only above a certain threshold of SF activity per unit area. We note that this is not a distance effect, as NGC 4634 and NGC 4700 are roughly at the same distance, yet reveal very different eDIG morphology. Combined with ground-based data for samples that span a larger range of galaxy mass our results indicate that the gravitational potential also plays an important role in the eDIG morphology. In low-mass galaxies the gas can be expelled due to shallow gravitational potentials more easily and couple with strong star formation driven outflows on a local scale. This is in contrast to the more massive galaxies, which show smooth eDIG layers, unless they are powered by a superwind, as in the case of nucleated starburst galaxies. The simplistic chimney scenario is not confirmed from our observations, and future models need to take into account the detailed physics of feedback, star formation and magnetic fields.
Subject headings:
galaxies: evolution — galaxies: halo — galaxies: ISM — galaxies: spiral — galaxies: structure1. INTRODUCTION
During the last decade considerable progress in our understanding of the diffuse ionized gas (DIG) in halos of late-type spiral galaxies has been achieved. The occurrence of DIG outside of classical H ii regions is firmly believed to be correlated with the star formation activity in the galaxy disk.
The fractional contribution of DIG to the total H emission in galaxies reaches typically values of 25-50% (e.g., Walterbos & Braun, 1994; Ferguson et al., 1996; Lehnert & Heckman, 1995), and DIG is thus an important constituent of the interstellar medium (ISM). Recent studies with a larger sample of galaxies from the SINGG survey revealed even slightly higher fractions of (Oey et al., 2007).
In the theoretical picture the gas, most likely driven by collective supernovae, is expelled into the halos of the galaxies. Norman & Ikeuchi (1989) developed a theoretical model in which the hot gas is transported from the star forming regions in the disk via chimneys into the halo, provided the superbubbles created from SNe fulfill the breakout criterion. Depending on the strength of the gravitational potential the gas may fall back onto the galactic disk, which is described as the galactic fountain scenario (Shapiro & Field, 1976; Bregman, 1980; de Avillez, 2000). Starburst driven mass loss, at least for dwarf galaxies with shallower potential wells, can be an effective process, as the gas can escape more easily in these systems (Mac Low & Ferrara, 1999).
Several ground-based narrowband imaging investigations have been undertaken during the past fifteen years with a boost of investigations occuring in the last decade, to study the morphology of DIG in halos of non-starburst quiescent spiral galaxies (Dettmar, 1990; Rand et al., 1990, 1992; Pildis et al., 1994; Rand, 1996; Hoopes et al., 1999; Collins et al., 2000; Rossa & Dettmar, 2000, 2003b; Miller & Veilleux, 2003). Not all of the studied galaxies revealed extraplanar DIG (eDIG), but it was shown that extraplanar DIG is a relatively common feature among actively star forming galaxies, and about 41 % of a survey of 74 galaxies have eDIG detections. The most active ones were found to possess a bright gaseous halo (Rossa & Dettmar, 2003a). Correlations of eDIG with other constituents of the ISM exist, such as radio-continuum halos (e.g., Dahlem et al., 1994; Tüllmann et al., 2000; Dahlem et al., 2006), the hot ionized medium (i.e. halos), traced by X-ray observations (Strickland et al., 2004; Tüllmann et al., 2006), and dust filaments in the disk-halo interface (Howk & Savage, 1997, 1999, 2000; Rossa & Dettmar, 2003b; Rossa et al., 2004; Thompson et al., 2004). Starburst galaxies and low luminosity Seyfert galaxies have been investigated as well with regard to the diffuse emission (Lehnert & Heckman, 1995) and (Robitaille et al., 2007), respectively.
In general, the spiral galaxies with very high SFR per unit area show a pervasive DIG layer (i.e. a halo) with a typical vertical extent of 2 kpc. Individual filaments, occasionally reaching distances of up to 6 kpc, are superimposed in a few cases as well (Rossa & Dettmar, 2003b). As there is a variety of morphological features generally discernible even with low spatial resolution ground-based studies (e.g., filaments, plumes, bubbles, shells), clearly the need for a more magnified view onto the individual SF regions and DIG filaments in edge-on spirals is needed to study the small scale structure and to identify the connection points between the filaments and their origin within the SF regions in the midplane. Only very few previous high spatial resolution investigations were targeted to address these questions (e.g., Cecil et al., 2001, 2002; Rossa et al., 2004). For a more thorough overview on the DIG topic in general and on phenomena related to these star formation driven gaseous outflows we refer to the older, but still quite relevant, review articles by Dettmar (1992); Dahlem (1997) and also to the more recent review on galactic winds by Veilleux et al. (2005).
In this study we present high spatial resolution narrowband H images of four actively star forming galaxies, observed with HST/ACS to unravel the morphology of the gaseous outflows on both small and large scales as a function of star formation activity, These data are augmented by broad-band HST/ACS images, whose primary purpose was to serve for the continuum subtraction. However, they are also used to study the distribution of dust filaments in the disk-halo interface.
The paper is structured in the following way. In § 2 we describe how the current HST/ACS sample was selected, and in § 3 we present the observations and observing strategy. In § 4 we describe briefly the data reduction techniques and analysis of the images. In § 5 the results are presented, and in § 6 we discuss the results. In § 7 we finally summarize our basic results and state our conclusions.
2. THE EDGE-ON GALAXY SAMPLE
The small edge-on galaxy sample presented here is a sub-sample of four galaxies from our previous H survey (Rossa & Dettmar, 2000, 2003a, 2003b). The basic properties of these galaxies are listed in Table 1. The galaxies were selected to be observed with HST/ACS, because they have very different levels of energy input into their disk ISM (expressed as and listed with other properties in Table 3). All four targets have eDIG detections (Rossa & Dettmar, 2000, 2003a, 2003b), but ground-based imagery suggests different halo morphologies that can be further studied at the highest possible resolution only by means of HST/ACS H imagery. Galaxies with different energy input rates were chosen to study a possible dependence of the halo morphology on the level of star formation in the underlying disks. Naively, one might expect galaxies with energy input levels near the threshold for the creation of halos (see Figure 1) to exhibit only individual, possibly filamentary extraplanar structures. On the other hand, galaxies with widespread, high-level star formation are expected to have a multitude of filaments, if they are associated with individual sites of star formation in the underlying disks.
We avoided galaxies with prominent dust lanes and those at low Galactic latitudes so as to have low foreground opacities for studies of the optical emission line gas.
We note here that two galaxies in the present sub-sample, NGC 4634 and NGC 5775, have close interaction partners (within two Holmberg radii), while the remaining two, NGC 4700 and NGC 7090, don’t.
3. OBSERVATIONS AND OBSERVING STRATEGY
The observations of the four actively star forming spirals were carried out between June 23 and August 21 2005 with the Advanced Camera for Surveys (ACS) onboard HST (GO#10416; PI: J. Rossa). All observations were carried out using the Wide Field Channel (WFC), which yields a field of view. This is achieved by employing two SITe 20484096 pixel CCDs with a pixel scale of 005 per pixel. For more details we refer to the ACS instrument handbook (Gonzaga et al., 2005). The narrowband observations using the F658N filter were acquired in three HST orbits for each galaxy, and the broadband images (to be used for continuum subtraction and to study the dust morphology in the galaxies) were obtained with the F625W filter in one HST orbit each. In total, 16 HST orbits were allocated to obtain deep continuum subtracted H images of the four target galaxies. The observational details, including observation dates, integration times, and filter characteristics, are listed in Table 2.
The individual exposures were taken in dither mode, to allow for good cosmic ray removal and to fill in the CCD gaps. We have used a different dither pattern for the broadband and narrowband observations. For the narrowband (F658N) observations we have used a 3-point dither pattern with a 4-point sub-pattern, spread over three HST orbits for each galaxy. The broadband (F625W) observations were obtained in a 2-point dither with a 2-point sub-pattern. The first pattern in each configuration applies a jump over the CCD gaps, and the secondary pattern is applied to allow for good cosmic ray and hot pixel removal.
4. DATA REDUCTION AND ANALYSIS
4.1. Data reduction
The HST/ACS data were calibrated using the CALACS and Multidrizzle packages. The former removes the various instrumental signatures, including bias correction and flat-fielding. The latter is used to correct for the geometric distortion of the ACS camera and also performs cosmic ray rejection and finally combines the images, obtained in the specific dither pattern. For further details we refer to the ACS data handbook (Pavlovsky et al., 2005) and to Koekemoer et al. (2005) for a description of multidrizzle.
There are a few detector artifacts visible at very low intensities. Among them are some faint stripes along CCD columns visible across the images. These are charge transfer trails of hot pixels, cosmic rays, and other sources. However, these CTE losses are well defined features, which are located at a constant position, and whose pattern is repeated with a constant distance and position angle. On very faint levels, when viewing the entire frame in low resolution on a computer screen, effects of cross talk are discovered. They have their origin in the four CCD quadrants corresponding to the four amplifiers of the detector array. The features though look somewhat different from the usual cross talk features seen in Giavalisco (2004). The features in our images are not inverted in intensity and thus can easily be mistaken for faint diffuse emission. However, the distance and position angle of this feature in the continuum subtracted H image of NGC 4634 mimics the shape of the galaxy at a very faint level, and its endpoint coincides with the one end of the galaxy, at a position that has an offset and inverted position. As an almost identical feature was detected in the image of NGC 5775 as well, which looked very reminiscent, we conclude, that this is indeed related to the detector, and not a real feature of the diffuse emission. At higher contrast the structure resolves and is barely visible at all.
4.2. Calibration and Analysis of the Broadband Imagery
The broadband (F625W) images of our target galaxies were obtained for two purposes. The primary aim was to subtract the continuum from the on-band (F658N) images, which contain some continuum flux. Secondly, they allow a detailed comparison of extraplanar dust features with the DIG morphology, which are best seen in unsharp-masked versions of the broadband images. These two physically distinct ISM phases (see Howk & Savage, 2000) can be studied in detail to search for possible correlations between the two extraplanar ISM constituents on small scales. To enhance the contrast between the dust structures and the background light from the galaxy more easily, we have constructed unsharp-masked versions of our broadband F625W (SDSS ) images. These were obtained by dividing the F625W images by a smoothed version of the same images. The latter ones were created by using a Gaussian filtering technique with a kernel size adopted to account for the difference in distance among the sample galaxies.
4.3. Calibration and Analysis of the Narrowband Imagery
In order to calibrate the narrowband images the broadband and narrowband images were first aligned by measuring the positions of stars in the field of view. After alignment the shifted broadband images were checked by blinking them on a computer screen against the narrowband images. In order to obtain a continuum-free H image, we scaled and subtracted each combined broadband F625W image from the respective narrowband F658N image. This was done in a similar fashion as it was applied in our previous studies (e.g., Rossa & Dettmar, 2000; Rossa et al., 2004). The use of individual foreground stars instead proved difficult, as there were only limited suitable stars in the given aperture visible. More importantly, they also showed too much color variation so that the scaling factor could not be determined very accurately. Therefore, we chose selected reference regions within the galaxy that were not affected by emission. For this purpose we closely compared the F625W and F658N images to determine suitable regions within the disk, and also relied on previous ground-based images.
Several of the continuum subtracted images show black-white point source pairs which are due to slight imperfections in alignment and differences in the PSF. However, they do not affect our discussion and understanding of the extended emission. Due to the given FWHM of the used narrowband filter, it should be noted that emission from the adjacent [N II] doublet is included in the F658N filter passband. For simplicity, however, we refer for the remainder of the paper to an H image, whenever we speak of a continuum subtracted F658N filter image.
5. RESULTS
In this section we describe in detail the morphology of the four edge-on spirals as revealed from both the broadband and narrowband images. Specifically, we describe the DIG morphology visible in the emission line images. We also comment on the dust features visible in the broadband images and on a newly detected dwarf irregular galaxy in the halo of NGC 4634.
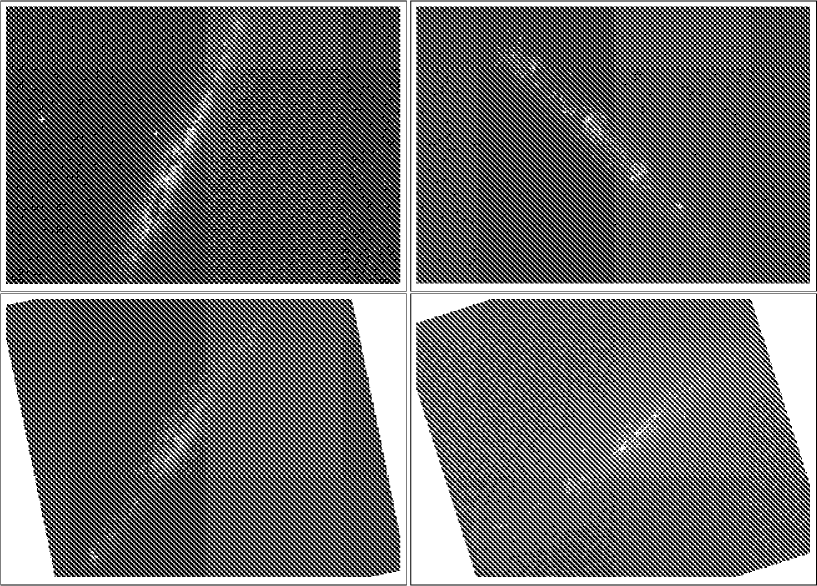
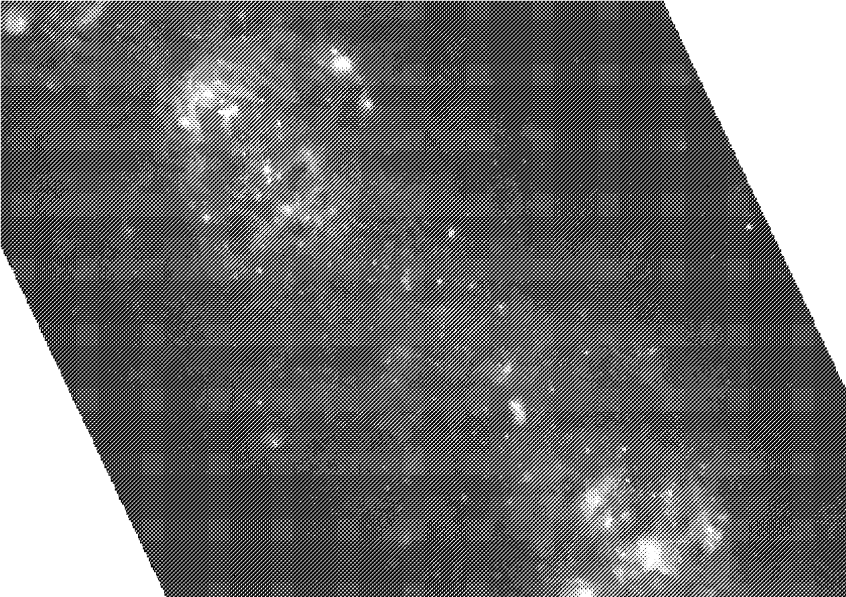
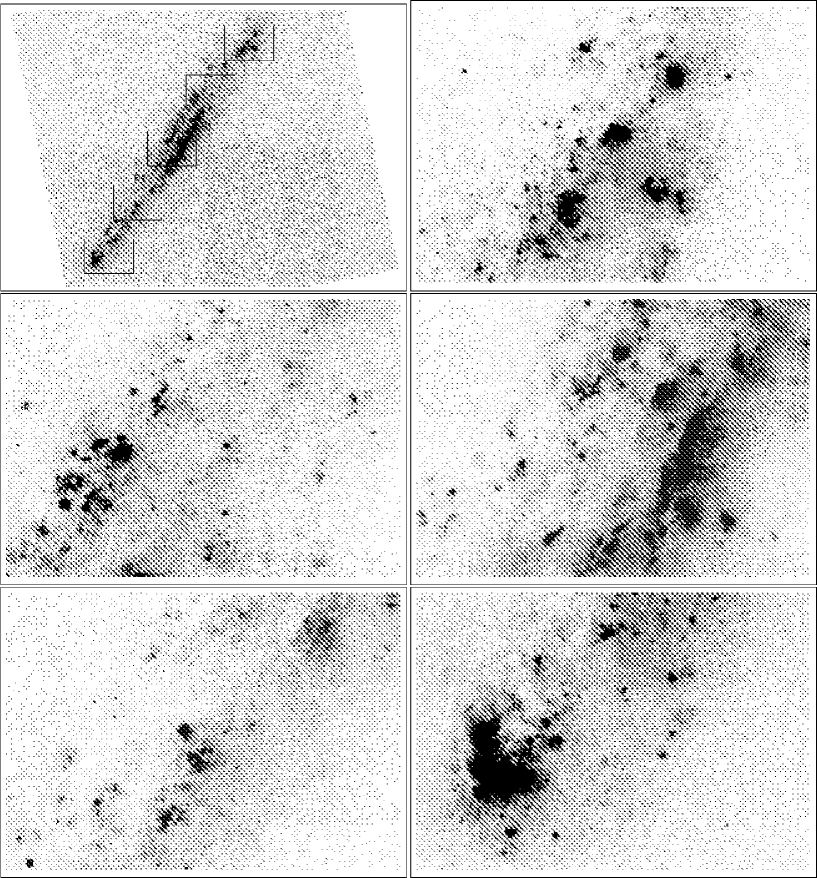
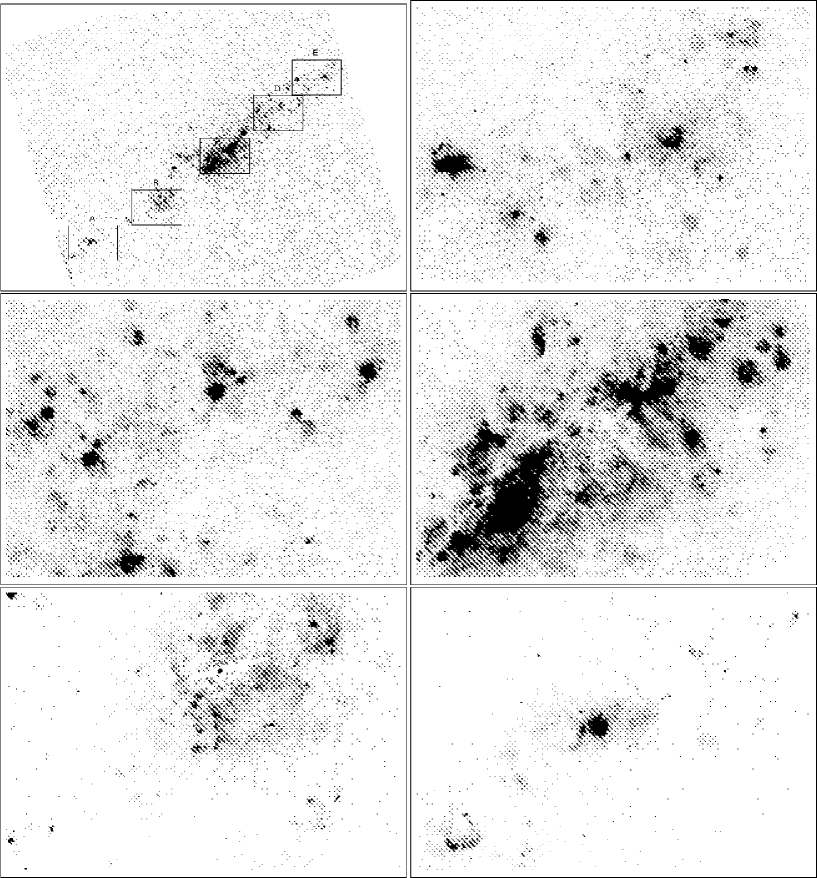
The layout of the images is as follows. In § 5.1 we present the three-color images (Figure 2), which show both the stellar and the gas distribution for all of the galaxies. In § 5.2 we present the emission line images (Figures 3, 4, 6 and 7). Each of the four figures consists of six images. The overview images are shown in the upper left corner, and the individual enlargements in the remaining five subpanels. For NGC 4700 we show an enlargement of the three-color image (Figure 5), revealing the central region. The unsharp-masked images (tracing the dust distribution), which are discussed in § 5.3, are shown in a separate figure (Figure 8), as well as the dIrr galaxy near NGC 4634 (Figure 9), presented in § 5.4.
5.1. ACS broadband imagery
We have combined the broadband and narrowband images to better display the interplay of gas and stars in the disk-halo region. Our three-color images (F625W = blue; F658N = green; continuum subtracted F658N = red) of NGC 4634, NGC 4700, NGC 5775 and NGC 7090 are presented in Figure 2. They provide us with an overview of the disk morphology, in particular the stellar distributions (i.e. star densities) within each galaxy. This information can later be used to investigate potential dependencies of halo properties on the local level of disk activity.
NGC 4634
Star forming regions (and regions of increased stellar densities) are quite wide-spread throughout the disk of NGC 4634. The broadband image shows a number of H II regions shining through the galaxy’s dust lane. Around the high surface-brightness inner disk fainter “emission” is found, probably from stars in outer spiral arms that may be slightly warped. No significant stellar overdensities are found in these outer regions.
NGC 4700
The stellar disk of NGC 4700 looks more irregular than that of NGC 4634. The dust morphology is patchy, rather than forming a continuous band along the disk plane. The most prominent star concentrations are found in the central area. The northeastern peak of the stellar distribution has a higher stellar density, than the southwestern peak. Both regions seem to be more or less equidistant from the center of the galaxy. There is one particular region located within the disk that has quite prominent extinction by dust. It is also interesting to note that the patchy dust lane is slightly skewed with respect to the stellar disk plane.
NGC 5775
NGC 5775 has a well-defined disk with evidence of widespread, high-level star formation, as indicated by copious regions of increased stellar density. Its dust lane is similar to that of NGC 4634 and more pronounced than that of NGC 4700. The dust lane is most pronounced in the outer disk regions (i.e. at large galactocentric radii). However, NGC 5775 has a relatively compact nuclear region, that has the bulk of the stellar densities.
NGC 7090
NGC 7090’s disk is similar to that of NGC 4700, with a slightly more prominent dust lane and an apparently wider, more amorphous overall appearance. The dust lane is very filamentary. Most parts of the dust lane are located in the regions above the midplane. Not much dust is present in the southern part of the disk (below the midplane). The distribution of its stellar component is asymmetric. The maximum is located to the southeast of the center, but there are several peaks of stellar density distributions along the disk.
5.2. ACS emission line images
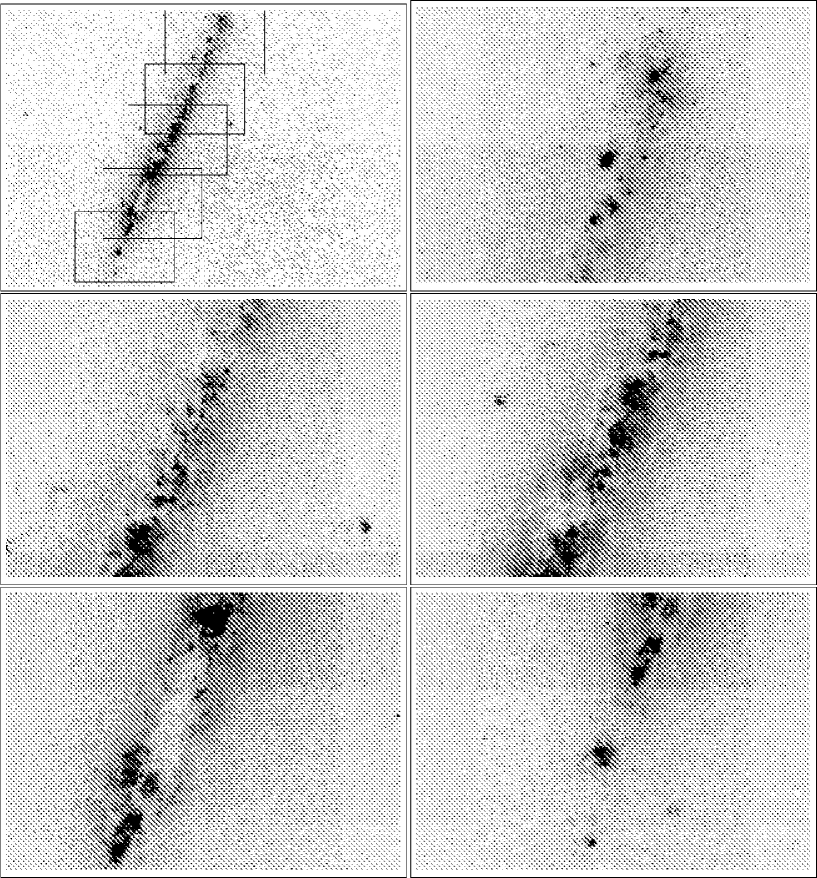
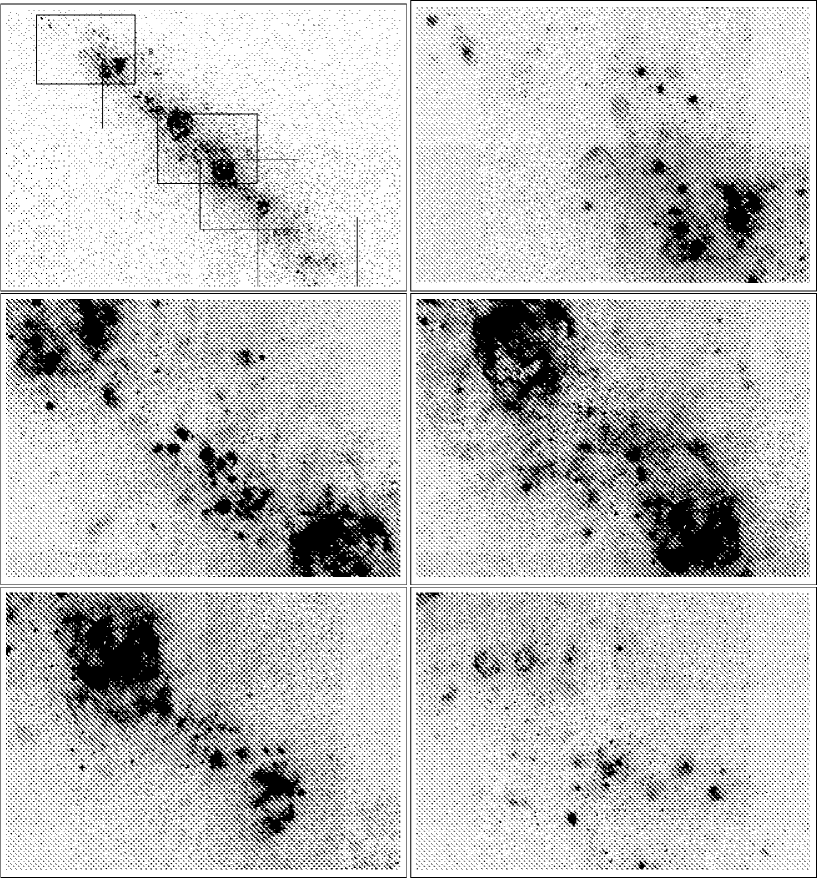
As mentioned above, these images, called “H” images, include unknown contributions from the adjacent [N II] lines and thus trace the warm interstellar emission line gas in general. Both the disk and the extraplanar gas can be studied in all four target galaxies. Images showing the full extent in the ACS field-of-view are shown for each galaxy in the upper left panel of Figures 3, 4, 6 and 7.
In addition, close-up presentations of individual areas in the four target galaxies are presented below in the five remaining sub-panels of each figure. We show five individual fields for each galaxy. Comments on the observed morphology are summarized in Table 4. We also include some information on previous ground-based studies and related disk-halo investigations from other wavelength regimes that have a direct connection to our present study.
NGC 4634
This Virgo cluster member edge-on spiral was previously imaged in the DIG context in H using ground-based data (Rossa & Dettmar, 2000). A diffuse halo was detected with an extent of 1.2 kpc above/below the galactic plane.
Extraplanar emission was also confirmed spectroscopically (Tüllmann & Dettmar, 2000; Otte et al., 2002). In addition to revealing eDIG, extraplanar dust was also detected at high galactic latitudes of about 1 kpc (Howk & Savage, 1999; Rossa & Dettmar, 2003b).
As already discussed in Rossa & Dettmar (2003a), the presence of an H halo is almost always accompanied by a hot gaseous (X-ray) halo, as high SF rates and high are strong indicators of halo emission. Not surprisingly, a hot tenuous and far more extended X-ray gaseous halo was found in NGC 4634 in the soft energy band, making use of XMM-Newton observations (Tüllmann et al., 2006). A unique feature among the studied sample of nine edge-on spirals is the absence of hard X-ray emission in NGC 4634.
Our ACS H image of NGC 4634 (see Figure 3) shows widely distributed star formation in its disk, as already suggested by the broadband image introduced above. Individual H II regions are seen through gaps in the dust lane. But there are no prominent H bubbles visible.
In the halo extended H emission is found that is, despite the superb spatial resolution of HST/ACS, unresolved (see Figure 3). No filaments, loops or similar structures are discernible, apart from a few minor exceptions at large galactocentric radii.
NGC 4700
This southern edge-on spiral was previously imaged by means of ground-based H observations (Rossa & Dettmar, 2003b). A bright halo with superimposed filaments reaching into the halo out to kpc was detected. The filaments appear to emanate from the brightest SF regions, anchored within the disk.
Also, a radio-continuum halo was detected (Dahlem et al., 2001), revealing similar shapes and maxima at the optical SF counterparts. The extent of the cosmic-ray halo is much larger than the optical halo.
Spectra of the galaxy itself have been published by Kewley et al. (2001), which show besides prominent H and [N II] emission relatively strong [O III] emission lines. However, Kewley et al. (2001) do not assign a classification for this galaxy, which they list as IRAS . An imaging HST survey of Malkan et al. (1998) lists NGC 4700 as an H II galaxy. Spectral classifications in the NASA Extragalactic Database (NED) range from H II region to Sy 2 type, so there is not a clear-cut classification available for this galaxy as of yet.
NGC 4700 (Figure 4) displays an enormous wealth of H emitters in its disk plane with a large number of bright star forming regions and many bubbles interspersed. Contrary to the rather irregular appearance of its stellar disk in the broadband image (cf. § 5.1), the H emission distribution looks much more confined to what looks like a thin disk. The ACS H image (specifically the central region displayed in Figure 5) is by far the most spectacular one in our sample. Given the distance of NGC 4700, which is very similar to NGC 5775, this represents no bias in terms of resolution (i.e. proximity). The H image reveals a very complex morphology. There are numerous faint filaments protruding into the halo region.
The circumnuclear region does not host strong SF activity, and it seems as if the bulk of the emission has been ejected into two lobe regions. These are, despite the higher densities, located within the galactic plane (roughly aligned with the disk plane) and not perpendicular to it. Nonetheless, considerable structure (e.g., filaments) is also revealed perpendicular to the disk north and south of the nuclear region. Currently we do not have any kinematic information of the lobe regions and the galaxy in general, so we can only speculate about the possible origin of the H lobes. But it seems most likely as if these were created by a powerful mass and energy ejection from the nuclear region, which may host an AGN.
On top of the disk emission an equally astounding wealth of extraplanar H emission is found, with a large number of long, thin filaments emanating vertically from the central disk plane. Several of these filaments can be traced back to individual knots of H emission in the central part of the disk, suggesting that the gas is energized from within the disk plane. The majority of the long filaments are emanating from and around regions close to the nucleus. However, we note that from optical observations (both R-band and H) no clear indication of a nucleus can be assessed.
Instead two giant SF complexes (almost equidistant from the center) are located within the disk plane, which resemble in appearance the lobe regions of a radio jet (on smaller scales, though). However, no jet is visible, nor is there any clear indication of a distinct nucleus. These shell-like structures are located within the disk, and show a radially expanding structure within the disk, where the pressure gradient is much higher as opposed to moving perpendicular to it (such as the winds in nucleated starbursts). The very edges of the disk show substantial amounts of SF. Many superbubbles and shells are detected, and there does not appear to be an abrupt cut-off in star formation within the disk. The expanding shells seem indicative of an AGN (Seyfert type), however no clear classification has been established.
NGC 5775
NGC 5775 is a well studied edge-on spiral galaxy in the disk-halo context, which was imaged extensively by ground-based observations in H (Lehnert & Heckman, 1995; Collins et al., 2000; Tüllmann et al., 2000; Rossa & Dettmar, 2003b). Extraplanar emission was imaged out to 5 kpc above the galactic plane. It is the galaxy with the highest ratio in our current sample and it is a starburst-type galaxy, although it is morphologically quite different from that of nucleated starbursts. A gaseous halo with individual H spurs or filaments, associated with the X-shaped structure of the large scale magnetic field, was discovered (Tüllmann et al., 2000).
EDIG has been detected spectroscopically even out to 9 kpc (Rand, 2000; Tüllmann et al., 2000). In addition, extended radio continuum emission has been detected as well (Hummel et al., 1991; Duric et al., 1998; Tüllmann et al., 2000). A tenuous X-ray halo, spatially coexistent (and more extended) than the radio continuum and H halo, was detected with Chandra (Strickland et al., 2004) and with XMM-Newton (Tüllmann et al., 2006). NGC 5775 appears to be interacting with its face-on companion NGC 5774, which was first indicated by H I measurements (Irwin, 1994).
In NGC 5775 quite a large number of prominent H II regions is found in its disk plane, together with a number of bubbles (see Figure 6). The disk is surrounded by extended H emission that is not resolved into individual structures. The extraplanar H emission is strongest and widest in the central area, where the level of star formation in the disk is also the highest, but appears to be truly diffuse. The high spatial resolution of our HST/ACS images does not allow for the detection of the very faint surface emission of the filaments. Unfortunately, the background artifacts discussed in § 4.1 did not allow to bin the data.
NGC 7090
This southern edge-on spiral is the galaxy with the smallest in our current sample, and it was imaged in H before, using ground-based data (Rossa & Dettmar, 2003b). These images already revealed an inhomogeneous layer of extended DIG, which seems to correlate spatially with the star formation regions within the disk. In addition to this H study, an extended radio continuum halo was detected as well (Dahlem et al., 2001), based on ATCA observations with different configurations at frequencies of 1.43 GHz and 2.45 GHz. The measured scale-heights for these observations range from 1.19 to 2.16 kpc.
The overview image of our ACS H emission line image of NGC 7090 (see top left panel of Figure 7) confirms the asymmetry of the star formation activity in its disk very clearly. To the east of the nuclear region there is a big apparent gap in the H emission distribution. In general, the eastern half of the galaxy disk is considerably less active than the western one. Part of this can be attributed to dust, which is prominently visible in the broadband image.
The image also reveals that there are not just H II regions (as traced by diffuse, high surface-brightness H emission) in the disk, but lots of individual, resolved bubbles in addition. These are not only present in the more active western half, but also to the east, where a few individual bubbles are found out to large galactocentric radii.
Images of individual regions in H reveal the presence of a multitude of conspicuous, resolved individual structures, including partial loops and filaments perpendicular to the disk plane. A few of the extended filaments are detected in the southern part of the galaxy. These connect visibly to the bright star forming regions in the disk (see middle right panel of Figure 7).
It is obvious that the H emission distribution is apparently widest above regions with the most active star formation in the disk. There are a multitude of bubbles and supershells detected (see top right and middle left panels of Figure 7).
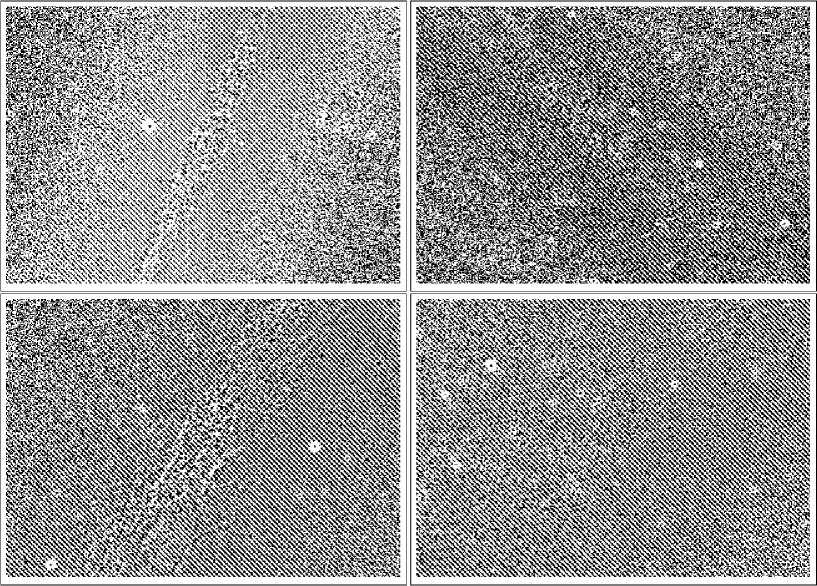
5.3. Dust features in the ACS broadband images
Filtering the low spatial frequencies out of the F625W broadband images, one can study the smaller-scale absorption features caused by dust in front of background stellar emission.
Apart from the gaseous constituents of the ISM in galaxies, dust is also present on both small and large scales. To understand the morphology of the extraplanar ISM in our target galaxies, it is interesting to compare the structure of extraplanar dust to that of the gaseous emission filaments. For this purpose, similarly to the previously studied cases, we have created unsharp-masked versions of the broadband F625W (SDSS ) images to enhance the contrast between those absorbing high spatial frequency dust structures and the smoother distribution of the background light from the galaxy’s stellar populations.
Despite the fact that our target galaxies were selected to have a less dusty plane than galaxies such as NGC 891 (Howk & Savage, 1997; Rossa et al., 2004), there are still sufficient numbers of small-scale dust filaments for such a comparison. Due to the fact that we only obtained broadband images in one waveband (the basic reason being that these are only used for the continuum subtraction), we cannot quantify the physical properties of the dust. We therefore only qualitatively describe the extraplanar dust content in these galaxies with respect to the eDIG morphology.
The images are shown in Figure 8. They reveal that the distribution of the dust filaments is also quite different among the four target galaxies. NGC 4634 and NGC 5775 show the most prominent features, whereas NGC 4700 and NGC 7090 have the least extraplanar dust features. For NGC 4700, in particular, but also to some extent for NGC 7090, the presence of many resolved stars in the disk make an analysis relatively difficult, as the smoothing process creates some artifacts around the stars, which overlap prominently in the crowded field. Therefore, a direct one-to-one comparison of dust filaments with emission line features (e.g., filaments) is only possible for NGC 4634 and NGC 5775.
However, as presented in § 5.2, there are a few large-scale H filaments discernible at high galactic latitudes in NGC 4634 and NGC 5775. The distribution of dust structures in NGC 4634 show both alignment parallel and perpendicular to the disk, whereas generally at higher the dust (sometimes very filamentary) is aligned perpendicular to the disk. But it should be noted that this is only true for the western side of the galaxy. The distribution of dust features on the other side (east of the center) is somewhat more confined to the disk and oriented more parallel than perpendicular, but mostly a random mix of orientations. It should also be noted that the dust features are not correlated on a one-to-one basis with the H filaments. This was already stated earlier (Howk & Savage, 1999; Rossa & Dettmar, 2003b), based on groundbased observations.
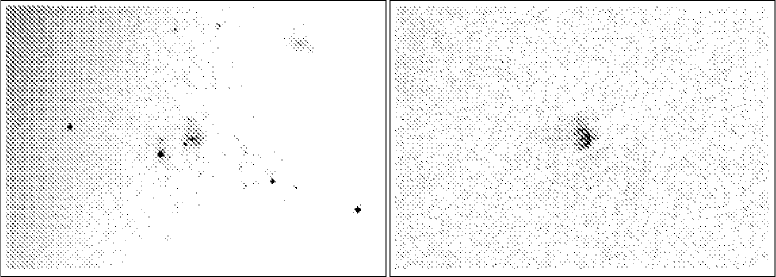
5.4. Dwarf irregular galaxy in the halo of NGC 4634
With our high spatial resolution HST/ACS observations, we are able to re-investigate the extraplanar blob, detected by us in the halo of NGC 4634, which was named Patch 1 (Rossa & Dettmar, 2000). We had concluded from our previous ground-based observations that this patch may either be an extraplanar SF region or a dwarf galaxy in the halo of NGC 4634, given that the FWHM of the used filter excluded the possibility of a foreground or background object.
Our deep HST/ACS broadband and narrowband observations now clearly indicate that this patch is a galaxy. The narrowband F658N observations reveal a complex system composed of several knots associated with gas, reminiscent of a dwarf irregular (dIrr) galaxy (see Figure 9). The broadband image reveals several individual star associations that are resolved in this dIrr galaxy, and the major morphology looks reminiscent of a satellite merger galaxy, showing hints of tidal streams owing to the gravitational attraction from NGC 4634. Given the peculiar morphology, this dIrr galaxy is possibly already in the early process of producing a minor merger with its parent galaxy (NGC 4634). It should be noted that the broadband image shows a very thick stellar disk of NGC 4634, unlike any of the other studied edge-on galaxies. This is consistent with scenarios in which disk thickening is the result of a previous interaction, possibly previous minor mergers (e.g., Yoachim & Dalcanton, 2006; Wyse et al., 2006).
Augmented longslit spectra (R.-J. Dettmar et al. 2008, in preparation) seem to strengthen this interpretation of Patch 1 being a dIrr galaxy, which is deficient in [N II] and [S II], based on emission line diagnostics. Henceforth, we label this galaxy as +141751.83, which refers to the coordinates of the brightest H emission region in its central part. We will report on the physical properties and stellar populations of this interesting dIrr galaxy in detail in a future paper.
5.5. Ancillary data
The HST/ACS data presented above were obtained as part of a multi-wavelength observing campaign. For the galaxies presented here we have other, independent measurements of various phases of the ISM in their halos published by us previously, including X-ray data (Tüllmann et al., 2006, Ehle et al. 2008, in preparation) and radio-continuum data (Tüllmann et al., 2000; Dahlem et al., 2001). A correlation study of the ACS data with other tracers of extraplanar gas in this sample galaxies will be presented separately, as some of the observations are still pending.
6. DISCUSSION
6.1. EDIG morphology as a function of SF activity
Over roughly the past decade and a half evidence has been mounting that extended gaseous halos around late-type spiral galaxies are formed as a consequence of the star formation activity in the underlying disks. A high IRAS integral flux ratio , which is a measure of a high mean dust temperature in galaxies, was identified as a very reliable indicator of massive star formation (Heckman et al., 1990).
In such a scenario, emission features in gaseous halos are expected to be closely tied to the energy input rate, which is required to exceed a threshold to drive outflows perpendicular to the disk plane in the first place. This was first addressed by Dahlem et al. (1995) for radio data and later derived from optical narrowband imagery (Rand, 1996; Rossa & Dettmar, 2003a). More recently, Dahlem et al. (2006) have shown that there is a correlation of the existence of galaxy halos (detected in radio continuum and H observations) not only with the global energy injection rate, but also with the local energy input level in a galaxy and, in addition, with its mass density. We will investigate in the following whether the eDIG properties of the galaxies in the present sample can be explained in this context.
The two galaxies with filamentary eDIG structures are NGC 4700 and NGC 7090. As tabulated in Table 3, these are the two galaxies at the lower end of the energy input range (). On the other hand, NGC 4634 and NGC 5775 display only unresolved extraplanar H emission. These two galaxies have higher energy input rates from massive star formation in their disks. Accordingly, one might expect them to have a larger number of individual sites of star formation and thus also a larger amount of associated halo emission.
One might naively expect this difference to be an observational artifact, based on the assumption that physically larger and more massive galaxies just have more of everything. More star formation regions lead to more filaments emanating from the disks, potentially leading to a quasi-diffuse eDIG structure caused by the superposition of many individual filaments. However, there are no indications of filaments being detected in the more massive galaxies of the present sample (NGC 4634 and NGC 5775) and also other galaxies studied previously, in areas where the spatial density of star-forming regions decreases, e.g., near the radial edges of their disks. The difference in eDIG morphologies is equally unlikely to be caused by a distance bias, because NGC 4700 (with a filamentary eDIG) and NGC 5775 (with a diffuse eDIG) are at roughly equal distances (see Table 1). Again, this makes it unlikely that the diffuse eDIG is the result of an unresolved superposition of many filaments.
A first indication at what might cause this difference can be gleaned by studying various properties of the sample galaxies. NGC 4634 and NGC 5775 are the two galaxies with diffuse eDIG, one of them is also the most massive galaxy in the present sample (see Table 3). From the width of the H I emission line we derive an estimated total mass for NGC 5775 of about . Interestingly though, in contrast, the mass of NGC 4634 is almost a factor of two below that of NGC 7090. So this complicates the interpretation that the mass alone is a sensitive indicator for the morphology of eDIG.
The general trend and the earlier work by Dahlem et al. (2006) indicate that the mass (or mass density) of a galaxy is an important control parameter for the morphology of the eDIG. Low mass galaxies such as the dwarf NGC 55 (e.g., Tüllmann et al., 2003), NGC 2188 (Domgörgen & Dettmar, 1997) and the blue compact dwarf galaxy IZw18 (e.g., Hunter & Thronson, 1995) show filamentary structure, whereas the more massive galaxies (with widespread star formation, not the powerful nucleated starbursts; e.g., NGC 891 (Rossa et al., 2004)) tend to have relatively smooth layers of eDIG. An explanation for this could be the fact that the gas can overcome the gravitational potential wells of the galaxies more easily. The range of masses spanned by our sample is rather small (see Table 3), so it may not be surprising that any trends with mass are less clear in our sample than those observed in samples that contains both dwarf and giant galaxies.
Of our targets only NGC 7090 and, to a lesser degree, NGC 4700, contain bubbles, shells or supershells. In NGC 7090 a large number of such features, of various sizes, are found. Also, the SF regions in this galaxy are loosely scattered within the disk, and the major outflows are confined to only one side above the disk (see descriptions of the eDIG morphology in the individual regions within each galaxy listed in Table 4).
Among our studied sample, the resolved small-scale DIG halo morphology is showing a clear dependence on the star formation rate per unit area . That is, galaxies with (in units of ), show a smooth, diffuse DIG halo, as opposed to the galaxies with values , which show primarily filamentary DIG. The studied galaxies thus can be arranged into a sequence of eDIG diffuseness as a function of . More generally speaking, there is a morphological DIG sequence among SF galaxies observed evolving from galaxies which reveal mostly bubbles and supershells to galaxies which show filamentary emission and to cases which have smooth eDIG layers (i.e. halos). Where there are bubbles (i.e. enclosed structures) the breakout condition cannot have been met yet.
6.2. The role of the intergalactic environment
Although it has been established that eDIG originates from the SF regions within the disk, the galactic environment in which the individual galaxies reside, is of course of importance, too. It may, e.g., contribute to the extent of the emission that is detected.
Of the four galaxies studied here, two (NGC 4634 and NGC 5775) have nearby companion galaxies (i.e. they form galaxy pairs). NGC 4700 and NGC 7090, in contrast, are rather isolated spirals.
Our current sample is not large enough to draw any statistical conclusions. But since one galaxy from each category has a filamentary and the other a diffuse eDIG morphology, the presence of a nearby companion does not appear to dominate the eDIG properties in these cases. However, significant exceptions may be expected in dense group environments, where galaxies experience effects such as ram pressure stripping (e.g., Kenney & Koopmann, 1999).
6.3. Clues from observations at other wavebands
It is important to ask whether or not there seems to be a more global connection between the various ISM constituents that are responsible for driving a kiloparsec outflow or wind. Obviously, there is a connection linking the various ISM phases as described for modest galaxy samples (e.g., Tüllmann et al., 2006; Dahlem et al., 2006), but the details are far from being well understood.
From the sample of Tüllmann et al. (2006), it was concluded that the presence of a diffuse ionized gas halo was always accompanied by a grand scale X-ray halo, which generally revealed that the hot tenuous gas is far more extended than the DIG. In those cases also a cosmic ray halo, traced by radio-continuum observations, was discovered. Linking the cosmic-ray halo to the DIG halo, showed clear evidence that the mass surface density was a good proxy for the presence of a gaseous halo. The mass of the stellar disk (), derived from K-band observations, is divided by the area of the optical disk (), which yields the mass surface density.
For NGC 4700 a value of was determined (Dahlem et al., 2006). Despite having higher values than the more quiescent galaxies, this is a rather modest number compared to local starburst galaxies which can have mass surface densities of up to eight times as high.
However, does the mass density critically control whether a galaxy has a kiloparsec outflow or rather a more filament-driven DIG morphology? Our present sample is certainly too small to answer this question unambiguously, as two galaxies each fall into the category of either having a filamentary DIG morphology, or showing a more smooth DIG layer.
6.4. Observations confront Theory: Where have all the Chimneys gone?
One of the greatest challenges any theoretical concept poses is how accurately it can reflect or predict the observational details. In terms of the chimney model (Norman & Ikeuchi, 1989), past observations from different wavebands, both in galactic and extragalactic studies, have failed to reveal many of these structures that were predicted. More specifically, the number of predicted chimneys is of the order of several hundred in a galaxy of modest SF activity. Yet, only very few chimneys have been detected, if any at all. So the prediction falls short by at least two orders of magnitudes. Previous reports include a Galactic chimney in the Perseus arm (Normandeau et al., 1996) and the Galactic chimney GSH (McClure-Griffiths et al., 2003) as well as evidence for a chimney breakout in the Galactic supershell GSH (McClure-Griffiths et al., 2006). Extragalactic chimneys or structures identified as such so far have been observed only in the starburst galaxy M 82 (Wills et al., 1999; García-Burillo et al., 2001). But we have to carefully consider whether this is due to an observational bias or attributed to certain physical contraints.
Previously, NGC 891 was imaged in H (Rossa et al., 2004), where no evidence was found for the chimney mode. However, the situation in NGC 891 is complicated by the fact that it has a very prominent dust layer, which possibly could have obscured any chimney structures (i.e. chimney walls) in the lower disk-halo interface ( pc). Therefore, those structures could have gone undetected even if they existed. Our currently studied galaxies by and large have a much less dusty galactic midplane, so the effects of dust obscuration should be considerably mitigated.
However, from our imaging studies it is obvious that there are no clear indications for the chimney mode in these actively star forming galaxies. In NGC 4634 and NGC 5775 there are no such structures observed in H. Are there indications of other related phenomena? Evidently, there are several features (e.g., curved filaments) visible whose morphology show an almost closed loop, indicative of the galactic fountain scenario. However, without detailed knowledge of the kinematics (e.g., mapping of the velocity field) we cannot say what parts of the looped filament are still moving upward and what parts possibly are already descending. Furthermore, multiple episodes of SF driven outflows may have altered the geometry of the outflows along the line of sight. Hence the chimney structures may look like sheets, or picked up more complex structures generated by overlapping filaments. Nonetheless, it seems obvious that these features are associated with an SF driven outflow.
Recent models by Tasker & Bryan (2006) simulated the star formation in galactic disks involving feedback by SNe. The density, temperature, and pressure maps (see their Figure 6) show copious amounts of warm and hot gas being driven into the halo regions, extending out to a few kiloparsecs. In particular, those simulations look very reminiscent to the morphology seen in our H image of NGC 4700 on a global scale. More recent models of a galactic wind as seen in starburst galaxies (Cooper et al., 2008) replicate very detailed structures including the filamentary morphology seen as for instance in M 82. While considerable progress has been achieved in modeling even small scale structures in a magnetized ISM (e.g., de Avillez & Breitschwerdt, 2005), more refined simulations are necessary in order to compare them to the high spatial resolution multi-structured eDIG observations, as those presented in this study.
7. SUMMARY
We have observed four edge-on spiral galaxies with different levels of star formation in H with the HST/ACS to study the morphology of their extraplanar DIG (eDIG). The distribution of the eDIG is very different among the sample galaxies. While the eDIG is very filamentary in NGC 4700 and in NGC 7090, the distribution of the eDIG in NGC 4634 and NGC 5775 is remarkably smooth. The latter two galaxies have the highest SF rate per unit area in our sample and NGC 5775 is also the most massive galaxy in the sample.
Based on our current and earlier results, we conclude that the observed differences are probably a consequence of their different levels of SF activity and their total masses and/or mass densities. Whereas the SF rate per unit area controls the presence (e.g., the radial extent), shape and amount of eDIG in a galaxy’s halo, the total mass or mass density seems to be at least in part responsible for the actual shape of the eDIG. This is corroborated by a comparison of the morphology of the lower-mass galaxies to those of SF dwarf galaxies such as NGC 55 or the blue compact dwarf IZw18. The more massive galaxies with active SF seem to expell their gaseous outflows more globally and diffusively.
The studied galaxies can be arranged into a sequence of eDIG diffuseness as a function of star formation activity per unit area. More generally speaking, there is a morphological DIG sequence among SF galaxies, which evolves from galaxies which reveal mostly bubbles and supershells to galaxies which show filamentary emission to cases of intense SF which reveal smooth eDIG layers (i.e. halos).
References
- Bregman (1980) Bregman, J. N. 1980, ApJ, 236, 577
- Cecil et al. (2001) Cecil, G., Bland-Hawthorn, J., Veilleux, S., & Filippenko, A. V. 2001, ApJ, 555, 338
- Cecil et al. (2002) Cecil, G., Bland-Hawthorn, J., & Veilleux, S. 2002, ApJ, 576, 745
- Collins et al. (2000) Collins, J. A., Rand, R. J., Duric, N., & Walterbos, R. A. M. 2000, ApJ, 536, 645
- Cooper et al. (2008) Cooper, J. L., Bicknell, G. V., Sutherland, R. S., & Bland-Hawthorn, J. 2008, ApJ, 674, 157
- Dahlem (1997) Dahlem, M. 1997, PASP, 109, 1298
- Dahlem et al. (1994) Dahlem, M., Dettmar, R.-J., & Hummel, E. 1994, A&A, 290, 384
- Dahlem et al. (1995) Dahlem, M., Lisenfeld, U., & Golla, G. 1995, ApJ, 444, 119
- Dahlem et al. (2006) Dahlem, M., Lisenfeld, U., & Rossa, J. 2006, A&A, 457, 121
- Dahlem et al. (2001) Dahlem, M., Lazendic, J. S., Haynes, R. F., Ehle, M., & Lisenfeld, U. 2001, A&A, 374, 42
- de Avillez (2000) de Avillez, M. A. 2000, MNRAS, 315, 479
- de Avillez & Breitschwerdt (2005) de Avillez, M. A., & Breitschwerdt, D. 2005, A&A, 436, 585
- Dettmar (1990) Dettmar, R.-J. 1990, A&A, 232, L15
- Dettmar (1992) Dettmar, R.-J. 1992, Fund. Cosm. Phys., 15, 143
- Domgörgen & Dettmar (1997) Domgörgen, H. & Dettmar, R.-J. 1997, A&A, 322, 391
- Duric et al. (1998) Duric, N., Irwin, J. A., & Bloemen, H. 1998, A&A, 331, 428
- Ferguson et al. (1996) Ferguson, A. M. N., Wyse, R. F. G., Gallagher, J. S., & Hunter, D. A. 1996, AJ, 111, 2265
- García-Burillo et al. (2001) García-Burillo, S., Martin-Pintado, J., Fuente, A., & Neri, R. 2001, ApJ, 563, L27
- Giavalisco (2004) Giavalisco, M. 2004, Instrument Science Report ACS 2004-12, (Baltimore: STScI)
- Gonzaga et al. (2005) Gonzaga, S., et al. 2005, ACS Instrument Handbook, Version 6.0, (Baltimore: STScI)
- Heckman et al. (1990) Heckman, T. M., Armus, L., & Miley, G. K. 1990, ApJS, 74, 833
- Hoopes et al. (1999) Hoopes, C. G., Walterbos, R. A. M., & Rand, R. J. 1999, ApJ, 522, 669
- Howk & Savage (1997) Howk, J. C., & Savage, B. D. 1997, AJ, 114, 2463
- Howk & Savage (1999) Howk, J. C., & Savage, B. D. 1999, AJ, 117, 2077
- Howk & Savage (2000) Howk, J. C., & Savage, B. D. 2000, AJ, 119, 644
- Hummel et al. (1991) Hummel, E., Beck, R., & Dettmar, R.-J. 1991, A&AS, 87, 309
- Hunter & Thronson (1995) Hunter, D. A., & Thronson, H. A., Jr., 1995, ApJ, 452, 238
- Irwin (1994) Irwin, J. A. 1994, ApJ, 429, 618
- Kenney & Koopmann (1999) Kenney, J. D. P., & Koopmann, R. A. 1999, AJ, 117, 181
- Kennicutt (1998) Kennicutt, R. C., Jr. 1998, ARA&A, 36, 189
- Kewley et al. (2001) Kewley, L. J., Heisler, C. A., Dopita, M. A., & Lumsden, S. 2001, ApJS, 132, 37
- Koekemoer et al. (2005) Koekemoer, A. M., Fruchter, A. S., Hook, R. N., Hack, W., & Hanley, C. 2005, in: The 2005 HST Calibration Workshop, eds. A. M. Koekemoer, P. Goudfrooij, L. L. Dressel, (Baltimore: STScI)
- Lehnert & Heckman (1995) Lehnert, M. D., & Heckman, T. M. 1995, ApJS, 97, 89
- Mac Low & Ferrara (1999) Mac Low, M.-M., & Ferrara, A. 1999, ApJ, 513, 142
- Malkan et al. (1998) Malkan, M. A., Gorjian, V., & Tam, R. 1998, ApJS, 117, 25
- McClure-Griffiths et al. (2003) McClure-Griffiths, N. M., Dickey, J. M., Gaensler, B. M., & Green, A. J. 2003, ApJ, 594, 833
- McClure-Griffiths et al. (2006) McClure-Griffiths, N. M., Ford, A., Pisano, D. J., Gibson, B. K., Staveley-Smith, L., Calabretta, M. R., Dedes, L., & Kalberla, P. M. W. 2006, ApJ, 638, 196
- Miller & Veilleux (2003) Miller, S. T., & Veilleux, S. 2003, ApJS, 148, 383
- Norman & Ikeuchi (1989) Norman, C. A., & Ikeuchi, S. 1989, ApJ, 345, 372
- Normandeau et al. (1996) Normandeau, M., Taylor, A. R., & Dewdney, P. E. 1996, Nature, 380, 687
- Oey et al. (2007) Oey, M. S., et al. 2007, ApJ, 661, 801
- Otte et al. (2002) Otte, B., Gallagher, J. S., III, & Reynolds, R. J. 2002, ApJ, 572, 823
- Pavlovsky et al. (2005) Pavlovsky, C., et al. 2005, ACS Data Handbook, Version 4.0 (Baltimore: STScI)
- Pildis et al. (1994) Pildis, R. A., Bregman, J. N., & Schombert, J. M. 1994, ApJ, 427, 160
- Rand (1996) Rand, R. J. 1996, ApJ, 462, 712
- Rand (2000) Rand, R. J. 2000, ApJ, 537, L13
- Rand et al. (1990) Rand, R. J., Kulkarni, S. R., & Hester, J. J. 1990, ApJ, 352, L1
- Rand et al. (1992) Rand, R. J., Kulkarni, S. R., & Hester, J. J. 1992, ApJ, 396, 97
- Robitaille et al. (2007) Robitaille, T. P., Rossa, J., Bomans, D. J., & van der Marel, R. P. 2007, A&A, 464, 541
- Rossa & Dettmar (2000) Rossa, J., & Dettmar, R.-J. 2000, A&A, 359, 433
- Rossa & Dettmar (2003a) Rossa, J., & Dettmar, R.-J. 2003a, A&A, 406, 493
- Rossa & Dettmar (2003b) Rossa, J., & Dettmar, R.-J. 2003b, A&A, 406, 505
- Rossa et al. (2004) Rossa, J., Dettmar, R.-J., Walterbos, R. A. M., & Norman, C. A. 2004, AJ, 128, 674
- Sandage & Tammann (1990) Sandage, A., & Tammann, G. A. 1990, ApJ, 365, 1
- Sanders et al. (2003) Sanders, D. B., Mazzarella, J. M., Kim, D.-C., Surace, J. A., & Soifer, B. T. 2003, AJ, 126, 1607
- Schlegel et al. (1998) Schlegel D. J., Finkbeiner, D. P., & Davis, M. 1998, ApJ, 500, 525
- Shapiro & Field (1976) Shapiro, P. R., & Field, G. B. 1976, ApJ, 205, 762
- Strickland et al. (2004) Strickland, D. K., Heckman, T. M., Colbert, E. J. M., Hoopes, C. G., & Weaver, K. A. 2004, ApJS, 151, 193
- Tasker & Bryan (2006) Tasker, E. J., & Bryan, G. L. 2006, ApJ, 641, 878
- Thompson et al. (2004) Thompson, T. W. J., Howk, J. C., & Savage, B. D. 2004, AJ, 128, 662
- Tüllmann & Dettmar (2000) Tüllmann, R., & Dettmar, R.-J. 2000, A&A, 362, 119
- Tüllmann et al. (2000) Tüllmann, R., Dettmar, R.-J., Soida, M., Urbanik, M., & Rossa, J. 2000, A&A, 364, L36
- Tüllmann et al. (2003) Tüllmann, R., Rosa, M. R., Elwert, T., Bomans, D. J., Ferguson, A. M. N., & Dettmar, R.-J. 2003, A&A, 412, 69
- Tüllmann et al. (2006) Tüllmann, R., Pietsch, W., Rossa, J., Breitschwerdt, D., & Dettmar, R.-J. 2006, A&A, 448, 43
- Veilleux et al. (2005) Veilleux, S., Cecil, G., & Bland-Hawthorn, J. 2005, ARA&A, 43, 769
- Walterbos & Braun (1994) Walterbos, R. A. M., & Braun, R. 1994, ApJ, 431, 156
- Wills et al. (1999) Wills, K. A., Redman, M. P., Muxlow, T. W. B., & Pedlar, A. 1999, MNRAS, 309, 395
- Wyse et al. (2006) Wyse, R. F. G., Gilmore, G., Norris, J. E., Wilkinson, M. I., Kleyna, J. T., Koch, A., Evans, N. W., & Grebel, E. K. 2006, ApJ, 639, L13
- Yoachim & Dalcanton (2006) Yoachim, P., & Dalcanton, J. J. 2006, AJ, 131, 226

.
| Galaxy | R.A. (J2000.0) | Decl. (J2000.0) | Classification | |||
|---|---|---|---|---|---|---|
| (km s-1) | (Mpc) | (mag) | ||||
| (1) | (2) | (3) | (4) | (5) | (6) | (7) |
| NGC 4634 (catalog ) | 12 42 41.00 | 14 17 46.0 | SBcd | 221 | 19.1 | 0.093 |
| NGC 4700 (catalog ) | 12 49 07.32 | 11 24 45.6 | SB(s)c | 1386 | 24.0 | 0.156 |
| NGC 5775 (catalog ) | 14 53 57.60 | 03 32 40.1 | SBc | 1768 | 26.7 | 0.139 |
| NGC 7090 (catalog ) | 21 36 28.61 | 54 33 26.2 | SBc | 642 | 11.4 | 0.076 |
Note. — Col. (1): Galaxy name. Col. (2) and (3): Right ascension and declination from the NASA Extragalactic Database (NED). Units of right ascension are hours, minutes and seconds, and units of declination are degrees, arcminutes and arcseconds. Col. (4): Morphological classification given by NED. Col. (5): Systemic velocity corrected for Virgocentric infall using the model of Sandage & Tammann (1990), as taken from LEDA. Col. (6): Distance, taken as listed in Rossa & Dettmar (2000, 2003b). Col. (7): Galactic foreground extinction (Schlegel et al., 1998) in the -band for from NED.
| Galaxy | Data set ident. | Obs. Date | ACS-channel | Filter | FWHM | Dither | P.A. | ||
|---|---|---|---|---|---|---|---|---|---|
| (Å) | (Å) | (sec) | () | ||||||
| (1) | (2) | (3) | (4) | (5) | (6) | (7) | (8) | (9) | (10) |
| NGC 4634 | j95x01 | 2005 Jun 24 | WFC | F625W | 6318 | 1442 | 2308.0 | 125.596 | |
| NGC 4634 | j95x01 | 2005 Jun 24 | WFC | F658N | 6584 | 78 | 6888.0 | 125.596 | |
| NGC 4700 | j95x02 | 2005 Jul 30 | WFC | F625W | 6318 | 1442 | 2308.0 | 115.209 | |
| NGC 4700 | j95x02 | 2005 Jul 30 | WFC | F658N | 6584 | 78 | 6888.0 | 115.209 | |
| NGC 5775 | j95x03 | 2005 Aug 21 | WFC | F625W | 6318 | 1442 | 2292.0 | 101.544 | |
| NGC 5775 | j95x03 | 2005 Aug 21 | WFC | F658N | 6584 | 78 | 6848.0 | 101.544 | |
| NGC 7090 | j95x04 | 2005 Jun 23 | WFC | F625W | 6318 | 1442 | 2508.0 | 72.289 | |
| NGC 7090 | j95x04 | 2005 Jun 23 | WFC | F658N | 6584 | 78 | 7496.0 | 72.289 |
Note. — Col. (1): Galaxy name. Col. (2) Data set identifier in the HST Data Archive. Col. (3): Date of observations. Col. (4): ACS-aperture (WFC: Wide Field Channel). Col. (5), (6) and (7): Filter properties, namely the identifier, central wavelength and full width at half maximum, respectively. Col. (8) Total exposure time, which is the sum of the individual dithered images. Col. (9) Used dither pattern (primary- and sub-pattern). Col. (10): Orientation angle at which the observations were performed.
| Property | NGC 4634 | NGC 4700 | NGC 5775 | NGC 7090 |
|---|---|---|---|---|
| Disk morphology | regular? | irregular | regular | asymmetric |
| eDIG morphology | diffuse | filamentary | diffuse | filamentary |
| Interaction | yes | no | yes | no |
| SF distribution | extended | extended | extended | part disk |
| 1.08 | 1.00 | 9.86 | 0.58 | |
| 0.3720 | 0.5074 | 0.4240 | 0.4129 | |
| 11.9 | 5.0 | 29.6 | 2.4 | |
| X-ray halo | yes | … | yes | yes? |
| Radio halo | extended disk | yes | yes | yes |
| … | … | yes | yes |
Note. — The total galaxy mass in units of solar masses, listed in Row (1) was calculated from H i measurements using the relation . A(0) is calculated either from or D[H i] and has units of kpc, and is the inclination corrected full width W[H i] in units of km/s. Row (2) describes the disk morphology and Row (3) is the eDIG morphology. Row (4) describes whether the galaxy is interacting or not. Row (5) lists the SF distribution. Row (6) lists the star formation rate. The SFR’s are calculated based on FIR data and using the relatation given by Kennicutt (1998). Row (7) is the IRAS flux ratio at m and m. These are based on the newly calibrated data from Sanders et al. (2003). Row (8) lists the SFR per unit area, expressed as FIR luminosity () divided by the diameter of the optical 25th magnitude isophote diameter squared. Row (9) and (10) list whether the galaxy has detections of extended emission in the X-ray and radio regime, respectively. The preliminary X-ray analysis of shallow XMM-Newton data of NGC 7090 shows the indication of an X-ray halo. This has to be confirmed by deeper observations, which are already scheduled. For NGC 4700 X-ray observations are still pending. No radio halo was detected in NGC 4634, but based on low-resolution data obtained with the 100m Effelsberg radio telescope at 2.8 cm, at least an extended disk is revealed (J. Rossa, unpublished). Finally, Row (11) lists measured magnetic field vectors perpendicular to the disk.
| Galaxy | Region | Morphology | Ref. Figure |
|---|---|---|---|
| (1) | (2) | (3) | (4) |
| NGC 4634 | A | mostly diffuse | Figure 3b |
| many compact SF regions | |||
| few shells SF regions | |||
| B | mostly diffuse | Figure 3c | |
| dIrr galaxy to the SW | |||
| C | mostly diffuse | Figure 3d | |
| bright shells/supershells interspersed with dust clouds | |||
| D | mostly diffuse | Figure 3e | |
| bright SF region (top) | |||
| small-scale filaments surrounding bright shells | |||
| prominent dust cloud | |||
| E | two isolated shells/SF regions | Figure 3f | |
| off-planar feature (to the SW) | |||
| NGC 4700 | A | many superbubbles | Figure 4b |
| filaments protruding from bright shells | |||
| B | superbubbles | Figure 4c | |
| very filamentary | |||
| bright supershell (to the SW) | |||
| C | spectacular central “radio lobe” structure | Figure 4d | |
| filaments protruding from central region | |||
| compact SF regions scattered (mostly off-planar) | |||
| D | southern extension of central structure | Figure 4e | |
| filamentary + bright shells | |||
| E | superbubbles | Figure 4f | |
| few filaments | |||
| NGC 5775 | A | mostly diffuse | Figure 6b |
| several bright SF regions of various sizes | |||
| B | mostly diffuse | Figure 6c | |
| few bright SF regions of various sizes | |||
| C | bright SF regions | Figure 6d | |
| patchy dust regions interspersed | |||
| D | faint diffuse emission | Figure 6e | |
| few bright SF regions of various sizes | |||
| E | very bright and complex SF region | Figure 6f | |
| diffuse surrounding breaking up into filaments | |||
| NGC 7090 | A | few bright filamentary SF regions | Figure 7f |
| many smaller SF regions interspersed | |||
| B | complex filamentary SF region around bright star | Figure 7e | |
| few smaller SF regions interspersed | |||
| C | very bright SF regions | Figure 7d | |
| copious filaments emanating from SF regions | |||
| few compact off-planar SF regions | |||
| D | mainly bubbles and superbubbles | Figure 7c | |
| faint diffuse DIG superimposed | |||
| E | few bright SF regions | Figure 7b | |
| bubbles, superbubbles, complex filaments |
Note. — Col. (1) lists the galaxy identifier. Col. (2) lists the specific region under study within each galaxy (labeled by identifiers A,…,E), and with the described morphology in Col. (3) as revealed in the corresponding figures, indicated by Col. (4). The reference figure labeling refers to the following subpanel positions within the individual figures: b = top right, c = middle left, d = middle right, e = bottom left, f = bottom right.